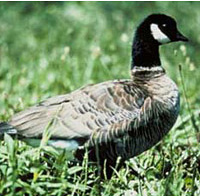
Aleutian Canada goose (Branta hutchinsii leucopareia)
| Status: Delisted | Critical habitat: none |
| Listed: 3/11/1967 | Recovery plan: 9/30/1991 |
Range: AK(b), CA(s), OR(s), WA(m) ---
SUMMARY
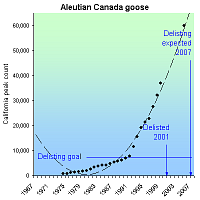
In the 1960s the Aleutian Canada goose was feared extinct due to predation by non-native foxes introduced to its nesting island, and to a less degree, by excessive hunting and loss of winter and migration habitat. It was rediscovered in 1962. In 1967 it was listed as an endangered species and grew from ~790 birds in 1975 to ~60,000 in 2005. It was declared recovered and removed from the endangered list in 2001, seven years earlier than projected by its recovery plan.
RECOVERY TREND
The Aleutian Canada goose was an abundant subspecies of Canada goose that nested in the northern Kuril and Commander Islands, in the Aleutian Archipelago, and on islands south of the Alaska Peninsula east to near Kodiak Island [1]. The birds wintered in Japan and in the coastal western United States to Mexico [1].
The fur industry began introducing Arctic and red foxes to the goose's nesting islands 1750, reaching a peak between 1915 and 1939 [2]. Foxes were released on 190 islands within the Aleutian Canada goose’s breeding range in Alaska [1]. They decimated the species by predating heavily on eggs, goslings and flightless molting geese.
Hunting, especially on the migration and wintering range in California, also contributed to population declines, as did loss and degradation of migration and wintering habitat [1]. Between 1938 and 1962, there were no sightings of Aleutian Canada geese, and it was feared the subspecies had gone extinct [1]. In 1962, however, a remnant population was discovered on rugged, remote Buldir Island in the western Aleutians [2].
After the Aleutian Canada goose was listed as endangered, efforts to eliminate introduced foxes from former nesting islands and to reintroduce the geese were initiated [1]. Hunting closures were implemented in wintering and migration areas [3]. Also, in the early 1980s biologists discovered two additional islands that supported small numbers of breeding Aleutian Canada geese [1].
Although early releases of captive-reared geese proved largely unsuccessful due to low survival rates, populations began to increase, likely due to the hunting closures in California and Oregon [1]. Translocations of wild-caught geese, implemented when the population on Buldir Island became large enough, proved more successful and as new breeding colonies became established, numbers increased rapidly [1]. In addition, important wintering and migration habitat in California and Oregon was acquired and designated as national wildlife refuges, and local landowners were encouraged to protect and manage habitat [2].
By 1990, the population had increased to an estimated 6,300, up from 790 counted in 1975, and the species was downlisted from endangered to threatened [1]. Between 1990 and 1998, the average annual population growth rate was estimated at 20 percent, and new populations became firmly established on Agattu, Alaid and Nizki islands in the western Aleutians [2]. In 1999, the population reached more than 30,000 [3]. In 2001, with the population estimated at 37,000, the Fish and Wildlife Service declared the Aleutian Canada goose recovered, and the species was taken off the list of endangered species [1]. In 2005 the population was approximately 60,000 [4]. While the Aleutian Canada goose continues to rebound in the western Aleutians, Russian scientists are conducting an ongoing program to reestablish it in the Asian portion of the birds’ range [1].
CITATIONS
[1] U.S. Fish and Wildlife Service. 2001. Endangered and Threatened Wildlife and Plants; Final Rule to Remove the Aleutian Canada Goose From the Federal List of Endangered and Threatened Wildlife. Federal Register (66 FR 15643).
[2] U.S. Fish and Wildlife Service. 2001. An Endangered Species Success Story: Secretary Norton Announces Delisting of Aleutian Canada Goose. News Release, March 19, 2001. Available at <http://news.fws.gov/newsreleases/R9/571EA0D1-2270-400B-B350418F893BCCEC.html?CFID=1629288&CFTOKEN=63346966>
[3] U.S. Fish and Wildlife Service. 2001. Aleutian Canada Goose Road to Recovery Timeline. Available at <http://alaska.fws.gov/media/pdf/road-to-recovery.pdf>.
[4] Trost, R. E., and M. S. Drut. 2005. 2005 Pacific Flyway data book: waterfowl harvests and status, hunter participation and success, and certain hunting regulations in the Pacific Flyway and United States. U.S. Fish and Wildlife Service, Division of Migratory Bird Management, Portland, Oregon.
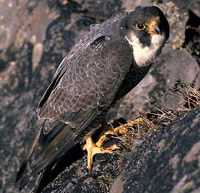
American peregrine falcon (Falco peregrinus anatum)
| Status: Delisted | Critical habitat: 8/11/1977 |
| Listed: 6/2/1970 | Recovery plan: 6/30/1991 |
Range: AL(m), AK(b), AZ(b), AR(m), CA(b), CO(b), CT(b), DE(b), DC(m), GA(b), ID(b), IL(b), IN(b), IA(b), KS(m), KY(b), LA(m), ME(b), MD(b), MA(b), MI(b), MN(b), MS(m), MO(m), MT(b), NE(b), NV(b), NH(b), NY(b), NM(b), NJ(b), NC(b), ND(m), OH(b), OK(m), OR(b), PA(b), RI(b), SC(b), SD(b), TN(b), TX(b), UT(b), VT(b), VA(b), WA(b), WV(m), WI(b), WY(b) ---
SUMMARY
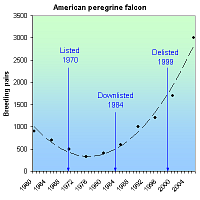
The use of DDT and other organochlorine pesticides thinned American peregrine falcon eggshells, causing reproductive failure and population declines. The banning of DDT, captive-breeding efforts and nest protections allowed falcons to increase from 324 breeding pairs in 1975 to 3,005 pairs as of 2006. The species was delisted in 1999.
RECOVERY TREND
The American peregrine falcon (Falco peregrinus anatum) breeds only in North and Central America and occurs throughout much of North America from the subarctic boreal forests of Alaska and Canada south to Mexico [1]. It is estimated that prior to the 1940s, there were approximately 3,875 nesting pairs of peregrines in North America [1]. From the 1940s through the 1960s, however, the population of the peregrine, and many other raptors, crashed as a result of the introduction of synthetic organochlorine pesticides to the environment. By 1975, there were only 324 known nesting pairs of American peregrine falcons in the U.S. [2].
Scientists investigating the peregrine's decline found unusually high concentrations of the pesticide DDT and its breakdown product DDE in peregrine falcons and other birds of prey [1]. Organochlorine pesticides were put into use following World War II. Use peaked in the late 1950s and early 1960s and continued through the early 1970s [1]. Organochlorine pesticides cause direct mortality and reduced reproduction in birds of prey because they ingest high doses of pesticides concentrated and stored in the fatty tissue of prey animals that themselves ingested contaminated food [1]. Heavily contaminated females may fail to lay eggs and organochlorines passed from the female to the egg can kill the embryo before it hatches [1]. DDE, the principal metabolite of DDT, prevents normal calcium deposition during eggshell formation, causing eggs to frequently break before hatching [1]. During the period of DDT use in North America, eggshell thinning and nesting failures were widespread in peregrine falcons, and in some areas, successful reproduction virtually ceased [1].
The degree of exposure to these pesticides varied among regions, and peregrine falcon numbers in more contaminated areas suffered greater declines [1]. The eastern population plunged from an estimated 350 active nest sites in the 1930s and 1940s to no active breeding birds from 1964 to 1975 [3]. Peregrine falcons in the Great Plains states east of the Rocky Mountains and south of U.S. and Canadian boreal forests were also essentially extirpated [1]. West of the 100th meridian, peregrine falcons were significantly reduced [1]. Local populations were greatly depressed or extirpated and by 1965 fewer than 20 pairs were known west of the U.S. Great Plains [1].
In 1970, the American peregrine was listed as endangered and efforts to recover the species began. The use of DDT was banned in Canada in 1970 and in the United States in 1972 [1]. This was the single-most significant action in the recovery of the peregrine falcon [1]. In addition, in the eastern United States, efforts were made to reestablish peregrine falcons by releasing offspring from a variety of wild stocks that were held in captivity by falconers [1]. The first experimental releases of captive-produced young occurred in 1974 and 1975 in the eastern United States [1]. These and future releases demonstrated that “hacking,” the practice of retaining and feeding young captive bred birds in partial captivity until they are able to fend for themselves, was an effective method of introducing captive-bred peregrines to the wild [1]. Since then, more than 6,000 falcons have been released in North America [1]. Approximately 3,400 peregrines were released in parts of southwest Canada, the northern Rocky Mountain States, and the Pacific Coast states [1].
In the late 1970s, Alaska became the first place American peregrine falcon population growth was documented and, by 1980, populations began to grow in other areas [1]. Not only did the number of peregrine falcons begin to increase, productivity (another important measure of population health) improved [1]. Efforts to reestablish peregrine falcons in the East and Midwest proved largely successful, leading to downlisting of the species in 1984 [1], and by 1999 peregrines were found to be nesting in all states within their historical range east of the 100th meridian, except for Rhode Island, West Virginia and Arkansas [1]. In highly urban areas, peregrine falcons showed great adaptability, and began substituting skyscrapers for natural cliff faces as nesting sites [4]. By 1998, the total known breeding population of peregrine falcons was 1,650 pairs in the United States and Canada, far exceeding the recovery goal of 456 pairs. Other recovery goals, including estimates of productivity, egg-shell thickness, and contaminants levels, had also been met, allowing the species to be delisted in 1999 [1]. Monitoring of American peregrine populations has continued under a post-delisitng monitoring plan [5]. The estimated North American population was 3,005 pairs as of 2006 [6].
ALASKA: Surveys conducted between 1966 and 1998 along the upper Yukon River demonstrated increases in the number of occupied nesting territories from a low of 11 known pairs in 1973 to 46 pairs in 1998 [1]. Similarly, along the upper Tanana River, the number of occupied nesting territories increased from two in 1975 to 33 in 1998 [1]. The recovery objective of 28 occupied nesting territories in the two study areas was first achieved in 1988, with 23 nesting territories on the Yukon River and 12 on the Tanana River [1].
PACIFIC STATES: By 1976, no American peregrine falcons were found at 14 historical nest sites in Washington [1]. Oregon had also lost most of its peregrine falcons and only one or two pairs remained on the California coast [1]. Surveys conducted from 1991 to 1998 indicated a steadily increasing number of American peregrine falcon pairs breeding in Washington, Oregon and Nevada [1]. Known pairs in Washington increased from 17 to 45 and in Oregon from 23 to 51 [1]. The number of American peregrine falcons in California increased from an estimated low of five to 10 breeding pairs in the early 1970s to a minimum of 167 occupied sites in 1998 [1]. The increase in California was concurrent with the restriction of DDT and included the release of more than 750 American peregrine falcons through 1997 [1].
ROCKY MOUNTAINS/SOUTHWEST: The Rocky Mountain/Southwest population of the American peregrine falcon has made a profound comeback since the late 1970s when surveys showed no occupied nest sites in Idaho, Montana or Wyoming and only a few pairs in Colorado, New Mexico and the Colorado Plateau, including parts of southern Utah and Arizona [1]. Surveys conducted from 1991 through 1998 indicated that the number of American peregrine falcon pairs in the Rocky Mountain/Southwest area has steadily increased [1]. In 1991, there were 367 known pairs; in 1998 the number of pairs increased to 535 [1].
EASTERN STATES: The eastern peregrine population has a unique history and complex status under the Act [1]. Peregrine falcons were extirpated in the eastern United States and southeastern Canada by the mid-1960s [1]. Releases of young captive bred peregrines have reestablished populations throughout much of their former range in the East [1]. In 1998, 193 pairs were counted in five designated eastern state recovery units [1]. The number of territorial pairs recorded in the eastern peregrine falcon recovery area increased an average of 10 percent annually between 1992 and 1998 [1]. Equally important, the productivity of these pairs during the same seven-year period averaged 1.5 young per pair, demonstrating sustained successful nesting [1].
CITATIONS
[1] U.S. Fish and Wildlife Service. 1999. Final Rule to Remove the American Peregrine Falcon from the Federal List of Endangered and Threatened Wildlife, and to Remove the Similarity of Appearance Provision for Free-Flying Peregrines in the Conterminous United States. Federal Register (64 FR 46542).
[2] Hoffman, C. 1999. The Peregrine Falcon is Back! New release, U.S. Fish and Wildlife Service, August 20, 1999.
[3] Clark, K. 2005. The Peregrine Falcon in New Jersey, Report for 2005. New Jersey Department of Environmental Protection, Division of Fish and Wildlife, Endangered and Nongame Species Program.
[4] New Jersey Division of Fish and Wildlife. Fact sheet, Peregrine Falcon Falco pereginus. New Jersey Department of Environmental Protection, Division of Fish and Wildlife, Endangered and Nongame Species Program. Website <http://www.njfishandwildlife.com/tandespp.htm> accessed February, 2006.
[5] U.S. Fish and Wildlife Service. 2003. Monitoring Plan for the American Peregrine Falcon, A Species Recovered Under the Endangered Species Act. U.S. Fish and Wildlife Service Division of Endangered Species and Migratory Birds and State Programs. Pacific Region, Portland Oregon 53pp.
[6] Green, M., T. Swem, M. Morin, R. Mesta, M. Klee, K. Hollar, R. Hazelwood, P. Delphey, R. Currie, and M. Aramal. 2006. Monitoring Results for Breeding American Peregrine Falcons (Falco peregrinus anatum), 2003. Biological Technical Publication BTP-R1005-2006. U.S. Department of Interior, Washington, D.C.
Arctic peregrine falcon (Falco peregrinus tundrius)
| Status: Delisted | Critical habitat: none | Listed: 6/2/1970 | Recovery plan: 6/30/1991 |
Range: AL(m), AK(b), AZ(m), AR(m), CA(m), CO(m), CT(m), DE(m), DC(m), FL(m), GA(m), ID(m), IL(m), IN(m), IA(m), KS(m), KY(m), LA(m), ME(m), MD(m), MA(m), MI(m), MN(m), MS(m), MO(m), MT(m), NE(m), NV(m), NH(m), NY(m), NM(m), NJ(m), NC(m), ND(m), OH(m), OK(m), OR(m), PA(m), RI(m), SC(m), SD(m), TN(m), TX(m), UT(m), VT(m), VA(m), WA(m), WV(m), WI(m), WY(m) ---
SUMMARY
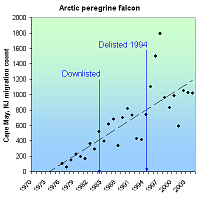
The Arctic peregrine falcon declined due to the egg shell-thinning effects of DDT and other organochlorine pesticides. Its listing as an endangered species in 1970 (along with other birds of prey) prompted the EPA to ban DDT in 1972. Counts of migratory Arctic falcons increased from 103 in 1976, to 1,017 in 2004. The species was downlisted to threatened in 1984 and delisted in 1991.
RECOVERY TREND
The Arctic peregrine falcon (Falco peregrinus tundrius) is one of three peregrine falcon subspecies [1]. It nests in tundra regions of Alaska, Canada (Yukon, Northwest Territories, Quebec, and possibly Labrador), and the ice-free perimeter of Greenland [1]. It is a long-distance migrant that winters in Latin America from Cuba and Mexico south through Central and South America [1].
Severe declines in peregrine falcon numbers began in the 1950s [1]. These declines were linked to organochlorine pesticides that were put into use following World War II, and whose use peaked in the late 1950s-early 1960s [1]. Scientists investigating the peregrine's decline found unusually high concentrations of the pesticide DDT and its breakdown product DDE in peregrine falcons and other birds of prey [2]. Organochlorine pesticides cause direct mortality and reduced reproduction in birds of prey which, being at the top of the food chain, ingest high doses of pesticides concentrated and stored in the fatty tissue of prey animals that themselves ingested contaminated food [1]. Heavily contaminated females may fail to lay eggs and organochlorines passed from the female to the egg can kill the embryo before it hatches. DDE, the principal metabolite of DDT, prevents normal calcium deposition during eggshell formation, causing eggs to frequently break before hatching [1]. Arctic peregrine numbers reached their lowest levels in the early 1970s and in some areas of North America successful reproduction virtually ceased [1]. Populations are thought to have decreased by as much as 80 percent [2].
The listing of the Arctic peregrine falcon as endangered in 1970--as well as the bald eagle, brown pelican, and American peregrine falcon shortly before--fostered a national outcry against the production and spaying of DDT. In 1972, the Environmental Protection Agency banned most used of DDT in the United States [1]. Canada had already restricted DDT use in 1970. These restrictions are the central cause of the recovery of the Arctic and American peregrine falcons (the bald eagle and brown pelican benefited greatly as well, but their recovery also involved substantial habitat protections and reintroductions).
As DDT levels declined after 1972, peregrine falcon productivity rates rose to pre-DDT levels and the population size and range began to increase. This happened most rapidly in northern areas, where pesticide exposur was lower and impacts upon populations were less severe [1]. In 1984, the U.S. Fish and Wildlife Service downlisted the Arctic peregrine falcon from endangered to threatened status [2, 6]. In 1991, the agency initiated a review determine if the species had recovered [2] and in 1994 removed it from the endangered species list [6].
Four major factors were considered in the delisting process: (1) Population size and trend, (2) reproductive performance, (3) pesticide residues in eggs, and (4) eggshell thickness [1]. Despite a lack of long-term studies using consistent methodologies, there was strong evidence of significant population increases throughout the Arctic [1]. Four areas in northern North America (one in Alaska and three in Canada’s North West Territories) for which historical survey information was available indicated the number of Arctic peregrine pairs occupying nesting territories increased since the 1960s [1]. Some areas of Alaska even exceeded the original estimates of pre-DDT-era population size [1]. In addition, in the eastern Arctic, peregrines began nesting in previously vacant nesting sites [1]. Standardized yearly migration counts at New Jersey’s Cape May, an area where Arctic peregrines concentrate during migration, also saw increasing numbers, most likely from Arctic breeding grounds especially in Greenland and eastern Canada (these counts may have also contained peregrines in the American subspecies; however, banding recoveries indicate that the majority of peregrines along the East Coast during fall migration are from the Arctic and thus represent a true increase in Arctic peregrine numbers) [1].
Productivity in all regions where data had been gathered was sufficient to support a stable or increasing population since the 1980s [1]. There had also been improvements in levels of DDE concentration in eggs. Concentrations in excess of 15-20 parts per million (wet weight basis) are associated with high rates of nesting failure. Residue in eggs in 1993 was well below this critical level [1]. Alaskan eggshells collected between 1988 to 1991 were on average only 12 percent thinner than pre-DDT thickness (17 percent or greater reduction in thickness results in population declines).
Arctic peregrine falcon numbers have continued to rise after the species' delisting. On the Sagavanirktok River in Alaska, where Arctic peregrine surveys have been conducted since the late 1950s, the number of pairs increased from five in 1958, to 23 in 1992, to 25 in 1999 [3]. Migration counts at the Cape May Hawkwatch site in New Jersey increased from 103 in 1976 to 1,024 in 2003 [4].
CITATIONS
[1] U.S. Fish and Wildlife Service. 1993. Proposal to Remove the Arctic Peregrine Falcon From the List of Endangered and Threatened Wildlife. 58 Fed. Reg 188.
[2] U.S. Fish and Wildlife Service. 1995. Peregrine falcon, (Falco peregrinus anatum, Falco peregrinus tundrius, Falco peregrinus pealei). Species account. Website <http://www.fws.gov/species/species_accounts/bio_pere.html> accessed October, 2005.
[3] Wright, J.M. and P.J. Bente. 1999. Documentation of active peregrine falcon nest sites, 1 Oct 1994- 31 March 1998. Alaska Department of Fish and Game. Annual research report. Endangered species conservation fund federal aid project SE-2-9, 10, and 11. Juneau, AK. 15 pp.
[4] Cape May Bird Observatory. 2012. Cape May Hawkwatch, Cape May, New Jersey. New Jersey Audubon Society. Website <http://www.njaudubon.org/Sightings/cmhw25.html> accessed April 2, 2012.
[5] NatureServe. 2011. NatureServe’s Central Databases. Arlington, VA. U.S.A
[6] U.S. Fish and Wildlife Service. 1994. Removal of Arctic Peregrine Falcon From the List of Endangered and Threatened Wildlife. 59 Fed. Reg. 50796.
Blue whale (Balaenoptera musculus)
| Status: Endangered | Critical habitat: none | Listed: 6/2/1970 | Recovery plan: 10/23/1998 |
Range: AK(s), CA(s), FL(o), HI(s), ME(o), MD(o), MA(o), NH(o), NY(o), NC(o), OR(m), RI(o), SC(o), WA(m) ---
SUMMARY
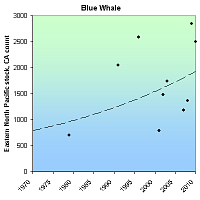
The blue whale population was reduced by as much as 99 percent due to whaling that occurred before the mid-1960s. The number of whales reported off the coast of California, the largest stock in U.S. waters, increased from 704 in 1980 to an estimated 2,497 in 2010.
RECOVERY TREND
The blue whale (Balaenoptera musculus) is the largest animal ever known to have lived on Earth [1]. Blue whales are found in all oceans worldwide and are separated into populations from the North Atlantic, North Pacific and Southern Hemisphere [1]. Each population is composed of several stocks that typically migrate between higher-latitude summer feeding grounds and lower-latitude wintering areas. The largest numbers of blue whales in U.S. waters are within the eastern North Pacific stock. Other U.S. stocks occur in waters off the coast of Hawaii and the Northeast [1].
Pre-whaling blue whale populations had about 350,000 individuals [3]. In 1868, the invention of the exploding harpoon gun made the hunting of blue whales possible and in 1900, whalers began to focus on blue whales and continued until the mid 1960s [1, 3]. During this time, it is estimated that whalers killed up to 99 percent of blue whale populations [3]. Currently, there are about 5,000-10,000 blue whales in the Southern Hemisphere and about 3,000-4,000 in the Northern Hemisphere [3]. Current threats include collisions with vessels, entanglement in fishing gear, reduced zooplankton production due to habitat degradation, and disturbance from low-frequency noise [1]. The offshore driftnet gillnet fishery is the only fishery likely to take blue whales, but few mortalities or serious injuries have been observed [2].
EASTERN NORTH PACIFIC STOCK
The Eastern North Pacific Stock feeds in waters off the coast of California from June to November and then migrates south to Mexico (sometimes going as far south as Costa Rica) in winter/spring [2]. Recently, blue whales seen off the coast of Alaska were photo-matched to photos from the Southern California area, indicating that California animals now migrate as far north as Alaska [4]. This is probably a reestablishment of a traditional migratory route [4]. The number of whales reported off the coast of California increased from 704 in 1979/80 to 2497 in 2010 [2, 11]. It is not certain if the overall increasing trend indicates a growth in the size of the stock, or just increased use of California waters [2], but in general, the stock is thought to have increased [1]. Because this is the largest stock in U.S. waters, it dominates the trend of the species in U.S. waters.
WESTERN NORTH PACIFIC STOCK
Blue whales feeding along the Aleutian Islands are probably part of a central western North Pacific stock that is thought to migrate to offshore waters north of Hawaii in winter [5]. Sightings of blue whales in Hawaiian waters are infrequent, although acoustic recordings indicate that blue whales occur there. There are no estimates of population size for this stock [5]. No blue whales were sighted during aerial surveys of Hawaiian waters conducted from 1993 to 1998 or during shipboard surveys conducted in the summer/fall of 2002 [5]. In 2004, three blue whales were seen in the western Aleutians, the first U.S. sightings of blue whales from this western North Pacific population in several decades [6]
NORTH ATLANTIC STOCK
The blue whale is an occasional visitor along the Atlantic coast of the Northeast [7]. Sightings of blue whales off Cape Cod, Mass., in summer and fall may represent the southern limit of the feeding range of the western North Atlantic stock that feeds primarily off the Canadian coast [7]. Blue whales have been sighted as far south as Florida, however, and the actual southern limit of this stock’s range is unknown [7]. Because blue whales are not frequently seen in U.S. Atlantic waters, there are insufficient data to determine the stock's population trend [7]. In 1997, the total number of photo-identified individuals for eastern Canada and New England was 352 [1].
CITATIONS
[1] NMFS. 1998. Recovery plan for the blue whale (Balaenoptera musculus). Prepared by Reeves R.R., P.J. Clapham, R.L. Brownell, Jr., and G.K. Silber for the National Marine Fisheries Service, Silver Spring, MD. 42 pp.
[2] NOAA Fisheries. 2004. Stock Assessment Report. Blue Whale (Balaenoptera musculus): Eastern North Pacific Stock. Revised 3/15/05. National Oceanic and Atmospheric Administration, Washington, D.C.
[3] American Cetacean Society. 2005 American Cetacean Society Fact Sheet: Blue Whale (Balaenoptera musculus). Website http://www.acsonline.org/factpack/bluewhl.htm (accessed on 11/30/05).
[4] NOAA. Fisheries. 2004. NOAA Scientists Sight Blue Whales in Alaska. Press Release 7/27/2004.
[5] NOAA Fisheries. 2004. Stock Assessment Report. Blue Whale (Balaenoptera musculus): Western North Pacific Stock. Revised 3/15/05. National Oceanic and Atmospheric Administration, Washington, D.C.
[6] Rankin, Barlow and Stafford. (in press) Marine Mammal Science.
[7] NOAA Fisheries. 2002. Stock Assessment Report. Blue Whale (Balaenoptera musculus): Western North Atlantic Stock. Revised Jan. 2002. National Oceanic and Atmospheric Administration, Washington, D.C
[8] NOAA Fisheries. 2007. Stock Assessment Report. Blue Whale (Balaenoptera musculus): Eastern North Pacific Stock. National Oceanic and Atmospheric Administration, Washington, D.C.
[9] NOAA Fisheries. 2008. Stock Assessment Report. Blue Whale (Balaenoptera musculus): Eastern North Pacific Stock. National Oceanic and Atmospheric Administration, Washington, D.C.
[10] NOAA Fisheries. 2009. Stock Assessment Report. Blue Whale (Balaenoptera musculus): Eastern North Pacific Stock. National Oceanic and Atmospheric Administration, Washington, D.C.
[11] NOAA Fisheries. 2010. Stock Assessment Report. Blue Whale (Balaenoptera musculus): Eastern North Pacific Stock. National Oceanic and Atmospheric Administration, Washington, D.C.
Bowhead whale (Balaena mysticetus)
| Status: Endangered | Critical habitat: none | Listed: 6/2/1970 | Recovery plan: none |
Range: AK(s) ---
SUMMARY
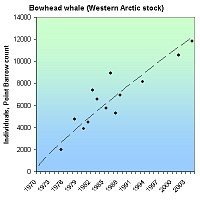
Bowhead whales in the Western Arctic were severely depleted by commercial whaling which reached a peak between 1898-1919. Whaling was banned in 1946. They are currently threatened by increased oil and gas drilling and global warming. Approximately 3,000 bowheads remained when commercial whaling ceased. Following Endangered Species Act listing in 1970, the Western Arctic population increased from 5,189 in 1978 to 11,836 in 2004. The population is likely larger today.
RECOVERY TREND
The bowhead whale (Balaena mysticetus) is found only in Arctic and sub-Arctic waters [1] and is the only baleen whale to spend its entire life near sea ice without migrating to temperate or tropical waters to calve [2].
For management purposes, five stocks of bowhead whales are recognized [3]. Four small stocks (made up of only a few tens to a few hundred individuals) occur in 1) the Sea of Okhotsk, 2) Davis Strait, 3) Hudson Bay, and 4) the offshore waters of Spitsbergen [3]. The fifth and largest stock, and the only one found within U.S. waters, is the Western Arctic stock, also know as the Bering-Chukchi-Beaufort stock or Bering Sea stock [3]. However, recent evidence suggests that the Davis Strait and Hudson Bay stocks (also known as Western Greenland and Eastern Canada stocks) form a single genetic group and may be comprised of over 1,000 whales [8].
All stocks were severely depleted during intense commercial whaling prior to the 20th century [3].
WESTERN ARCTIC STOCK
The majority of whales in the Western Arctic stock migrate annually from wintering areas in the northern Bering Sea, through the Chukchi Sea in the spring, to the Beaufort Sea where they spend much of the summer before returning again to the Bering Sea in the fall to overwinter [3].
This stock contains over 90 percent of remaining bowhead whales [4] and is making significant progress toward recovery [5].
In the Bering Sea, commercial bowhead whaling occurred primarily from 1898-1919 [3]. It is estimated that whalers killed 18,684 bowheads there, reducing the population from 10,400-23,000 to just 3,000 before whaling was banned in 1946 [1, 3]. They may have driven a distinct, non-migratory stock extinct [5].
Migrating whale counts off Point Barrow indicate the population grew at an annual rate of 3.4% between 1978 and 2001, increasing from 5,189 to 10,545 whales [7]. These counts exclude a much smaller, unknown number of non-migrating whales. The most recent estimate, using a different method, shows a 2004 population of 11,836 whales.
Native subsistence hunts have been permitted since 1977, with annual take ranging from 14-72 whales [3]. The recent harvest rate has been 40 whales per year with another ten or more struck and lost.
The bowhead whale is currently threatened by Western Arctic oil and gas development which brings increased ship traffic, water pollution, and noise pollution from offshore drilling rigs and seismic surveys [3]. Compared to the Gulf of Mexico, the Western Actic has not had a large amount of offshore oil and gas drilling. However, the Bush and Obama administrations issued regional policy and specific drillling decisions which if effected, will substantially increase oil and gas operations in the future.
Bowheads are also threatened by loss of sea ice and other ecosystem changes caused by global warming.
CITATIONS
[1] American Cetacean Society. 2004. Bowhead Whale (Balaena mysticetus) Fact Sheet. Available at <http://www.acsonline.org/factpack/bowhead.htm> Revised 3/2004.
[2] Caroll, G. 1994. Bowhead Whale. Alaska Department of Fish and Game. Website <http://www.adfg.state.ak.us/pubs/notebook/marine/bowhead.php> accessed March, 2006.
[3] NOAA Fisheries. 2003. Stock Assessment Report. Bowhead Whale (Balaena mysticetus): Western Arctic stock. National Oceanic and Atmospheric Administration, Washington, DC.
[4] National Audubon Society. 1992. Bowhead Whales in Beringia Natural History Notebook Series. Anchorage, AK. Available at <http://www.nps.gov/bela/html/bowhead.htm>.
[5] Shelden, K. E. W. and D. J. Rugh, 1995. The Bowhead Whale, Balaena mysticetus: Its Historic and Current Status. Marine Fisheries Review 57(3-4):1-20.
[7] Alaska Fisheries Science Center. 2010. Bowhead Whale (Balaena mysticetus): Western Arctic Stock. In Alaska Marine Mammal Stock Assessments, 2010. NOAA Technical Memorandum NMFS-AFSC-223. Available at http://www.nmfs.noaa.gov/pr/pdfs/sars/ak2010.pdf
[8] Alaska Fisheries Science Center. 2011. Bowhead Whale (Balaena mysticetus): Western Arctic Stock (July 2011 draft). In Alaska Marine Mammal Stock Assessments, 2011 (July 2011 draft). Available at http://www.nmfs.noaa.gov/pr/pdfs/sars/ak2011_draft.pdf
Fin whale (Balaenoptera physalus)
| Status: Endangered | Critical habitat: none | Listed: 6/2/1970 | Recovery plan: 7/30/2010 |
Range: AL(o), AK(s), CA(s), CT(s), DE(s), FL(s), GA(s), HI(s), LA(o), ME(s), MD(s), MA(s), MS(o), NH(s), NY(s), NJ(s), NC(s), OR(s), PA(s), RI(s), SC(s), TX(o), VA(s), WA(s) ---
SUMMARY
Fin whales were hunted in all the world's oceans for the first three-quarters of the 20th century, causing population decline. Ongoing threats include illegal and legal whaling, vessel collisions, fishing gear entanglement, reduced prey and noise. Total population size is unknown, but both the North Atlantic and North Pacific populations increased between 1995 and 2009.
RECOVERY TREND
Fin whale (Balaenoptera physalus) populations in the North Atlantic, North Pacific and southern oceans mix rarely, if at all. For management purposes, the North Pacific is divided into three stocks: 1) the California/Oregon/Washington stock, 2) the Hawaii stock and 3) the Alaska stock [2]. A western North Atlantic stock inhabits U.S. waters along northeastern coasts [3]. Most groups are thought to migrate seasonally, in some cases over large distances [1]. They feed at high latitudes in summer and move to low latitudes in winter. Some groups move over shorter distances and may be resident to areas with a year-round supply of adequate prey.
Fin whales were hunted, often intensively, in all the world's oceans for the first three-quarters of the 20th century [1]. From 1947 to 1987, approximately 46,000 fin whales were taken from the North Pacific [2]. Commercial whaling did not end until 1976 in the North Pacific and 1987 in the North Atlantic. The current status of fin whale populations relative to pre-whaling levels is uncertain.
In the North Pacific, pre-whaling populations were estimated to be between 42,000 and 45,000 [2]. By 1973, the North Pacific population is thought to have been reduced to 13,620-18,680 — less than 38 percent of historic carrying capacity [2].
California/Oregon/Washington Stock
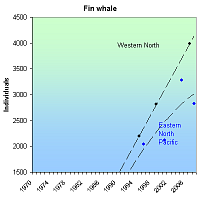
The California/Oregon/Washington stock of the North Pacific is thought to be increasing [5]. Fin whale acoustic signals are detected year-round off Northern California, Oregon and Washington, with a concentration of vocal activity between September and February [2]. Fin whales increased in abundance along the California coast between 1979 and 1996, and based on ship surveys in 2001, they continued to increase. Populations appeared to be increasing monotonically from 1991 to 2001 [5]. In 2001, 3,279 (CV= 0.31) were estimated in California, Oregon and Washington coastal waters [2]. The 2008 population was estimated at 2,825 whales [9].
Alaskan Stock
Since 1999, information on abundance of fin whales in Alaskan waters has improved and although the full range has not yet been surveyed, a rough estimate of the size of the population west of the Kenai Peninsula is 5,703 [6]. Surveys conducted in 1999 and 2000 in the central-eastern Bering Sea and southeastern Bering Sea provided provisional estimates of 3,368 (CV = 0.29) and 683 (CV = 0.32), respectively [6]. One aggregation of fin whales spotted in 1999 involved more than 100 animals [6]. Because historical abundance information is lacking, population trends are difficult to determine [6].
Hawaiian Stock
Fin whales are rare in Hawaiian waters and the stock is thought to be quite small [7]. Over the course of 12 aerial surveys conducted within about 25 nautical miles of the main Hawaiian Islands in 1993-98, only one fin whale was sighted [7]. More recent acoustic data suggest that fin whales migrate into Hawaiian waters mainly in fall and winter [7]. In 2002, a ship survey of the entire Hawaiian Islands resulted in an abundance estimate of 174 (CV=0.72) fin whales [7].
Western North Atlantic Population
Western North Atlantic fin whales off the eastern U.S. coast north to Nova Scotia and the southeastern coast of Newfoundland are considered a single stock [3]. New England waters represent a major feeding ground, and calving is thought to take place along mid-Atlantic U.S. latitudes from October to January. The locations used for calving, mating and wintering for most of the population remains unknown. It is likely that fin whales occurring in the U.S. Atlantic undergo migrations into Canadian waters, open-ocean areas, and perhaps even subtropical or tropical regions. An abundance of 2,200 (CV=0.24) fin whales was estimated from a 1995 line-transect sighting survey that covered waters from Virginia to the mouth of the Gulf of St. Lawrence. A 1999 estimate of 2,814 (CV=0.21) fin whales, currently considered the best estimate for the western North Atlantic stock, was derived from a line-transect sighting covering waters from Georges Bank to the mouth of the Gulf of St. Lawrence [3]. The best estimate of population for this stock in 2007 is 3,985 whales [8]. Although there is little data on population trends, the minimum population estimate reported in NOAA Fisheries Stock Assessment Reports has steadily increased since 1992.
The main direct threat to fin whales today is the possibility of illegal whaling or a resumption of legal whaling [1]. In 2006, Japan announced that it would expand hunts to include fin whales [4]. It expected to harvest 10 fin whales from Antarctic waters [4]. Collisions with vessels, entanglement in fishing gear, reduced prey abundance due to overfishing and habitat degradation, as well as disturbance from low frequency noise, are also potential threats [1]. The offshore drift gillnet fishery is the main fishery likely to take fin whales [2].
CITATIONS
[1] National Marine Fisheries Service. 1998. Draft Recovery Plan for the Fin Whale (Balaenoptera physalus) and Sei Whale (Balaenoptera Borealis). Silver Spring, MD.
[2] NOAA Fisheries. 2005. Stock Assessment Report. North Atlantic Right Whale (Eubalaena glacialis): Western Stock revised Dec., 2004. National Oceanic and Atmospheric Administration, Washington, D.C.
[3] NOAA Fisheries. 2004. Stock Assessment Report. Fin Whale (Balaenoptera physalus): Western North Atlantic stock. Revised Dec. 2004. National Oceanic and Atmospheric Administration, Washington, D.C.
[4] Hans Greimel, Associated Press. 2005. Japan To Double Usual Whale Kill in New Antarctic Hunt, Expanded To Include Fin Whales. Nov. 9, 2005.
[5] Barlow, J. 2003. Preliminary Estimates of the Abundance of Cetaceans along the U.S. West Coast: 1991-2001 Southwest Fisheries Science Center Administrative Report LJ-03-03. Available at <http://swfsc.nmfs.noaa.gov/prd/PROGRAMS/CMMP/default.htm>.
[6] NOAA Fisheries. 2004. Stock Assessment Report. Fin Whale (Balaenoptera physalus): Northeast Pacific stock. Revised 10/21/2004.
[7] NOAA Fisheries. 2005. Draft Stock Assessment Report. Fin Whale (Balaenoptera physalus): Hawaiian stock. Revised 3/15/2005.
[8] NOAA Fisheries. 2010. Stock Assessment Report. Fin Whale (Balaenoptera physalus): Western North Atlantic Stock. Revised 11/2010.
[9] NOAA Fisheries. 2011. 2010 Stock Assessment Report. Fin Whale (Balaenoptera physalus): California/Oregon/Washington stock. Revised 1/15/2011.
Gray whale (Eastern North Pacific DPS) (Eschrichtius robustus pop. 3)
| Status: Delisted | Critical habitat: none | Listed: 6/2/1970 | Recovery plan: none |
Range: AK(b), CA(b), OR(b), WA(b) ---
SUMMARY
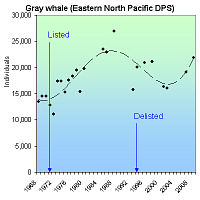
Gray whales declined precipitously due to whaling, becoming extinct in the Atlantic, endangered in the Eastern North Pacific and extremely endangered in the Western North Pacific. They are threatened by oil and gas drilling and coastal development. In 1968, there were 13,426 Eastern North Pacific gray whales. The species was was listed as endangered in 1970 and removed from the list in 1994 when the population reached 20,103 whales. The 2009 population was estimated to be 21,911.
RECOVERY TREND
The Eastern North Pacific gray whale (Eschrichtius robustus) migrates along the West Coast from summer feeding grounds in the Bering and Chukchi seas to nearly landlocked lagoons and bays along the west coast of Baja California where calves are born from early January to mid-February [2].
It historic population size has been estimated at about 19,500 [1] based on log books and historical accounts [4]. However, recent genetic analysis indicates a historic population on the order of 96,000 whales (76,000–118,000) [3].
Early indigenous whaling impacts were likely substantial to this near-shore species, especially to resident populations [4], but have not been quantified. The added pressure of commercial whaling however, drove the species to near extinction in the 19th and 20th centuries. Between 1846 and 1900, commercial whalers killed nearly 9,000 gray whales and indigenous hunters about 6,000 [1]. After 1900, the two groups killed another 11,500 whales, for a total of 27,000 between 1846 and 1946.
Commercial whaling was prohibited in 1946 and indigenous whaling was greatly reduced. At the time of its listing as an endangered species in 1970, the gray whale was extinct in the Atlantic, at low levels in the Eastern North Pacific, and at extremely low levels in the Western North Pacific [2].
Between 1968 and 1988, the Eastern North Pacific gray whale grew from 13,426 whales to a post-exploitation peak of 26,916 [1]. It declined to 20,103 whales by 1994 when it was delisted, remained stable for a few years, and then declined again to about 16,000 whales in 2001 and 2002. These declines were preceded by an unprecedented number of whale strandings in 1999 (273) and 2000 (355), greatly exceeding the previous average (38). The stranding were also unusual in being dominated by adults and subadults (>60%) rather than calves. The whales were visibly emaciated, possibly due to poor feeding conditions (i.e. extensive ice cover) in their wintering grounds.
Recent population estimate are in dispute. The 2010 reanalysis cited for all population numbers in this account [1], indicates the stock grew to 21,911 whales in 2009.
The Western North Pacific gray whale remains listed as an endangered foreign species. It has not recovered since listing and today is comprised of less than 100 whales which are highly endangered by oil and gas drilling proposals in Asia and Russia.
CITATIONS
[1] Punt, A.E. and P.R. Wade. 2010. Population Status of the Eastern North Pacific Stock of Gray Whales in 2009. U.S. Dep. Commer., NOAA Tech. Memo. NMFS-AFSC-207, 43 p.
[2] National Marine Fisheries Service. 1994 Final Rule to Remove the Eastern North Pacific Population of the Gray Whale From the List of Endangered Wildlife. 59 Fed. Reg. 31094.
[3] Alter, S.E., E. Rynes and S.R. Palumbi. 2007. DNA evidence for historical population size and past ecological impacts of gray whales. Proceedings of the National Academy of Sciences 104:15162–15167.
[4] Pyenson, N.D. and D.R. Lindberg. 2011. What Happened to Gray Whales during the Pleistocene? The Ecological Impact of Sea-Level Change on Benthic Feeding Areas in the North Pacific Ocean. PLoS ONE 6(7): e21295. doi:10.1371/journal.pone.0021295.
Humpback whale (Megaptera novaeangliae)
| Status: Endangered | Critical habitat: none | Listed: 6/2/1970 | Recovery plan: 11/15/1991 |
Range: AL(o), AK(s), CA(s), CT(s), DE(s), FL(s), GA(s), HI(s), LA(o), ME(s), MD(s), MA(s), MS(o), NH(s), NY(s), NJ(s), NC(s), OR(s), RI(s), SC(s), TX(o), VA(s), WA(s) ---
SUMMARY
Humpback whale populations were greatly depleted by commercial whaling by the early 1900s. In 1966, the entire North Pacific humpback population was thought to number only around 1,200 animals. As of 2010, the total population of North Pacific humpback was estimated at 21,808.
RECOVERY TREND
Humpback whales (Megaptera novaeangliae) occur in all oceans of the world, generally inhabiting waters over continental shelves, along continental edges and around some oceanic islands [1]. They winter in warm waters in a few specific locations and mate and give birth on wintering grounds where little feeding is thought to take place [1]. For the summer season, they migrate to high-latitude areas where they tend to stay relatively close to shore (although some groups inhabit deeper water) and spend the majority of their time feeding [1].
Humpback whale populations were greatly depleted by commercial whaling [1]. Prior to whaling, humpback whale numbers are thought to have exceeded 125,000 [1]. American whalers alone killed between 14,164 and 18,212 humpback whales between 1805 and 1909 [1]. Humpback whales first received protection in the North Atlantic in 1955 when the International Whaling Commission placed a prohibition on non-subsistence whaling by member nations [1]. Protection was extended to the North Pacific and southern hemisphere populations following the 1965 hunting season [1]. Although hunting has largely been stopped (some exceptions exist that allow the take of a limited number of whales), and populations appear to be increasing, human impacts such as vessel collisions and entanglements are factors that may be slowing the recovery of the humpback whale population [3].
The total level of human-caused mortality and serious injury is unknown, but data indicate that it is significant [3]. Humpback whales are also vulnerable to marine pollution [2]. The increasing levels of anthropogenic noise in the world’s oceans, such as that produced by certain types of sonar, may also be problematic for whales, particularly for baleen whales that communicate using low-frequency sound [4].
GULF OF MAINE, WESTERN NORTH ATLANTIC STOCK
There are likely six stocks within the western North Atlantic humpback population [3]. A feeding aggregation in the Gulf of Maine (considered a single stock) is the only one U.S. waters [3]. Within New England waters, humpbacks are present in spring, summer and autumn [3]. They spend much of their time feeding and their distribution in this region has been largely correlated to prey species and abundance [3]. In winter, humpbacks from the different western Northern Atlantic feeding areas mate and calve primarily in the West Indies, where spatial and genetic mixing among subpopulations occurs [3]. From late December to early April most of the population is found at Silver and Navidad Banks at the end of the Bahamian archipelago, and along the coast of the Dominican Republic [1]. They are also found at much lower densities throughout the remainder of the Antillean arc, from Puerto Rico to the coast of Venezuela [3]. The only U.S.-controlled portions of the breeding range include waters along the Northwest coast of Puerto Rico and the U.S. Virgin Islands [1]. Not all of the stock migrates to the West Indies every winter, however, and significant numbers of animals are found in mid- and high-latitude regions during the winter months [3]. There have recently been a number of wintertime humpback sightings in coastal waters of the southeastern U.S. [3].
North Atlantic humpback numbers are thought to be slowly increasing. An average increase of 1 percent (SE=0.005) was estimated for the period 1979 to 1993 [3]. The best estimate of the number of North Atlantic humpbacks in 1992 and 1993 was 11,570 (CV=0.069) [3]. Data suggest that the Gulf of Maine humpback whale stock is also steadily increasing in size at a rate consistent with the larger population [3]. The Gulf of Maine minimum population was estimated to be 501 in 1992 and 647 in 1999 [3]. Both of these estimates are likely low due to sampling technique [3]. The best estimate of the actual number of animals is thought to be 902 [3].
NORTH PACIFIC
Historic summering range for the North Pacific humpback whales encompassed coastal and inland waters around the Pacific rim from Point Conception, Calif. north to the Gulf of Alaska and the Bering Sea, and west along the Aleutian Islands, Kamchatka Peninsula and into the Sea of Okhotsk [1]. Rough estimates of the pre-whaling population speculate that there were around 15,000 humpbacks in the North Pacific [1]. In 1966, the entire North Pacific humpback population was thought to number only around 1,200 animals [4]. This estimate increased to between 6,000 and 8,000 by 1992 [4]. Although these estimates are uncertain and are based on different methods, the 6 percent to 7 percent growth rate implied is consistent with the observed growth rate of the better-studied eastern North Pacific subpopulation [4].
Although the International Whaling Commission only considered North Pacific humpbacks to be one stock, there is now good evidence for multiple stocks in the North Pacific [4]. There are at least three relatively separate populations that migrate between their respective summer/fall feeding areas and winter/spring calving and mating areas; the eastern North Pacific stock, the central North Pacific stock and the western North Pacific stock [4]. These divisions are a simplification, however, and are not perfect. In general, interchange occurs (at low levels) between breeding areas, although fidelity is extremely high among the feeding areas [4].
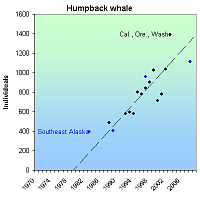
The eastern North Pacific stock spend much of their lives within U.S. waters [1]. They winter in coastal Central America and Mexico, migate along the U.S. West Coast, and summer in British Columbia [4]. Mark-recapture population estimates increased steadily from 1988/90 to 1997/98 at about 8 percent per year [4]. Surveys of humpback whale abundance in feeding areas in California, Oregon and Washington conducted from 1991 to 2002 show a steady upward trend with the exception of a large decline in 2000 [5]. The 2002 to 2003 population estimate (1,391, CV=0.22) was higher than any previous estimate and may indicate that the lower numbers in 1999 to 2001 exaggerated any real decline that might have occurred [5]. It could also indicate that a real decline was followed by an influx of new whales from another area [4]. This latter view was substantiated by a greater fraction of new whales seen for the first time in 2003 [4].
The central North Pacific stock, in general, winters around the Hawaiian Islands (some go to Mexico) and migrates to northern British Columbia/Southeast Alaska and Prince William Sound west to Kodiak [6]. Three feeding areas for the Central North Pacific stock have been studied using photo-identification techniques; these include southeastern Alaska, Prince William Sound and Kodiak Island [6]. There has been some exchange of individual whales between these locations, although the aggregation in southeastern Alaska seems to remain relatively isolated from other groups [6]. The current total estimated abundance for this stock is 4,005 individuals [7]. The abundance of the Prince William Sound feeding aggregation is thought to be fewer than 200 whales [6]. In the Kodiak region, 127 individual whales were identified between 1991 and 1994 and abundance was estimated to be 651 (95 percent CI: 356-1,523) [6]. The number of animals in the Southeast Alaska aggregation is thought to have increased [6]. The 2000 estimate of 961 is substantially higher than estimates from the 1980s, which put numbers in the high 300s [6]. In a 2004 report, an annual population rate of increase was calculated to be 10 percent [6]. Another study, based on aerial surveys conducted across the main Hawaiian Islands, and designed specifically to estimate trends in the Central Pacific Stock, found an annual increase of 7 percent from 1993 to 2000 [8]. In 2006, the Southeast Alaska population reached 1,115 [10].
The western North Pacific stock is the least studied of the Northern Pacific populations [9]. This aggregation winters off Japan and probably migrates to waters west of the Kodiak Archipelago (the Bering Sea and Aleutian Islands) in summer/fall [9]. Recent surveys in the central-eastern and southeastern Bering Sea in 1999 and 2000 resulted in humpback whale sightings suggesting that the Bering Sea is an important feeding area [9]. New information indicates that humpback whales from the western and Central North Pacific stocks mix on summer feeding grounds in the central Gulf of Alaska and perhaps the Bering Sea [9]. A major research effort (the SPLASH project) was initiated in 2004 in order to better delineate stock structure of humpback whales in the North Pacific [9]. There are no reliable estimates for the abundance of humpback whales in the western Pacific stock because surveys of the known feeding areas are incomplete, and not all feeding areas are known [9].
The 2010 estimate of abundance of humpback whales in the entire North Pacific Basin based on a Chapman-Petersen estimate is 21,808 (CV=0.04) [10].
CITATIONS
[1] National Marine Fisheries Service. 1991. Recovery Plan for the Humpback Whale (Megaptera novaeangliae). Prepared by the Humpback Whale Recovery Team for the Silver Spring, Maryland. 105pp.
[2] NatureServe. 2005. NatureServe’s Central Databases. Arlington, VA. U.S.A.
[3] NOAA Fisheries. 2005. Stock Assessment Report. Humpback Whale (Megaptera novaeangliae): Gulf of Maine Stock, revised Dec. 2004. National Oceanic and Atmospheric Administration, Washington, D.C.
[4] NOAA Fisheries. 2005. Stock Assessment Report. Humpback Whale (Megaptera novaeangliae): Eastern North Pacific Stock, revised May 15, 2005. National Oceanic and Atmospheric Administration, Washington, D.C.
[5] Calambokidis J., T. Chandler, L. Schlender, G.H. Steiger, and A. Douglas. 1995-2000. Final reports to Monterey Bay, Channel Islands, and Olympic Coast National Marine Sanctuaries, Southwest Fisheries Science Center, and University of California at Santa Cruz. Cascadia Research, 218 1/2; W Fourth Ave., Olympia, WA 9850. Accessed at http://www.cascadiaresearch.org/abstracts/abstract.htm.
[6] NOAA Fisheries. 2005. Stock Assessment Report. Humpback Whale (Megaptera novaeangliae): Central North Pacific Stock, revised Feb 12, 2005. National Oceanic and Atmospheric Administration, Washington, D.C.
[7] NOAA Fisheries, Office of Protected Resources. Cetaceans: Whales, Dolphins, and Porpoises. Humpback Whale. Website <http://www.nmfs.noaa.gov/pr/species/mammals/cetaceans/humpback_whale.doc> accessed January, 2005.
[8] Mobley J. Jr., S. Spitz, and R. Grotefendt. 2001. Abundance of Humpback Whales in Hawaiian Waters: Results of 1993-2000 aerial surveys. Hawaiian Islands Humpback Whale National Marine Sanctuary Office of National Marine Sanctuaries. National Oceanic and Atmospheric Administration U.S. Dept of Commerce. Available at <http://hawaiihumpbackwhale.noaa.gov/research/HIHWNMS_Research_Mobley.pdf>.
[9] NOAA Fisheries. 2005. Stock Assessment Report. Humpback Whale (Megaptera novaeangliae): Western North Pacific Stock, revised Feb 5, 2005. National Oceanic and Atmospheric Administration, Washington, D.C.
[10] NOAA Fisheries. 2010. Draft Stock Assessment Report. Humpback Whale (Megaptera novaeangliae): Central North Pacific Stock, revised Jan 28, 2010. National Oceanic and Atmospheric Administration, Washington, D.C.
Steller sea-lion (eastern DPS) (Eumetopias jubatus (eastern DPS))
| Status: Endangered | Critical habitat: 8/27/1993 | Listed: 4/5/1990 | Recovery plan: 2/29/2008 |
Range: AK, CA, OR, WA
SUMMARY
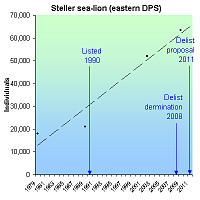
The Steller sea-lion (eastern DPS) declined due to exploitation, predator control and prey base declines. These threats substantially declined following its listing as an endangered species in 1990 and designation of critical habitat in 1993. Its population increased about 21,000 animals in 1989 to 63,488 in 2009. In 2012 it was proposed for delisting due to high total numbers, but California trends remain weak, and the southernmost portion of its range has not been reoccupied.
RECOVERY TREND
The Steller sea lion (Eumetopias jubatus) is the largest of the eared seal family and occurs across the North Pacific Ocean rim from Japan to California [1]. The entire species was listed as threatened under an emergency rule in 1990 following an 82-percent decrease from 1960 population levels [2]. The factors behind population decline were a reduction in prey biomass and quality due to commercial fishing and oceanographic variability, and killer whale predation [1].
Due to differences in genetics and population trends, the Steller sea lion was separated into eastern and western distinct population segments (DPS) in 1997 for purposes of management by the National Marine Fisheries Service [1]. The eastern DPS of the Steller sea lion is considered to occur east of 144° W. longitude and extends east to British Columbia and south to California [1].
The eastern DPS of Steller sea lion was subject to substantial commercial exploitation and both sanctioned and unsanctioned predator control prior to the enactment of protective legislation in the 1970s in the U.S. and Canada [3]. Endangered Species Act protection in 1990 helped the sea lion move towards recovery, and in 2008 the federal recovery team determined that the eastern DPS appeared to have recovered from factors causing its decline [1]. In April 2012, the Fisheries Service published declaring the eastern Steller sea-lion recovered and removing it from the endangered species list [5].
Within the eastern DPS, 13 rookeries and about 85 major haulout sites are known from Cape Fairweather (58.8°N, 137.9°W ) to Año Nuevo Island (37.1°N, 122.3°W). Populations associated with 12 of these rookeries have either increased or stabilized at relatively high levels in recent years [1]. The population trend of the eastern DPS has been monitored by geographic regions, including southeast Alaska, British Columbia, Oregon and California. Because Steller sea lions range widely, estimates for a geographic area represent the number of animals supported by rookeries and not the exact numbers of animals present in the area. The populations in southeast Alaska, British Columbia and Oregon have more than doubled since the 1970s [1]. In southeast Alaska, counts of non-pups (adults and juveniles) increased from 5,585 in 1979 to 10,527 in 2005. In southeast Alaska, pup counts increased from 5,510 in 2005 to 7,443 in 2009 [4]. In British Columbia, non-pup counts increased from 4,617 in 1971 to 12,121 in 2002. In Oregon, non-pup counts increased from 1,461 in 1977 to 4,169 in 2002.
Overall, the DPS is estimated to have increased from 18,040 individuals in 1979 to 63,488 in 2009 [5].
Recovery in California has lagged behind the rest of the DPS [5]. California has experienced markedly different population trends at various rookeries and haulouts, with most sites at population levels substantially less than those of the early 1900s, yet apparent population stability in the last decade [1]. The sea-lion has not recolonized the southernmost portion of its range at San Miguel Island rookery. Factors impeding full recovery in California likely include a climate induced northward range shift, competition for space on land at haulouts and rookery sites, and possibly competition for prey with other more temperately adapted pinniped species such as California sea lions and northern elephant seals [5].
Factors that may continue to affect the eastern DPS include predation, reduced prey biomass and quality, toxic substances, global climate change and ocean acidification.
CITATIONS
[1] National Marine Fisheries Service. 2008. Revised Recovery Plan for the Steller sea lion (Eumetopias jubatus) Eastern and Western Distinct Population Segments. National Marine Fisheries Service, Silver Spring, MD. 325 pages.
[2] National Marine Fisheries Service. 1990. Listing of Steller Sea-lions as Threatened under the Endangered Species Act with Protective Regulations. April 5, 1990. 55 FR 12645.
[3]Pitcher, K. W., P. F. Olesiuk, R. F. Brown, M. S. Lowry, S. J. Jeffries, J. L. Sease, W. L. Perryman, C. E. Stinchcomb, and L. F. Lowry. 2006. Status and trends in abundance and distribution of the eastern population of Steller sea lion (Eumetopias jubatus). Fisheries Bulletin.
[4] National Marine Fisheries Service. 2010. 90-Day Finding on Petitions To Delist the Eastern Distinct Population Segment of the Steller Sea Lion. Dec. 13, 2010. 75 FR 77602.
[5] National Marine Fisheries Service. 2012. Proposed Delisting of Eastern DPS of Steller Sea Lions. April 18, 2012. 77 FR 23209.
Steller sea-lion (western DPS) (Eumetopias jubatus (western DPS))
| Status: Endangered | Critical habitat: 8/27/1993 | Listed: 4/5/1990 | Recovery plan: 2/29/2008 |
Range: AK(b) ---
SUMMARY
The Steller sea lion is threatened by loss of its prey base to unsustainable commercial fisheries, predation, toxins and global climate change. It declined in every count from 1970-2000 but increased in 2002-2004 as fishing restrictions took effect. As of 2008 the Alaska population was estimated at 45,000, which is 15,000 more animals than at the time of listing in 1990.
RECOVERY TREND
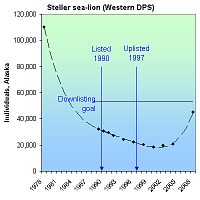
The western population of the Steller sea lion (Eumetopias jubatus) occurs in Alaska and Russia where it is threatened by unsustainable commercial fisheries that compete for its food source [1]. It was listed as a threatened species in 1990 under an emergency rule [3], a recovery plan was prepared in 1992 [1], critical habitat was designated in 1993 [4], and it was uplisted to "endangered" in 1997 due to continued declines [5].
The western distinct population segment of Steller sea lions decreased from 220,000 to 265,000 animals in the late 1970s to fewer than 50,000 in 2000 [7]. In Alaska, its population declined steadily from 32,000 animals in 1989 to 18,325 in 2000, and in every count from 1970s and 2000 [2, 6]. Due to conservationist lawsuits, however, a series of extensive fishing restrictions were put in place between 1998 and 2000 to protect the sea lion's designated critical habitat [2]. The population subsequently increased for the first time since the 1970s to 19,340 in 2002, 20,600 in 2004, and 45,000 in 2008 [2, 6].
At the time of listing in 1990, there were 30,525 animals in the Alaska population. As of 2008, the total population size of western Steller sea lions in Alaska was estimated to be 45,000 animals. As of 2005, the Russian Steller sea lion population (part of the western DPS) was about 16,000 [7].
CITATIONS
[1] National Marine Fisheries Service. 1992. Recovery Plan for the Steller Sea Lion (Eumetopias jubatus). Silver Springs, MD.
[2] National Marine Fisheries Service. 2003. Supplement to the Endangered Species Act Section 7 Consultation Biological Opinion and Incidental Take Statement of October 2001 (concerning effect of Gulf of Alaska, Bering Sea/Aleutian Island fishing on Steller sea lions). Seattle, WA, June 19, 2003.
[3] National Marine Fisheries Service. 1990. Emergency Listing of the Steller Sea Lion. Federal Register, April 10, 1990 (55 FR 13488).
[4] National Marine Fisheries Service. 1993. Designated Critical Habitat; Steller Sea Lion. Federal Register, August 27, 1993 (58 FR 45269).
[5] National Marine Fisheries Service. 1997. Change in listing status of Steller sea lions under the Endangered Species Act. Federal Register, May 5, 1997 (62 FR 24345).
[6] Fritz, L. 2004. Western Steller Sea Lion Aerial Survey Results, June 2004. National Marine Fisheries Service, Seattle, WA, September 22, 2004. Availabe at <http://nmml.afsc.noaa.gov/AlaskaEcosystems/sslhome/survey2004.htm>.
[7] National Marine Fisheries Service. 2008. Revised Recovery Plan for the Steller sea lion (Eumetopias jubatus) Eastern and Western Distinct Population Segments. National Marine Fisheries Service, Silver Spring, MD. 325 pages.
