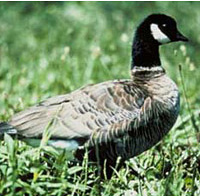
Aleutian Canada goose (Branta hutchinsii leucopareia)
| Status: Delisted | Critical habitat: none |
| Listed: 3/11/1967 | Recovery plan: 9/30/1991 |
Range: AK(b), CA(s), OR(s), WA(m) ---
SUMMARY
In the 1960s the Aleutian Canada goose was feared extinct due to predation by non-native foxes introduced to its nesting island, and to a less degree, by excessive hunting and loss of winter and migration habitat. It was rediscovered in 1962. In 1967 it was listed as an endangered species and grew from ~790 birds in 1975 to ~60,000 in 2005. It was declared recovered and removed from the endangered list in 2001, seven years earlier than projected by its recovery plan.
RECOVERY TREND
The Aleutian Canada goose was an abundant subspecies of Canada goose that nested in the northern Kuril and Commander Islands, in the Aleutian Archipelago, and on islands south of the Alaska Peninsula east to near Kodiak Island [1]. The birds wintered in Japan and in the coastal western United States to Mexico [1].
The fur industry began introducing Arctic and red foxes to the goose's nesting islands 1750, reaching a peak between 1915 and 1939 [2]. Foxes were released on 190 islands within the Aleutian Canada goose’s breeding range in Alaska [1]. They decimated the species by predating heavily on eggs, goslings and flightless molting geese.
Hunting, especially on the migration and wintering range in California, also contributed to population declines, as did loss and degradation of migration and wintering habitat [1]. Between 1938 and 1962, there were no sightings of Aleutian Canada geese, and it was feared the subspecies had gone extinct [1]. In 1962, however, a remnant population was discovered on rugged, remote Buldir Island in the western Aleutians [2].
After the Aleutian Canada goose was listed as endangered, efforts to eliminate introduced foxes from former nesting islands and to reintroduce the geese were initiated [1]. Hunting closures were implemented in wintering and migration areas [3]. Also, in the early 1980s biologists discovered two additional islands that supported small numbers of breeding Aleutian Canada geese [1].
Although early releases of captive-reared geese proved largely unsuccessful due to low survival rates, populations began to increase, likely due to the hunting closures in California and Oregon [1]. Translocations of wild-caught geese, implemented when the population on Buldir Island became large enough, proved more successful and as new breeding colonies became established, numbers increased rapidly [1]. In addition, important wintering and migration habitat in California and Oregon was acquired and designated as national wildlife refuges, and local landowners were encouraged to protect and manage habitat [2].
By 1990, the population had increased to an estimated 6,300, up from 790 counted in 1975, and the species was downlisted from endangered to threatened [1]. Between 1990 and 1998, the average annual population growth rate was estimated at 20 percent, and new populations became firmly established on Agattu, Alaid and Nizki islands in the western Aleutians [2]. In 1999, the population reached more than 30,000 [3]. In 2001, with the population estimated at 37,000, the Fish and Wildlife Service declared the Aleutian Canada goose recovered, and the species was taken off the list of endangered species [1]. In 2005 the population was approximately 60,000 [4]. While the Aleutian Canada goose continues to rebound in the western Aleutians, Russian scientists are conducting an ongoing program to reestablish it in the Asian portion of the birds’ range [1].
CITATIONS
[1] U.S. Fish and Wildlife Service. 2001. Endangered and Threatened Wildlife and Plants; Final Rule to Remove the Aleutian Canada Goose From the Federal List of Endangered and Threatened Wildlife. Federal Register (66 FR 15643).
[2] U.S. Fish and Wildlife Service. 2001. An Endangered Species Success Story: Secretary Norton Announces Delisting of Aleutian Canada Goose. News Release, March 19, 2001. Available at <http://news.fws.gov/newsreleases/R9/571EA0D1-2270-400B-B350418F893BCCEC.html?CFID=1629288&CFTOKEN=63346966>
[3] U.S. Fish and Wildlife Service. 2001. Aleutian Canada Goose Road to Recovery Timeline. Available at <http://alaska.fws.gov/media/pdf/road-to-recovery.pdf>.
[4] Trost, R. E., and M. S. Drut. 2005. 2005 Pacific Flyway data book: waterfowl harvests and status, hunter participation and success, and certain hunting regulations in the Pacific Flyway and United States. U.S. Fish and Wildlife Service, Division of Migratory Bird Management, Portland, Oregon.
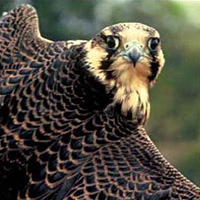
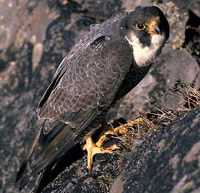
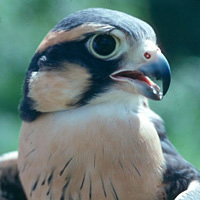
American peregrine falcon (Falco peregrinus anatum)
| Status: Delisted | Critical habitat: 8/11/1977 |
| Listed: 6/2/1970 | Recovery plan: 6/30/1991 |
Range: AL(m), AK(b), AZ(b), AR(m), CA(b), CO(b), CT(b), DE(b), DC(m), GA(b), ID(b), IL(b), IN(b), IA(b), KS(m), KY(b), LA(m), ME(b), MD(b), MA(b), MI(b), MN(b), MS(m), MO(m), MT(b), NE(b), NV(b), NH(b), NY(b), NM(b), NJ(b), NC(b), ND(m), OH(b), OK(m), OR(b), PA(b), RI(b), SC(b), SD(b), TN(b), TX(b), UT(b), VT(b), VA(b), WA(b), WV(m), WI(b), WY(b) ---
SUMMARY
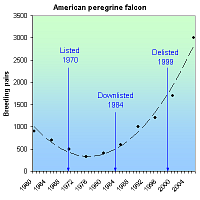
The use of DDT and other organochlorine pesticides thinned American peregrine falcon eggshells, causing reproductive failure and population declines. The banning of DDT, captive-breeding efforts and nest protections allowed falcons to increase from 324 breeding pairs in 1975 to 3,005 pairs as of 2006. The species was delisted in 1999.
RECOVERY TREND
The American peregrine falcon (Falco peregrinus anatum) breeds only in North and Central America and occurs throughout much of North America from the subarctic boreal forests of Alaska and Canada south to Mexico [1]. It is estimated that prior to the 1940s, there were approximately 3,875 nesting pairs of peregrines in North America [1]. From the 1940s through the 1960s, however, the population of the peregrine, and many other raptors, crashed as a result of the introduction of synthetic organochlorine pesticides to the environment. By 1975, there were only 324 known nesting pairs of American peregrine falcons in the U.S. [2].
Scientists investigating the peregrine's decline found unusually high concentrations of the pesticide DDT and its breakdown product DDE in peregrine falcons and other birds of prey [1]. Organochlorine pesticides were put into use following World War II. Use peaked in the late 1950s and early 1960s and continued through the early 1970s [1]. Organochlorine pesticides cause direct mortality and reduced reproduction in birds of prey because they ingest high doses of pesticides concentrated and stored in the fatty tissue of prey animals that themselves ingested contaminated food [1]. Heavily contaminated females may fail to lay eggs and organochlorines passed from the female to the egg can kill the embryo before it hatches [1]. DDE, the principal metabolite of DDT, prevents normal calcium deposition during eggshell formation, causing eggs to frequently break before hatching [1]. During the period of DDT use in North America, eggshell thinning and nesting failures were widespread in peregrine falcons, and in some areas, successful reproduction virtually ceased [1].
The degree of exposure to these pesticides varied among regions, and peregrine falcon numbers in more contaminated areas suffered greater declines [1]. The eastern population plunged from an estimated 350 active nest sites in the 1930s and 1940s to no active breeding birds from 1964 to 1975 [3]. Peregrine falcons in the Great Plains states east of the Rocky Mountains and south of U.S. and Canadian boreal forests were also essentially extirpated [1]. West of the 100th meridian, peregrine falcons were significantly reduced [1]. Local populations were greatly depressed or extirpated and by 1965 fewer than 20 pairs were known west of the U.S. Great Plains [1].
In 1970, the American peregrine was listed as endangered and efforts to recover the species began. The use of DDT was banned in Canada in 1970 and in the United States in 1972 [1]. This was the single-most significant action in the recovery of the peregrine falcon [1]. In addition, in the eastern United States, efforts were made to reestablish peregrine falcons by releasing offspring from a variety of wild stocks that were held in captivity by falconers [1]. The first experimental releases of captive-produced young occurred in 1974 and 1975 in the eastern United States [1]. These and future releases demonstrated that “hacking,” the practice of retaining and feeding young captive bred birds in partial captivity until they are able to fend for themselves, was an effective method of introducing captive-bred peregrines to the wild [1]. Since then, more than 6,000 falcons have been released in North America [1]. Approximately 3,400 peregrines were released in parts of southwest Canada, the northern Rocky Mountain States, and the Pacific Coast states [1].
In the late 1970s, Alaska became the first place American peregrine falcon population growth was documented and, by 1980, populations began to grow in other areas [1]. Not only did the number of peregrine falcons begin to increase, productivity (another important measure of population health) improved [1]. Efforts to reestablish peregrine falcons in the East and Midwest proved largely successful, leading to downlisting of the species in 1984 [1], and by 1999 peregrines were found to be nesting in all states within their historical range east of the 100th meridian, except for Rhode Island, West Virginia and Arkansas [1]. In highly urban areas, peregrine falcons showed great adaptability, and began substituting skyscrapers for natural cliff faces as nesting sites [4]. By 1998, the total known breeding population of peregrine falcons was 1,650 pairs in the United States and Canada, far exceeding the recovery goal of 456 pairs. Other recovery goals, including estimates of productivity, egg-shell thickness, and contaminants levels, had also been met, allowing the species to be delisted in 1999 [1]. Monitoring of American peregrine populations has continued under a post-delisitng monitoring plan [5]. The estimated North American population was 3,005 pairs as of 2006 [6].
ALASKA: Surveys conducted between 1966 and 1998 along the upper Yukon River demonstrated increases in the number of occupied nesting territories from a low of 11 known pairs in 1973 to 46 pairs in 1998 [1]. Similarly, along the upper Tanana River, the number of occupied nesting territories increased from two in 1975 to 33 in 1998 [1]. The recovery objective of 28 occupied nesting territories in the two study areas was first achieved in 1988, with 23 nesting territories on the Yukon River and 12 on the Tanana River [1].
PACIFIC STATES: By 1976, no American peregrine falcons were found at 14 historical nest sites in Washington [1]. Oregon had also lost most of its peregrine falcons and only one or two pairs remained on the California coast [1]. Surveys conducted from 1991 to 1998 indicated a steadily increasing number of American peregrine falcon pairs breeding in Washington, Oregon and Nevada [1]. Known pairs in Washington increased from 17 to 45 and in Oregon from 23 to 51 [1]. The number of American peregrine falcons in California increased from an estimated low of five to 10 breeding pairs in the early 1970s to a minimum of 167 occupied sites in 1998 [1]. The increase in California was concurrent with the restriction of DDT and included the release of more than 750 American peregrine falcons through 1997 [1].
ROCKY MOUNTAINS/SOUTHWEST: The Rocky Mountain/Southwest population of the American peregrine falcon has made a profound comeback since the late 1970s when surveys showed no occupied nest sites in Idaho, Montana or Wyoming and only a few pairs in Colorado, New Mexico and the Colorado Plateau, including parts of southern Utah and Arizona [1]. Surveys conducted from 1991 through 1998 indicated that the number of American peregrine falcon pairs in the Rocky Mountain/Southwest area has steadily increased [1]. In 1991, there were 367 known pairs; in 1998 the number of pairs increased to 535 [1].
EASTERN STATES: The eastern peregrine population has a unique history and complex status under the Act [1]. Peregrine falcons were extirpated in the eastern United States and southeastern Canada by the mid-1960s [1]. Releases of young captive bred peregrines have reestablished populations throughout much of their former range in the East [1]. In 1998, 193 pairs were counted in five designated eastern state recovery units [1]. The number of territorial pairs recorded in the eastern peregrine falcon recovery area increased an average of 10 percent annually between 1992 and 1998 [1]. Equally important, the productivity of these pairs during the same seven-year period averaged 1.5 young per pair, demonstrating sustained successful nesting [1].
CITATIONS
[1] U.S. Fish and Wildlife Service. 1999. Final Rule to Remove the American Peregrine Falcon from the Federal List of Endangered and Threatened Wildlife, and to Remove the Similarity of Appearance Provision for Free-Flying Peregrines in the Conterminous United States. Federal Register (64 FR 46542).
[2] Hoffman, C. 1999. The Peregrine Falcon is Back! New release, U.S. Fish and Wildlife Service, August 20, 1999.
[3] Clark, K. 2005. The Peregrine Falcon in New Jersey, Report for 2005. New Jersey Department of Environmental Protection, Division of Fish and Wildlife, Endangered and Nongame Species Program.
[4] New Jersey Division of Fish and Wildlife. Fact sheet, Peregrine Falcon Falco pereginus. New Jersey Department of Environmental Protection, Division of Fish and Wildlife, Endangered and Nongame Species Program. Website <http://www.njfishandwildlife.com/tandespp.htm> accessed February, 2006.
[5] U.S. Fish and Wildlife Service. 2003. Monitoring Plan for the American Peregrine Falcon, A Species Recovered Under the Endangered Species Act. U.S. Fish and Wildlife Service Division of Endangered Species and Migratory Birds and State Programs. Pacific Region, Portland Oregon 53pp.
[6] Green, M., T. Swem, M. Morin, R. Mesta, M. Klee, K. Hollar, R. Hazelwood, P. Delphey, R. Currie, and M. Aramal. 2006. Monitoring Results for Breeding American Peregrine Falcons (Falco peregrinus anatum), 2003. Biological Technical Publication BTP-R1005-2006. U.S. Department of Interior, Washington, D.C.
Arctic peregrine falcon (Falco peregrinus tundrius)
| Status: Delisted | Critical habitat: none | Listed: 6/2/1970 | Recovery plan: 6/30/1991 |
Range: AL(m), AK(b), AZ(m), AR(m), CA(m), CO(m), CT(m), DE(m), DC(m), FL(m), GA(m), ID(m), IL(m), IN(m), IA(m), KS(m), KY(m), LA(m), ME(m), MD(m), MA(m), MI(m), MN(m), MS(m), MO(m), MT(m), NE(m), NV(m), NH(m), NY(m), NM(m), NJ(m), NC(m), ND(m), OH(m), OK(m), OR(m), PA(m), RI(m), SC(m), SD(m), TN(m), TX(m), UT(m), VT(m), VA(m), WA(m), WV(m), WI(m), WY(m) ---
SUMMARY
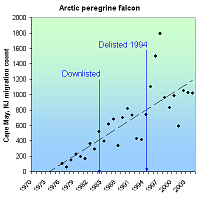
The Arctic peregrine falcon declined due to the egg shell-thinning effects of DDT and other organochlorine pesticides. Its listing as an endangered species in 1970 (along with other birds of prey) prompted the EPA to ban DDT in 1972. Counts of migratory Arctic falcons increased from 103 in 1976, to 1,017 in 2004. The species was downlisted to threatened in 1984 and delisted in 1991.
RECOVERY TREND
The Arctic peregrine falcon (Falco peregrinus tundrius) is one of three peregrine falcon subspecies [1]. It nests in tundra regions of Alaska, Canada (Yukon, Northwest Territories, Quebec, and possibly Labrador), and the ice-free perimeter of Greenland [1]. It is a long-distance migrant that winters in Latin America from Cuba and Mexico south through Central and South America [1].
Severe declines in peregrine falcon numbers began in the 1950s [1]. These declines were linked to organochlorine pesticides that were put into use following World War II, and whose use peaked in the late 1950s-early 1960s [1]. Scientists investigating the peregrine's decline found unusually high concentrations of the pesticide DDT and its breakdown product DDE in peregrine falcons and other birds of prey [2]. Organochlorine pesticides cause direct mortality and reduced reproduction in birds of prey which, being at the top of the food chain, ingest high doses of pesticides concentrated and stored in the fatty tissue of prey animals that themselves ingested contaminated food [1]. Heavily contaminated females may fail to lay eggs and organochlorines passed from the female to the egg can kill the embryo before it hatches. DDE, the principal metabolite of DDT, prevents normal calcium deposition during eggshell formation, causing eggs to frequently break before hatching [1]. Arctic peregrine numbers reached their lowest levels in the early 1970s and in some areas of North America successful reproduction virtually ceased [1]. Populations are thought to have decreased by as much as 80 percent [2].
The listing of the Arctic peregrine falcon as endangered in 1970--as well as the bald eagle, brown pelican, and American peregrine falcon shortly before--fostered a national outcry against the production and spaying of DDT. In 1972, the Environmental Protection Agency banned most used of DDT in the United States [1]. Canada had already restricted DDT use in 1970. These restrictions are the central cause of the recovery of the Arctic and American peregrine falcons (the bald eagle and brown pelican benefited greatly as well, but their recovery also involved substantial habitat protections and reintroductions).
As DDT levels declined after 1972, peregrine falcon productivity rates rose to pre-DDT levels and the population size and range began to increase. This happened most rapidly in northern areas, where pesticide exposur was lower and impacts upon populations were less severe [1]. In 1984, the U.S. Fish and Wildlife Service downlisted the Arctic peregrine falcon from endangered to threatened status [2, 6]. In 1991, the agency initiated a review determine if the species had recovered [2] and in 1994 removed it from the endangered species list [6].
Four major factors were considered in the delisting process: (1) Population size and trend, (2) reproductive performance, (3) pesticide residues in eggs, and (4) eggshell thickness [1]. Despite a lack of long-term studies using consistent methodologies, there was strong evidence of significant population increases throughout the Arctic [1]. Four areas in northern North America (one in Alaska and three in Canada’s North West Territories) for which historical survey information was available indicated the number of Arctic peregrine pairs occupying nesting territories increased since the 1960s [1]. Some areas of Alaska even exceeded the original estimates of pre-DDT-era population size [1]. In addition, in the eastern Arctic, peregrines began nesting in previously vacant nesting sites [1]. Standardized yearly migration counts at New Jersey’s Cape May, an area where Arctic peregrines concentrate during migration, also saw increasing numbers, most likely from Arctic breeding grounds especially in Greenland and eastern Canada (these counts may have also contained peregrines in the American subspecies; however, banding recoveries indicate that the majority of peregrines along the East Coast during fall migration are from the Arctic and thus represent a true increase in Arctic peregrine numbers) [1].
Productivity in all regions where data had been gathered was sufficient to support a stable or increasing population since the 1980s [1]. There had also been improvements in levels of DDE concentration in eggs. Concentrations in excess of 15-20 parts per million (wet weight basis) are associated with high rates of nesting failure. Residue in eggs in 1993 was well below this critical level [1]. Alaskan eggshells collected between 1988 to 1991 were on average only 12 percent thinner than pre-DDT thickness (17 percent or greater reduction in thickness results in population declines).
Arctic peregrine falcon numbers have continued to rise after the species' delisting. On the Sagavanirktok River in Alaska, where Arctic peregrine surveys have been conducted since the late 1950s, the number of pairs increased from five in 1958, to 23 in 1992, to 25 in 1999 [3]. Migration counts at the Cape May Hawkwatch site in New Jersey increased from 103 in 1976 to 1,024 in 2003 [4].
CITATIONS
[1] U.S. Fish and Wildlife Service. 1993. Proposal to Remove the Arctic Peregrine Falcon From the List of Endangered and Threatened Wildlife. 58 Fed. Reg 188.
[2] U.S. Fish and Wildlife Service. 1995. Peregrine falcon, (Falco peregrinus anatum, Falco peregrinus tundrius, Falco peregrinus pealei). Species account. Website <http://www.fws.gov/species/species_accounts/bio_pere.html> accessed October, 2005.
[3] Wright, J.M. and P.J. Bente. 1999. Documentation of active peregrine falcon nest sites, 1 Oct 1994- 31 March 1998. Alaska Department of Fish and Game. Annual research report. Endangered species conservation fund federal aid project SE-2-9, 10, and 11. Juneau, AK. 15 pp.
[4] Cape May Bird Observatory. 2012. Cape May Hawkwatch, Cape May, New Jersey. New Jersey Audubon Society. Website <http://www.njaudubon.org/Sightings/cmhw25.html> accessed April 2, 2012.
[5] NatureServe. 2011. NatureServe’s Central Databases. Arlington, VA. U.S.A
[6] U.S. Fish and Wildlife Service. 1994. Removal of Arctic Peregrine Falcon From the List of Endangered and Threatened Wildlife. 59 Fed. Reg. 50796.
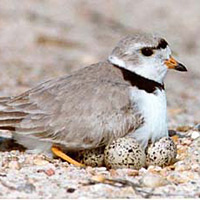
Atlantic piping plover (Charadrius melodus (Atlantic DPS))
| Status: Endangered | Critical habitat: 7/10/2001 | Listed: 12/11/1985 | Recovery plan: 5/18/1999 |
Range: AL(s), CT(b), DE(b), FL(s), GA(s), LA(s), ME(b), MD(b), MA(b), MS(s), NH(b), NY(b), NJ(b), NC(b), PR(s), RI(b), SC(b), TX(s), VA(b) ---
SUMMARY
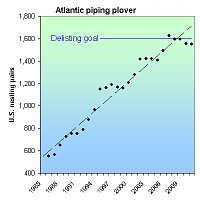
Atlantic piping plover populations initially declined due to hunting and the millinery trade. With these eliminated, it increased in the first half of the 20th century, but began declining after 1950 due to development, beach crowding and predation. It was listed as 1985 after which intensive habitat protection and control of recreationists and predators, increased its U.S. population from 550 pairs in 1986 to 1,550 in 2011, reaching its overall U.S. recovery goal in 3 of the last 5 years.
RECOVERY TREND
The Atlantic piping plover (Charadrius melodus) breeds on Atlantic coastal beaches from Newfoundland to northernmost South Carolina [1]. Hunters and the millinery trade decimated the species in the late 19th and early 20th centuries, but were stopped by the Migratory Bird Treaty Act of 1918. The plover steadily recovered until about 1950, then began to decline again under pressure from development, beach stabilization programs, increased recreation, and anthropogenically caused increases in predation by native and introduced species.
Following its listing as an endangered species in 1985, the plover was subject to intense nest site, nest area, and predator management programs, resulting in the following population growth between 1986 and 2011 [1, 2, 3]:
POPULATION 1986-2011 GROWTH RECOVERY GOAL YEARS AT RECOVERY GOAL
Canada: 240 - 209 pairs 400 pairs 0
New England 184 - 825 pairs 625 pairs At least 100% of goal, last 14 years
New York/New Jersey: 208 - 431 pairs 575 pairs At least 90% of goal, 6 of last 9 years
South Atlantic: 158 - 294 pairs 400 pairs 0
U.S. population: 550 - 1,550 pairs 1,600 pairs At least 100% of goal, 3 of last 5 years
Total: 790 - 1,759 pairs 2,000 pairs At least 87% of goal, last six years
The 1996 federal recovery plan [1] established the following delisting criteria: 1) Increase and maintain for five years a total of 2,000 breeding pairs, distributed among four recovery units as follows: Canada, 400 pairs; New England, 625 pairs; New York-New Jersey, 575 pairs; Southern (DE-MD-VA-NC), 400 pairs. 2) Verify the adequacy of a 2,000-pair population of piping plovers to maintain heterozygosity and allelic diversity over the long term. 3) Achieve five-year average productivity of 1.5 fledged chicks per pair in each of the four recovery units described in criterion 1, based on data from sites that collectively support at least 90 percent of the recovery unit’s population. 4) Institute long-term agreements to assure protection and management sufficient to maintain the population targets and average productivity in each recovery unit. 5) Ensure long-term maintenance of wintering habitat, sufficient in quantity, quality and distribution to maintain survival rates for a 2,000-pair population.
- The New England unit exceeded its recovery plan goal of 625 nesting pairs each of the 14 years between 1998 and 2011 and cointinues to grow.
- The New York/New Jersey unit grew steadily from 1986 to 2007, the only year in which it reached its recovery plan goal. It declined in all years from 2008 to 2011. While it has been at at least 90% of its goal in six of the nine years ending in 2011, the recent declines are worrisome.
- The Southern recovery unit was relatively stable betwee 1986 and 2003, grew rapidly between 2004 and 2008, then remained relatively stable at a reduced level from 2009 to 2011. It has never reached its recovery goal and has always been the smallest and slowest growing of the three U.S. recovery units.
- The U.S. population as a whole had strong, steady growth between 1986 and 2007, increasinging from 550 to 1,624 pairs. 2007 was the first year it reached its recovery goal of 1,600 pairs. From 2009 to 2011, it declined slightly to 1,550 pairs. The U.S. trend is dominated by the New England recovery unit which is the largest, fastest and most consistently growing.
- The Canadian recovery unit has periods of growth and decline, but remained at 200-250 nesting pairs in almost all years between 1986 and 2011. It the smallest of all the recovery units and the only one not to have experienced net growth since 1986.
CITATIONS
[1] U.S. Fish and Wildlife Service. 1996. Piping Plover (Charadrius melodus), Atlantic Coast Population, Revised Recovery Plan. Hadley, Massachusetts. 258 pp.
[2] U.S. Fish and Wildlife Service. 2011. Abundance and productivity estimates – 2010 update: Atlantic Coast piping plover population. Sudbury, MA. Available at http://www.fws.gov/northeast/pipingplover/pdf/Abundance&Productivity2010Update.pdf
[3] U.S. Fish and Wildlife Service. 2012. Preliminary 2011 Atlantic Coast Piping Plover Abundance and Productivity Estimates, March 20, 2012. Sudbury, MA. Available at http://www.fws.gov/northeast/pipingplover/preliminary2011%2020March2012%20for%20AC%20website.pdf
[5] U.S. Fish and Wildlife Service. 2009. Piping Plover (Charadrius melodus) 5-Year Review: Summary and Evaluation. 214 pp.
Bald eagle (continental U.S. DPS) (Haliaeetus leucocephalus (Continental U.S. DPS))
| Status: Delisted | Critical habitat: none | Listed: 3/11/1967 | Recovery plan: 5/18/1999 |
Range: AL(b), AZ(b), AR(b), CA(b), CO(b), CT(b), DE(b), DC(b), FL(b), GA(b), ID(b), IL(b), IN(b), IA(b), KS(b), KY(b), LA(b), ME(b), MD(b), MA(b), MI(b), MN(b), MS(b), MO(b), MT(b), NE(b), NV(b), NH(b), NY(b), NM(b), NJ(b), NC(b), ND(b), OH(b), OK(b), OR(b), PA(b), RI(b), SC(b), SD(b), TN(b), TX(b), UT(b), VT(b), VA(b), WA(b), WV(b), WI(b), WY(b) ---
SUMMARY
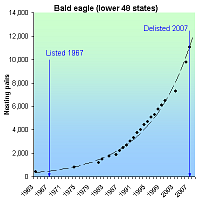
The bald eagle declined throughout the lower 48 states, and was extirpate from most of them due to habitat loss, persecution, and DDT-related eggshell thinning. The banning of DDT, increased wetland protection and restoration, and an aggressive, mostly state-based reintroduction program caused eagle pairs to soar from 416 in 1963 to 11,052 in 2007 when the eagle was removed from the endangered list.
RECOVERY TREND
The bald eagle (Haliaeetus leucocephalus) first declined in the 1800s at the hands of trophy hunters, feather collectors, and wanton killing [1]. It was already extirpated or at low numbers in most states by the 1940s when DDT and other organochlorines became widely used. DDE, a breakdown product of DDT, accumulates in the fatty tissue of female eagles, impairing the formation of calcium needed for normal egg formation, causing a decline in reproductive success. DDT caused eagle numbers plummet further, and in 1967 the species was listed as endangered in the lower 48 states [1].
The eagle was joined on the list by the American peregrine falcon, Arctic peregrine falcon and brown pelican in 1970. The listing of these large, charismatic birds rallied the nation to band the production and sale of DDT in 1972.
Due to the DDT ban, increased habitat protection, and aggressive captive breeding and translocation programs (mostly run by state wildlife agencies), bald eagle pairs in the lower 48 soared from 416 in 1963 to 11,052 in 2007 when it was removed from the threatened species list [2, 7]. In 1984, 13 states lacked nesting eagles. By 1998, it was absent from only two. By 2006, it nested in all 48 states [7].
The eagle was proposed for delisting in 1998 [1] and again in 2006 [4]. It was downlisted in 1995 and delisted in 2007 [6].
The bald eagle is managed under five federal recovery plans, divided by region:
Chesapeake Recovery Region: Virginia east of Blue Ridge Mountains, Delaware, Maryland, the eastern half of Pennsylvania, West Virginia Panhandle and two-thirds of New Jersey. Delisting goals were met in 1996 [1]. As of 2003, there were more than 800 nesting pairs in this region [4].
Northern States Recovery Region: 25 Northernmost states. Delisting goals were met in 1991, with 1,349 occupied breeding areas across 20 states. As of 2007, there were an estimated 4,215 breeding pairs in the northern recovery region [6].
Pacific Recovery Region: Idaho, Nevada, California, Oregon, Washington, Montana and Wyoming. Numeric delisting goals were met in 1995 [1]. As of 2001, there were
1,627 nesting pairs in this recovery region [4].
Southeastern Recovery Region: Alabama, Arkansas, Florida, Georgia, Kentucky, Louisiana, Mississippi, North Carolina, South Carolina, Tennessee and eastern Texas. Downlisting goals were met between 1991 and 1998. More than 1,700 pairs were counted in 2000 [4, 6].
Southwestern Recovery Region: Oklahoma and Texas west of the 100th meridian, New Mexico, Arizona and California bordering the Lower Colorado River. The goal established in the recovery plan has been exceeded. In 2003, 46 occupied breeding areas were reported in New Mexico and Arizona. In 2004, the Arizona had 41 occupied breeding areas [4].
In the eight Northeast states from New Jersey to Maine and Vermont, nesting eagle pairs increased from 21 in 1967 to 562 in 2005 [5]. The majority were in Maine, which supported all 21 pairs in 1967 and 385 pairs in 2005. Eagles returned to Massachusetts and New Hampshire in 1990, with the former supporting 19 pairs in 2005 and the latter eight in 2004. In 2005 there were 53 pairs in New Jersey, 94 in New York and one in Vermont. The Northeast is also an important wintering area, with the Connecticut population increasing from 20 to 92 between 1979 and 2005, and the New York population increasing from six to 194 between 1978 and 2006 [5].
CITATIONS
[1] U.S. Fish and Wildlife Service. 1999. Proposed rule to remove the bald eagle in the Lower 48 states from the list of endangered and threatened wildlife. Federal Register, July 6, 1999 (64 FR 36453)
[2] U.S. Fish and Wildlife Service. 2007. Bald Eagle Numbers Soaring. May 14, 2007 press release.
[4] U.S. Fish and Wildlife Service. 2006. Removing the bald eagle in the Lower 48 States from the list of endangered and threatened wildlife; reopening of public comment period with new information. Federal Regiter, February 16, 2006 (71 FR 8238).
[5] Center for Biological Diversity. 2006. Bald eagle trends in the Northeastern United States. Tucson, AZ.
[6] U.S. Fish and Wildlife Service. 2007. Removing the Bald Eagle in the Lower 48 States From the List of Endangered and Threatened Wildlife; Final Rule. 72 Fed. Reg 37346.
[7] Suckling, K. and W. Hodges. Status of the bald eagle in the lower 48 states and the District of Columbia: 1963-2007. Center for Biological Diversity, Tucson, AZ. Available at http://www.biologicaldiversity.org/species/birds/bald_eagle/report/index.html.
Brown pelican (Eastern DPS) (Pelecanus occidentalis (Atlantic/Eastern Gulf Coast DPS))
| Status: Delisted | Critical habitat: none | Listed: 10/13/1970 | Recovery plan: 6/30/1980 |
Range: AL(b), CT(o), DE(s), FL(b), GA(b), ME(o), MD(b), MA(o), NH(o), NY(s), NJ(s), NC(b), RI(o), SC(b), VA(b) ---
SUMMARY
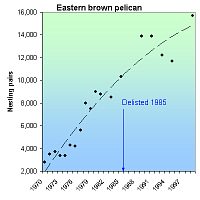
Reproductive failure due to eggshell thinning, caused by the pesticide DDT, was the main cause of brown pelican population declines. The pelican has recovered, but now faces threats from offshore oil and wind development, rising sea levels and hurricanes. Brown pelican nests on the Atlantic Coast increased from 2,796 in 1970 to 15,670 in 1999; on the eastern Gulf Coast, nest numbers increased slightly from 5,100 in 1970 to 5,682 in 1999. The eastern brown pelican was delisted in 1985 due to recovery.
RECOVERY TREND
The southeastern brown pelican (Pelecanus occidentalis pop.) breeds from Maryland south along the Atlantic Coast to southern Florida and westward along the Gulf Coast to Alabama [1]. The brown pelican occurs regularly as a non-breeder in New York, New Jersey and Delaware, and occasionally northward to Nova Scotia.
The listing history of this population is complex. The brown pelican species was listed as endangered throughout its range in 1970. The "southeastern brown pelican," a taxon not previously recognized by scientists or wildlife managers, was separated from the rest of the species, declared recovered, and delisted in 1985 [1]. This distinct population includes, and is limited to, all portions of the eastern brown pelican (P. o. carolinensis) east of Mississippi.
Nests on the Atlantic Coast increased from 2,796 in 1970 to 10,300 in 1985, when it was delisted, and numbered 15,670 in 1999. Nests on the Gulf Coast (eastern and western) increased from 5,100 in 1970 to 7,000 in 1985 when the Eastern Gulf Coast population was delisted, then continued increasing to 24,400 in 1999.
MARYLAND: Prior to 1987, when six pairs nested on a state-owned dredge spoil island in Chincoteague Bay near Assateague Island, the brown pelican had not been recorded nesting in Maryland [3,4]. Nesting pairs increased from 26 in 1989 to 1,042 in 2008 [5].
VIRGINIA: The brown pelican was not recorded as nesting in Virginia prior to 1987 [4]. Nests increased from 37 in 1989 to 1,406 in 1999 [2]. In 2008 there were 1,924 breeding pairs in the state [6].
NORTH CAROLINA: Nests increased from 75 in 1976 [1] to 4,350 in 1999 [2]. In 2007 there was a marked decrease to 3,452 nests [7].
SOUTH CAROLINA: Nests increased from 1,117 in 1970 [1] to 7,739 in 1989, then decreased to 3,486 in 1999 [2]. The latter decline is believed to be the result of key island habitats eroding away. The birds likely moved to other states. In 2009 there were 3,985 nests [8].
GEORGIA: The first record of nesting pelicans was in 1988 [2]. Nests increased from 200 in 1989 to around 3,500 nests in 2007 [2,9].
FLORIDA: Nests increased from 7,690 in 1970 [1] to 12,312 in 1989 [2], then decreased to only 4,724 nesting pairs in 2007 [10], which is the lowest number of nests recorded in the state since before 1970.
ALABAMA: The brown pelican was not recorded to nest in Alabama prior to 1983 [1]. Nests increased from 588 in 1989 to around 5,000 as of 2006 [11].
NEW JERSEY: Beginning in the 1980s, brown pelicans were seen with some regularity during the summer. Several pairs unsuccessfully attempted to nest in 1992 and 1994 [2].
NEW YORK: Beginning in the 1980s, brown pelicans were seen with some regularity during the summer, but have not been recorded nesting [2].
DELAWARE: Beginning in the 1980s, brown pelicans were seen with some regularity during the summer, but have not been recorded nesting [2].
CITATIONS
[1] U.S. Fish and Wildlife Service. 1985. Removal of the brown pelican in the southeastern United States from the list of endangered and threatened wildlife. Federal Register (50:4938).
[2] Shields, M. 2002. Brown Pelican (Pelecanus occidentalis). In The Birds of North America, No. 609 (A. Poole and F. Gill, eds.). The Birds of North America, Inc., Philadelphia, PA.
[3] USGS. 2005. Biological and ecotoxicological characteristics of terrestrial vertebrate species residing in estuaries. U.S. Geological Survey. Website (www.pwrc.usgs.gov/bioeco/bpelican.htm) accessed December 30, 2005.
[4] Brinker, D.F. 2006. Brown pelican nesting in Maryland, 1986-2005. Data provided by David Brinker, Natural Heritage Program, Maryland Department of Natural Resources, Cantonsville, MD, January 3, 2006.
[5] Maryland Department of Natural Resources. 2008. Creature Feature: Brown Pelican. Accessed July 27, 2010 at: http://dnr.maryland.gov/mydnr/creaturefeature/brownpelican.asp
[6] Watts, B. D. and B. J. Paxton. 2009. Status and distribution of colonial waterbirds in
coastal Virginia: 2009 breeding season. CCBTR-09-03. Center for Conservation Biology, College of William and Mary/Virginia Commonwealth University, Williamsburg, VA 21 pp.
[7] North Carolina Wildlife Resources Commission. 2008. Annual Program Report 2007-2008. Wildlife Diversity Program Division of Wildlife Management. Accessed July 27, 2010 at: http://www.ncwildlife.org/Wildlife_Species_Con/documents/AnnualProgramReportWDinWM07-08.pdf
[8] South Carolina Department of Natural Resources (SCDNR). 2010. Untitled population data provided to U.S. Fish and Wildlife Service. Obtained via FOIA FWS-2010-00941.
[9] Jodice, P.G.R., T.M. Murphy, F.J. Sanders, and L.M. Ferguson. 2007. Longterm Trends in Nest Counts of Colonial Seabirds in South Carolina, USA.
[10] Florida Fish and Wildlife Conservation Commission. 2007. Fiscal Year 2006-2007 Progress Report on activities of the Endangered and Threatened Species Management and Conservation Plan. Accessed July 27, 2010 at: http://www.myfwc.com/docs/WildlifeHabitats/Endangered_Threatened_Species_Progress_Report_2006_2007.pdf#search=%22brown%20pelican%2
[11] Morley, D.F. 2006. 2006 Alabama Coastal BirdFest. Conservation News, Alabama Dept. of Conservation and Natural Resources. Accessed August 2, 2010 at: http://www.outdooralabama.com/outdoor-alabama/07-06news.pdf.
California brown pelican (Pelecanus occidentalis californicus )
| Status: Delisted | Critical habitat: none | Listed: 10/13/1970 | Recovery plan: 2/3/1983 |
Range: AZ(o), CA(b), OR(s), WA(s) ---
SUMMARY
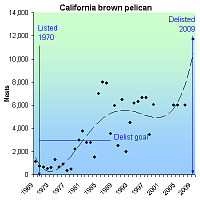
The California brown pelican declined due to habitat loss, reproductive failure from DDT-related eggshell thinning and toxic exposure to the pesticide endrin. It was listed as endangered in 1970, but continued declining to a low of 466 pairs in 1978. Since then, it as increased, though inconsistently, reaching 11,695 nesting pairs when delisted in 2009. The banning of DDT and protection of nesting areas, especially in Channel Islands National Park, are responsible for its recovery.
RECOVERY TREND
The California brown pelican’s (Pelecanus occidentalis californicus) breeding range extends from California's Channel Islands south along the Pacific coast to Baja California, eastward throughout most of the Gulf of California, and southward along the mainland Pacific coast of Mexico to Islas Tres Maria [1]. It formerly bred as far north as Point Lobos in Monterey County. Currently, U.S. nesting colonies are located on West Anacapa and Santa Barbara islands of the California Channel Islands. The nesting range recently expanded to the Salton Sea [1]. As non-breeders, pelicans occur from southern British Columbia to El Salvador and inland in the U.S. to Southern California and Arizona.
The California nesting population declined from 1,125 to 727 annual nests between 1969 and 1970 when the species was placed on the list of endangered species [1]. The primary cause of decline was exposure to the pesticides endrin, which caused pelican mortality, and DDT, which caused egg-shell thinning. The Channel Island population was particularly impacted by a single Los Angeles factory which began discharging 200 to 500 kilograms of DDT daily in 1952.
DDT was banned in 1972, in large part because of the endangered species listing of the pelican, bald eagle and peregrine falcon. Following the ban, the pelican’s reproductive success began to improve quickly, although breeding effort did not show significant improvement until the early 1980s [3]. With the exception of a good year in 1974, the number of nests remained at low levels through 1978 when a low of 466 nests was recorded. Between 1979 and 1987, the population rose rapidly to 7,900 nests. Between 1987 and 2004, the number of nests fluctuated around a mean of about 5,000 nests. The 2004 nest count was about 7,500 (6,000 on West Anacapa and 1,500 on Santa Barbara Island). The 2006 nest count was about 9,000 with nesting on all three Anacapa islands (4,000 to 5,000), Santa Barbara Island (4,000) and Prince Island (43) [5]. 2006 was the first year since monitoring began that breeding occurred on all three Anacapa islands and the first time since 1939 that breeding occurred on Prince Island. In 1996, a small population of pelicans began nesting in the Salton Sea and has been present in most years since.
The California brown pelican was delisted in 2009 due to recovery, at which time there were 11,695 nesting pairs [7].
CITATIONS
[1] Shields, M. 2002. Brown Pelican (Pelecanus occidentalis). In The Birds of North America, No. 609 (A. Poole and F. Gill, eds.). The Birds of North America, Inc., Philadelphia, PA.
[2] Rogers, T. 2004. Spate of juvenile deaths follows breeding success. San Diego Union Tribune, August 1, 2004.
[3] Harrison, S.C. 2005. Petition to Delist the California Brown Pelican From the Listed of Endangered or Threatened Species Under the Endangered Species Act. Hunton & Williams, Washington, D.C., December 14, 2005.
[4] U.S. Fish and Wildlife Service. 2006. 90-Day Finding on a Petition to Delist the California Brown Pelican and Initiation of a 5-Year Review for the Brown Pelican. Federal Register, May 24, 2006 (71 FR 29908-29910).
[5] Broddrick, L.R. 2006. October 6, 2006 memorandum from L. Ryan Broddrick, Director, California Department of Fish and Game to John Carlson, Jr., Executive Director, California Fish and Game Commission, "Subject: Request of Endangered Species Recovery Council to delist the California brown pelican (Pelecanus occidentalis californicus) under the California Endangered Species Act."
[6] U.S. Fish and Wildlife Service. 2007. 5-Year Review of the Listed Distinct Population Segment of the Brown Pelican (Pelecanus occidentalis). Albuquerque, NM.
[7] U.S. Fish and Wildlife Service. 2009. Removal of the Brown Pelican (Pelecanus occidentalis) From the Federal List of Endangered and Threatened Wildlife. Federal Register, November 17, 2009 (74 FR 59444-59472).
California condor (Gymnogyps californianus)
| Status: Endangered | Critical habitat: 9/24/1976 | Listed: 3/11/1967 | Recovery plan: 4/25/1996 |
Range: AZ(b), CA(b) --- NV(x), OR(x), UT(x), WA(x)
SUMMARY
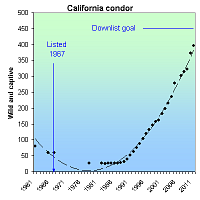
The California condor was nearly driven extinct by DDT, lead poisoning from ingested bullet fragments, and hunting. Lead poisoning remains a major threat to the species. Wild condors declined to nine birds by 1985. A captive-breeding and release program has increased the population to 386 birds as of 2012, including 213 wild and 173 captive birds.
RECOVERY TREND
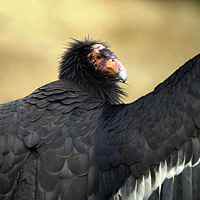
The California condor (Gymnogyps californianus) is a member of the vulture family and one of the largest flying birds in the world [1]. Ten-thousand years ago, its range extended across most of North America, but by the arrival of Europeans, its range was largely restricted to the Pacific Coast from British Columbia south to Baja California. By 1940, it was found only in the coastal mountains of Southern California where it nested in the rugged mountains and scavenged in the foothills and grasslands of the San Joaquin Valley. It was listed as an endangered species in 1967 and was given critical habitat the same year.
The condor's decline was driven by DDT which compromised reproduction, poisoning fromlead poisoning, shooting, collection, and drowning in uncovered oil sumps [1].
About 600 birds remained in 1890 [1, 2, 3]. It declined to about 60 birds in the late 1930s and early 1940s, 40 in the early 1960s, 27 in 1978, and nine in 1985. All remaining wild birds were taken into captivity in 1987. Since then, a successful captive breeding and reintroduction program increased the 2005 wild population to 121 and the captive population to 158 [2, 3].
The California Department of Fish and Game reports 302 condors in 2007; 315 in 2008; 322 in 2009; 373 in 2010; and 396 in 2011 [4].
The California condor now occurs in three wild populations: in mountains north of the Los Angeles basin, in the Big Sur area of the central California coast, and near the Grand Canyon in Arizona [1].
CITATIONS
[1] U.S. Fish and Wildlife Service. 1996. California Condor Recovery Plan, Third Revision. Portland, Oregon. 62 pp.
[2] California Department of Fish and Game. 2005. California condor population size and distribution. Available at: http://www.dfg.ca.gov/hcpb/species/t_e_spp/tebird/Condor%20Pop%20Stat.pdf
[3] U.S. Fish and Wildlife Service. 2005. Condor population history. Hopper Mountain National Wildlife Refuge Complex. Available at: http://www.fws.gov/hoppermountain/cacondor/Pophistory.html.
[4] Ventana Wildlife Society. 2012. California Condor Recovery Program, Population Size and Distribution updates. Available at: http://www.ventanaws.org/pdf/Status_Reports/2012/Status_Report_February_2012.pdf.
California least tern (Sternula antillarum browni)
| Status: Endangered | Critical habitat: none | Listed: 6/2/1970 | Recovery plan: 6/30/2001 |
Range: CA(b) ---
SUMMARY
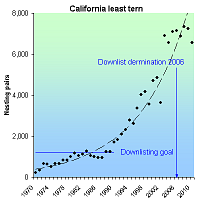
California least tern populations crashed in the late 19th century due to collection by the millinery trade. 20th century declines were driven by development, recreational crowding at beaches, and anthropogenically-exacerbated predation by wildlife. By 1970 when the tern was listed as endangered, just 225 pairs remained. Intensive habitat protection, predator control, and recreation management increased the tern to its overall delisting goal of 1,200 pairs in 1988 and to 6,568 pairs in 2010.
RECOVERY TREND
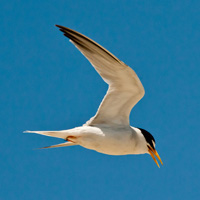
The California least tern (Sterna antillarum browni) nests in colonies on the Pacific coast of California and Baja, Mexico on relatively open beaches where vegetation is limited by tidal scouring [1]. It was formerly found in great abundance from Moss Landing, Monterey County, Calif. to San Jose del Cabo, southern Baja California, Mexico. It declined in the 19th and early 20th centuries due to the millinery trade that hunted birds for their feathers for women's hats, but to a lesser degree than many East Coast birds. The Migratory Bird Treaty Act of 1916 ended the threat, but the least tern plummeted again some decades later due to growing development and recreational pressures that destroyed habitat, disturbed birds, and increased predation by introduced and native species. The construction of the Pacific Coast Highway brought all these threats to much of California's coast. By the 1940s, terns were extirpated from most beaches of Orange and Los Angeles counties and were considered sparse elsewhere. To avoid humans, some tern colonies nest at inland mudflat and dredge fill sites, which appears to make them more susceptible to predation by foxes, raccoons, cats and dogs.
When placed on the endangered species list in 1970, just 225 nesting tern pairs were recorded in California [2]. Protection of nest beaches from development and disturbance, and active predator control programs allowed the species to steadily increase to about 7,100 pairs in California in 2004 [2, 5]. A portion of the increase in the 1970s is attributable to expansion and greater consistency in survey effort, but the greatest increases occurred from 1980 to the present. In 2004, 57 percent of nesting pairs occurred in San Diego County, 26 percent in Los Angeles and Orange counties, 10 percent in Ventura County, 1 percent in San Louis Obispo and Santa Barbara counties, and 6 percent in the San Francisco Bay [3]; the largest sites were at Camp Pendleton (21 percent), U.S. Navy lands at San Diego Bay (16 percent), Los Angeles Harbor, Pier 400 (15 percent), Point Mugu (8 percent), Alameda Point (6 percent), Batiquitos Lagoon Ecological Reserve (6 percent), Huntington State Beach (5 percent), and Tijuana Estuary (5 percent). Since 2005, the population has remained relatively static at about 7,000 pairs. In 2010 there were 6,568 pairs [8,9].
The U.S. Fish and Wildlife Service recovery plan for the California least tern was issued in 1980 and revised in 1985 [1]. Its downlisting and delisting criteria incorporate the total population size, number of colonies, geographic distribution, population viability, and management status. To be downlisted to "threatened" status, the tern must have at least 1,200 breeding pairs distributed in at least 15 "secure" management areas. Each of these management areas must have at least one viable colony. The San Francisco Bay, Mission Bay and San Diego Bay management areas must have at least three, five, and four viable colonies respectively. To be viable, a colony must have at least 20 breeding pairs, a three-year mean reproduction rate of >= 1.0 fledglings/pair, and be fully protected under a long-term management plan. This would require a minimum of 24 viable colonies. To be recovered and delisted, the tern must have at least 1,200 breeding pairs distributed in at least 20 "secure" management areas. Each of these management areas must have at least one viable colony with a mean five-year reproduction rate of >= 1.0 fledglings/pair. The San Francisco Bay, Mission Bay and San Diego Bay management areas must have at least four, six, and six viable colonies respectively. This would require a minimum of 33 viable colonies.
The total population size of 1,200 breeding pairs for downlisting and delisting was reached in 1988 and all subsequent years. The downlisting criterion of 24 colonies was met in 1996 and all subsequent years. The delisting criterion of 33 colonies was met in 2003 and 2004. However, neither the downlisting nor delisting requirements for distribution and viability have been met. While human disturbance has been managed with fencing at most nesting areas, protection from native and non-native predators will require permanent management commitments to ensure continuing viability after the species is recovered and delisted [3].
In 2006, the U.S. Fish and Wildlife Service issued a five-year review recommending the downlisting of the California least tern [5]. It acknowledged that all the downlisting criteria had not been achieved, but asserted that the recovery criteria were out of date. The downlisting recommendation was opposed by the Service biologist who prepared the five-year review [6].
CITATIONS
[1] U.S. Fish and Wildlife Service. 1985. Recovery Plan for the California Least Tern, Sterna Antillarum Browni. U.S. Fish and Wildlife Service, Portland, Oregon. 112pg.
[2] Keane, K. 2005. California least tern monitoring 1969-2004. Spreadsheet provided by Kathy Keene, Keane Biological Consulting, Long Beach, CA on July 25, 2005.
[3] Keane Biological Consulting. 2004. Breeding Biology of the California Least Tern in the Los Angeles Harbor, 2004 Breeding Season. Prepared for the Port of Los Angeles, Environmental Management Division, under contract with the Port of Los Angeles, Agreement No. 2316.
[4] U.S. Fish and Wildlife Service. 2001. Draft revised recovery plan for the California least tern. U.S. Fish and Wildlife Service, Carlsbad, CA.
[5] U.S. Fish and Wildlife Service. 2006. California least tern (Sterna antillarum browni) 5-year review summary and evaluation. U.S. Fish and Wildlife Service, Carlsbad, CA.
[6] Pagel, J. 2006. Letter from Joel Pagel, U.S. Fish and Wildlife Service, to Scott Sobiech, U.S. Fish and Wildlife Service, dated August 23, 2006.
[7] Suckling, K. 2007. Personal observation, Kieran Suckling, Center for Biological Diversity, Tucson, AZ, October 1, 2007.
[8] Keane, K, N. Mudry and S. Langdon. 2011. Status Of The Endangered California Least Tern: Population Trends And Indicators For The Future. Presentation to the Least Tern Working Group annual meeting January 7, 2011.
[9] Marschalek, D. 2011. California Least Tern Breeding Survey 2010 Season. Available online at http://nrm.dfg.ca.gov/FileHandler.ashx?DocumentVersionID=59326, accessed September 13, 2011.
Brown pelican (Western Gulf Coast DPS) (Pelecanus occidentalis (Western Gulf Coast DPS))
| Status: Delisted | Critical habitat: none | Listed: 10/13/1970 | Recovery plan: 6/30/1980 |
Range: LA(b), MS(s), TX(b) ---
SUMMARY
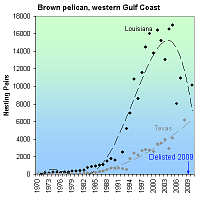
The brown pelican declined due to hunting, habitat loss and reproductive failure from eggshell thinning caused by the pesticide DDT. It continues to be threatened by offshore oil development, rising sea levels and hurricanes. It was listed as endangered in 1970. Nests in Texas increased from eight in 1970 to 6,136 in 2008. In Louisiana nests increased from 25 in 1971 to 17,000 in 2005 before Hurricane Katrina. It declined to 10,114 just prior to the gulf oil spill of 2010.
RECOVERY TREND
The western gulf population of the eastern brown pelican (Pelecanus occidentalis carolinus) occurs along the Gulf of Mexico in Mississippi, Louisiana and Texas. Outside the U.S., it occurs in Veracruz, the Yucatan Peninsula, Belize, the Atlantic and Pacific coasts of Honduras, and the Pacific coast of Costa Rica and Panama [1]. It was listed as an endangered species in 1970, and was delisted in 2009 due to recovery. It remains unseen how the 2010 BP oil spill will affect pelican populations on the Gulf Coast.
Louisiana: The brown pelican is the state bird. It bred in Louisiana in 1961, but then again until 1971 [2]. Birds from Florida were were reintroduced in 1968, 1969, and 1970, and they first bred in 1971 on a shell island in Barataria Bay near Grande Terre [5]. The population then steadily increased to a high of 17,000 nesting pairs in 2005 before Hurricane Katrin struck the Gulf Coast [4]. It declined to 8,036 the following year [4], then increased to 10,114 nests in 2010 just before Deepwater Horizon spill [6].
Texas: Nests increased from eight in 1970 to 6,136 in 2008 [4].
Mississippi: Pelicans roost and feed along the Gulf Coast and coastal islands of Mississippi, but there are no known records of pelicans nesting in the state.
CITATIONS
[1] Shields, M. 2002. Brown Pelican (Pelecanus occidentalis). In The Birds of North America, No. 609 (A. Poole and F. Gill, eds.). The Birds of North America, Inc., Philadelphia, PA.
[2] U.S. Fish and Wildlife Service. 1985. Removal of the brown pelican in the southeastern United States from the list of endangered and threatened wildlife. U.S. Fish and Wildlife Service, February 4, 1985 (50 FR 4938)
[3] National Audubon Society. 2005. Pelecanus occidentalis, Brown Pelican. Website (www.audubon.org/local/latin/bulletin5/featured.html) visited December 30, 2005.
[4] U.S. Fish and Wildlife Service. 2009. Removal of the Brown Pelican (Pelecanus occidentalis) from the Federal List of Endangered and Threatened Wildlife (74 FR 59444).
[5] Shreiber, R.W. and R.W. Risebrough. 1972. Studies of the brown pelican. The Wilson Bulletin 8(2):119-135. Available at http://elibrary.unm.edu/sora/Wilson/v084n02/p0119-p0135.pdf
[6] Louisiana Department of Wildlife and Fisheries. 2010. 2009-2010 Annual Report. Available at http://www.wlf.louisiana.gov/sites/default/files/pdf/publication/33881-2009-2010-annual-report/annual_report_2009-2010.pdf.
Great Lakes piping plover (Charadrius melodus (Great Lakes DPS))
| Status: Endangered | Critical habitat: 7/10/2001 | Listed: 12/11/1985 | Recovery plan: 9/8/2003 |
Range: AL(s), FL(s), GA(s), LA(s), MI(b), MS(s), NC(s), SC(s), TX(s), VA(s), WI(b) --- IL(x), IN(x), MN(x), NY(x), OH(x), PA(x)
SUMMARY
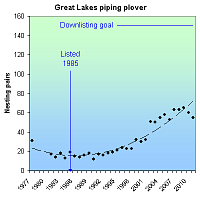
Early declines in Great Lakes piping plover populations were due to hunting, egg collecting and the millinery trade; later declines were the result of development, predation, and human recreation in plover nesting habitat. When the Great Lakes piping plover was listed as endangered in 1985, only 19 pairs remained. It increased to 55 pairs in 2011 and its range had expanded to the south, east and west.
RECOVERY TREND
The Great Lakes piping plover (Charadrius melodus) population breeds and raises its young on sparsely vegetated beaches, cobble pans and sand spits of glacially formed sand dune ecosystems along the Great Lakes shoreline [1].
It formerly nested in Illinois, Indiana, Michigan, Minnesota, New York, Ohio, Pennsylvania, Wisconsin and Ontario. In the late-1800s the population may have been as large as 492 to 682 breeding pairs with 215 in Michigan, 152 to 162 in Ontario, 125 to 130 in Illinois, fewer than 100 in Indiana, Ohio, and Wisconsin and fewer than 30 in Minnesota, New York and Pennsylvania. Hunting, egg collecting and the millinery trade caused a late 19th-early 20th century population crash of many bird species until the Migratory Bird Treaty Act of 1918 put protections in place. How and when the Great Lakes population declined to its precariously small size at the time of listing is unknown [3]. However, conversion of nesting habitat to public recreation and general shoreline development are believed to have been important causes of the decline. By the late 1970s, the plover was essentially extirpated from Illinois, Indiana, New York, Ohio, Pennsylvania and Ontario. It was extirpated from Wisconsin in 1983 and Minnesota in 1986, leaving just a small Michigan population.Impacts (e.g. development, recreation, beach stabilization) on the plover's wintering range also negatively affected birds from coastal North Carolina to Florida and along the Florida Gulf Coast to Texas, Mexico and the Caribbean Islands [4].
When the plover was listed as an endangered species in 1985, just 19 nesting pairs remained, all in Michigan [2]. The population fluctuated between 12 and 19 pairs between 1985 and 1993, then increased steadily to 55 pairs in 2011 [4]. The range expanded to the south, east and west, and plovers recolonized Wisconsin in 1998 at Apostle Islands National Lakeshore, Lake Superior, after being absent since 1983 [1]. The largest nesting congregation is at Sleeping Bear Dunes National Seashore, Mich., which typically supports about 25 percent of the population. The post-1993 increase was facilitated by aggressive management programs that protected nests from predators, nest areas from recreationists, and beaches from development. There is also a small captive rearing program focused exclusively on raising chicks hatched from abandoned eggs.
The 2003 federal recovery plan [1] establishes the following downlisting criteria: 1) a population of at least 150 pairs maintained over five consecutive years, with at least 100 breeding pairs in Michigan and 50 in other Great Lakes states; 2) a five-year average range-wide fecundity of 1.5 to 2.0 fledglings per pair; 3) a 10-year, post-downlisting projection of a stable or growing population. Delisting can occur when these population goals are paired with 1) a determination that genetic diversity is adequate, and 2) development of long-term funding and management agreements to ensure the population is adequately protected in its breeding and wintering range.
Michigan has attained 50 percent of its 100-pair breeding goal for four consecutive years [2]. The five-year average fecundity goal has been met. However, breeding in other Great Lakes states is limited to one to twopairs in Wisconsin.
CITATIONS
[1] U.S. Fish and Wildlife Service. 2003. Recovery Plan for the Great Lakes Piping Plover (Charadrius melodus). Ft. Snelling, Minnesota. viii + 141 pp.
[2] University of Minnesota Great Lakes Piping Plover Research Program. 2006. Summary of Great Lakes piping plover reproductive success 1984-2005. Spreadsheet provided by Francie Cuthbert, University of Minnesota, February 6, 2006.
[3] Cuthbert, F. 2006. Personal communication with Francie Cuthbert, Great Lakes Piping Plover Research Program, University of Minnesota, February 6, 2006.
[4] Cavalieri, V. 2012. Great Lake Piping Plover: Status of the Population and Recovery Program. Presentation presented at Northern Great Plains Piping Plover Workshop, December, 2011. Available at www.fws.gov/northdakotafieldoffice/endspecies/2011%20Northern%20Great%20Plains%20Plover%20papers/CavalieriGreat%20Lakes.pdf.
| Status: Endangered | Critical habitat: none | Listed: 4/11/1984 | Recovery plan: 9/28/1990 |
Range: GU, MP
SUMMARY
The Guam rail is threatened by predation by brown tree snakes, feral cats and other introduced species. It declined catastrophically from 18,000 to less than 100 birds between 1968-1983 as brown tree snakes spread across the island. Only two wild birds were seen after it was listed as endangered in 1984. It was extirpated from the wild in 1985. The captive population grew from 21 birds in 1983 to 158 in 2008. Still extant wild populations were created 1989 (Rota) and 2010 (Guam).
RECOVERY TREND
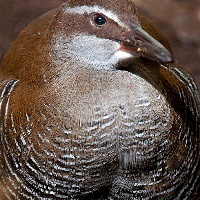
The Guam rail, or ko‘ko‘, (Rallus owstoni) is a flightless bird endemic to the island of Guam, a U.S. territory at the southern end of the Mariana Islands chain. It formerly occurred island-wide in most nonwetland habitats [5].
Though habitat loss, hunting and DDT spraying may have reduced its population level to some degree, the rail was estimated at 80,000 birds in the 1960s [13] and was still common as of 1969 [1]. Thereafter it suffered what may be the most rapid, catastrophic population decline of any U.S. bird species. The decline began in southern Guam in 1971, resulting in its extirpation there in the mid-1970s [1]. In northern Guam the decline began in 1972, resulting in the complete extirpation of the species from the wild by 1986 [1, 5].
Between 1976 and 1982, roadside rail counts declined by 99.8 percent (80.4/100 km to 0.2) [7].
The Guam rail’s rapidly shrinking range mirrors the expanding range of the brown tree snake (Boiga irregularis), a native of Indonesia, New Guinea, the Solomon Islands and northern Australia [18]. It was positively identified on Guam in the 1950s, but may have been seen in the 1940s, and was likely transported from the Admiralty Islands by the U.S. military during a large World War II buildup. The rail disappeared from areas where snake densities reached high levels, until the very last low-snake density area in extreme northwest Guam was overrun in the late 1970s. It was not alone: The brown tree snake had a devastating effect on all of Guam's native forest birds, resulting in all 12 being listed as endangered by the territory in the 1970s and eight of them by the U.S. Fish and Wildlife Service in 1970, 1977 and 1984.
Though extirpated from the south, the Guam rail remained well distributed and fairly common in the north in 1976 and 1978 [14]. By 1981, though, it was reduced to about 2,300 birds, with the largest concentration on Andersen Air Force Base [2, 5]. By 1983, it was confined to two isolated populations totaling fewer than 100 birds: the Northwest Field (a military landing strip not used since 1949) and the flightline of Andersen Air Force Base [3, 5, 8].
By March 1984, rails were extremely rare in the Northwest Field and the flightline population, though the largest remaining, was reduced to 70 acres [4, 5]. The latter was also threatened by a land-clearing proposal, prompting the U.S. Fish and Wildlife Service to emergency-list the Guam rail as an endangered species in April 1984 [9] and finalize the listing in August 1984 [8].
Following its listing, the Guam rail was seen twice in the wild: one bird in 1985 and another in 1986 [5, 16].
CAPTIVE BREEDING AND REINTRODUCTION
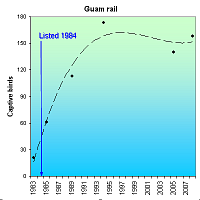
By 1983 the rail’s plight was so dire that a captive-breeding program was initiated by the Fish and Wildlife Service and the Guam Division of Aquatic and Wildlife Resources. Between 1983 and the cessation of captures in 1985 owing to the disappearance of wild birds, 21 rails were brought into captivity [5, 11, 15, 16]. These are the sole founders of all rails in existence today.
Beginning in 1984, captive rails were transferred to mainland facilities [5] and now occur in at least 17 facilities on Guam and the mainland [6, 11]. The first successful reproduction in captivity occurred in 1984 in the Division of Aquatic and Wildlife Resources facility [5].
In 1983 there were 21 birds in captivity [11], in 1985, 61 [5], in 1989, 113 [15], in 1994, 173 [11], in 2005, 140 [12] and in 2008, 158 [6].
GUAM - ANDERSEN AIR FORCE BASE
Guam rails have twice been released on Andersen Air Force Base, but neither effort resulted in a persisting population [6]. In 1998, 16 birds were released in Area 50, a 60-acre zone surrounded by a snake barrier and managed internally with snake trapping. Rails bred in the wild, but their population was extirpated by feral cats and other predators sometime before 2008.
In 2003, 44 rails were released into a snake-reduced zone within the Air Force Munitions Storage Area [6]. Feral cats killed 80 percent of radio-collared birds. Efforts to eliminate the cats were hampered by lack of permission. The population is believed to have been extirpated sometime before 2008 [6].
GUAM - COCOS ISLAND
On November 15, 2010, 16 captive-bred ko‘ko‘ birds were released into the wild on Cocos Island, on lands managed by the Cocos Island Resort and the Guam Department of Parks and Recreation [17]. No brown tree snakes exist on the island. Rats were eradicated prior to the release.
ROTA
Between 1989 and 2008, 918 Guam rails were introduced to the island of Rota [6]. Though Rota is near to, and has essentially the same habitat as, Guam, it is outside the rail’s historic range. The Fish and Wildlife Service very rarely introduces an endangered species outside its historic range, but was driven to do so because of the ubiquitous presence of brown tree snakes throughout Guam and the dominance of feral cats in the few places where snake levels have been reduced. If successful, establishment of wild rails on Rota will help preserve a wild genetic makeup under natural selection pressures and potentially provide a source of wild-born rails for a future Guam reintroduction.
Reproduction in the wild in Rota was first documented in 1995 [6]. In 2007 the population consisted of 60-80 birds in the Duge and Apanon areas. Predation by feral cats, however, is the population's primary cause of mortality, requiring cat control and continued introduction of captive bred birds to maintain the population [6].
[1] Jenkins, J.M. 1979. Natural history of the Guam rail. Condor 81:404-408.
[2] Engbring, J. and F.L. Ramsey. 1984. Distribution and abundance of the forest birds of Guam: Results of a 1981 survey. U.S. Fish Wildlife Service FWS/OBS-84/20.
[3] Aguon, C.F. 1983. Survey and inventory of native land birds on Guam. IN: Guam Division of Aquatic and Wildlife Resources, Annual Report, FY 1983. Department of Agriculture, Guam.
pp 143-157.
[4] Beck, R.E., Jr. 1984. Survey and inventory of native land birds on Guam. IN: Guam Division of Aquatic and Wildlife Resources, Annual Report, FY 1984. Department of Agriculture, Guam.
Pp 139-150.
[5] U.S. Fish and Wildlife Service. 1990. Native Forest Birds of Guam and Rota of the Commonwealth of the Northern Mariana Island Recovery Plan. United States Fish and Wildlife Service, Honolulu, HI. Available at: http://ecos.fws.gov/docs/recovery_plans/1990/900928b.pdf
[6] U.S. Fish and Wildlife Service. 2009. Ko‘ko‘ or Guam Rail (Gallirallus owstoni) 5-Year Review, Summary and Evaluation https://ecos.fws.gov/docs/five_year_review/doc2529.pdf
[7] Aguon, C.F. 1982. Survey and inventory of native land birds on Guam and Northern Marianas Islands. IN: Guam Aquatic Wildlife and Resources Division Annual Report, FY 1982. Department of Agriculture, Guam.
[8] U.S. Fish and Wildlife Service. 1984. Determination of endangered status for seven birds and two bats on Guam and the Northern Mariana Islands. July 27, 1984 (49 FR 33881). http://ecos.fws.gov/docs/federal_register/fr875.pdf
[9] U.S. Fish and Wildlife Service. 1984. Determination of endangered status for the Guam rail. April 11, 1984 (49 FR 14354). http://ecos.fws.gov/docs/federal_register/fr814.pdf
[10] Guam Division of Aquatic and Wildlife Resources. 2012. Guam Rail / Ko‘ko‘. Website http://www.guamdawr.org/learningcenter/factsheets/birds/rail_html. Accessed May 10, 2012.
[11] Haig, S.M., and J.D. Ballou. 1995. Genetic Diversity in Two Avian Species Formerly Endemic to Guam. The American Ornithologists Union. 112(2):445-455.
[12] Guam Division of Aquatic and Wildlife Resources. 2005. Guam Comprehensive Wildlife Conservation Strategy. http://www.guamdawr.org/Conservation/gcwcs2/GuamCWCS%20Chapter3.pdf
[13] Lint, K.C. 1968. A rail of Guam. Zoo Nooz 41:16-17
[14] Pratt, H.D., P.L. Bruner and D.G. Berret. 1979. America's unknown avifauna: The birds of the Mariana Islands. American Birds 33(3):227-235.
[15] Haig, S.M., J.D. Ballou and S.R. Derrickson. 1990. Management options for preserving genetic diversity: Reintroduction of Guam rails to the wild. Conservation Biology 4(3):290-300.
[16] Haig, S. M., Ballou, J. D. and N. J. Casna. (1994) Identification of kin structure among Guam rail founders: A comparison of pedigrees and DNA profiles. Mol. Evol., 3:109-119.
[17] U.S. Fish and Wildlife Service. 2010. Guam Rail / Gallirallus owstoni / Ko‘ko‘. Website: http://www.fws.gov/pacificislands/fauna/guamrail.html. Accessed May 10, 2012.
[18] Enbring, J. and T.H. Fritts. 1988. Demise of an insular avifauna: the brown tree snake on Guam. Transactions of the Western Section of the Wildlife Society 24:31-37.
Hawaiian common moorhen (`alae `ula) (Gallinula chloropus sandvicensis)
| Status: Endangered | Critical habitat: none | Listed: 3/11/1967 | Recovery plan: 10/28/2011 |
Range: HI(b) ---
SUMMARY
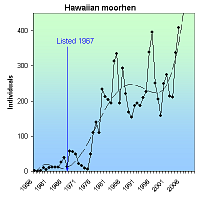
The Hawaiian common moorhen declined due to destruction and degradation of its wetland habitat. Though absolute abundance numbers are not clear, the species growth rate was sharply positive from 1956 through the mid-to-late 1980s, then increased more slowly through 2007.
RECOVERY TREND
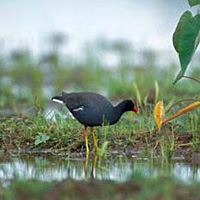
The Hawaiian common moorhen (Gallinula chloropus sandvicensis) was common on the main Hawaiian islands except Lana`I and Kaho`olawe in the late 19th century. By the late 1940s it was described as "precarious," especially on Oahu, Molokai, and Maui [1]. The Molakai population was extirpated after the 1940s, reintroduced in 1982, but did not persist and is currently absent from the island [1]. The spread of aquaculture on Oahu and Kauai in the late 1970's and the 1980's likely benefited the species. Aquaculture projects currently support some of the highest concentrations of moorhens in the state [1].
The population was estimated at no more than 57 in the 1950s and 1960s [2] and about 750 in 1985 (500 on Kauai, 250 on Oahu, and a small number on Molokai) [3], but this may be an underestimate [2]. The accuracy of these estimates is unclear because the species is very secretive and not conducive to standard waterbird census methods. Annual winter waterbird counts between 1956 and 2007, however, show a sharp, statistically significant increase through the mid-to-late 1980s, then a slower increase through 2005 [4].
CITATIONS
[1] U.S. Fish and Wildlife Service. 2005. Draft Revised Recovery Plan for Hawaiian Waterbirds, Second Draft of Second Revision. U.S. Fish and Wildlife Service, Portland, Oregon. 155 pp.
[2] Engilis, A., Jr., and T. K. Pratt. 1993. Status and population trends of Hawaii's native waterbirds, 1977-1987. Wilson Bull. 105:142-158
[3] U.S. Fish and Wildlife Service. 1985. Recovery Plan for the Hawaiian Waterbirds. U.S. Fish and Wildlife Service, Portland, OR.
[4] Reed, J. M., C. S. Elphick, E.N. Leno, and A.F. Zuur. 2011. Long-term population trends of endangered Hawaiian waterbirds. Popul Ecol (2011) 53:473–481.
Hawaiian coot (`alae ke`oke`o) (Fulica alai)
| Status: Endangered | Critical habitat: none | Listed: 10/13/1970 | Recovery plan: 10/28/2011 |
Range: HI(b) ---
SUMMARY
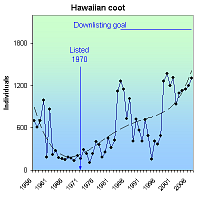
The Hawaiian coot was initially threatened by hunting in the first half of the last century, but is now threatened primarily by loss of habitat. The Hawaiian coot has increased from 1,000 birds on an extinction trajectory in the 1960's to over 2,000 birds today.
RECOVERY TREND
Hawaiian coots (Fulica alai) historically occurred on all of the main Hawaiian Islands except Lana'i and Kaho`olawe, which lacked suitable wetland habitat [1]. They are known to have been most numerous on Kaua'i, Maui and O'ahu, but there are no historical population estimates. The population was low enough in 1939 to warrant establishment of a permanent hunting ban [2]. In the 1950s the coot was considered to be on a trajectory towards extinction. Fewer than 1,000 birds were thought to remain by the late 1960s.
Hunting was a significant threat until outlawed in 1939 [2]. Habitat loss is now the primary cause of endangerment. For example, Ka‘elepulu Pond on O‘ahu, supported nearly 1,000 coots until it was dredged and surrounded by mowed lawns and cement in the 1940s as part of the Enchanted Lake subdivision [2]. The current population is much smaller. Conversely, the species has expanded into unusual habitats such as sewage-treatment plants at Kailua-Kona, Hawaii; Lana‘i City, Lana‘i; and Kuilima, O‘ahu [2].
Biannual surveys indicate short-term population fluctuations associated with rainfall [1]. The 2005 population was estimated at about 2,100 birds with 80 percent of birds on Kaua’i, O'ahu and Maui. All the main Hawaiian Islands except Kaho`olawe are currently occupied. The 2012 Recovery Plan states that based on the most recent data available (2008), populations have recently fluctuated between approximately 1,500 and 2,800 birds and have averaged 2,000 birds [3].
CITATIONS
[1] U.S. Fish and Wildlife Service. 2011. Recovery Plan for Hawaiian Waterbirds, Second Revision. Portland, Oregon. October 28, 2011.
[2] Brisbin, I. L., Jr., H. D. Pratt, and T. B. Mowbray. 2002. American Coot (Fulica americana) and Hawaiian Coot (Fulica alai). In The Birds of North America, No. 697 (A. Poole and F. Gill, eds.). The Birds of North America, Inc., Philadelphia, PA.
[3] Reed, J. M., C. S. Elphick, E.N. Leno, and A.F. Zuur. 2011. Long-term population trends of endangered Hawaiian waterbirds. Popul Ecol (2011) 53:473–481.
Hawaiian duck (koloa maoli) (Anas wyvilliana)
| Status: Endangered | Critical habitat: none | Listed: 3/11/1967 | Recovery plan: 10/28/2011 |
Range: HI(b) ---
SUMMARY
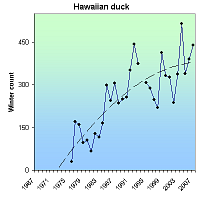
The Hawaiian duck was endangered by hunting, non-native predators, hybridization with domestic ducks, and habitat loss. By 1962, it had been extirpated from all the Hawaiian Islands except Kauai where a few hundred birds remained. In 2002, there were 2,300 birds on Kauai (2,000) and Hawaii (300), and unknown numbers on Oahu and Maui.
RECOVERY TREND
The Hawaiian duck (Anas wyvilliana) breeds in montane streams and feeds and loafs in lowland wetlands. It historically occurred on all the main Hawaiian Islands except Lana`i and Kaho`olawe, which have little surface water.
Suitable stream habitats have declined since humans arrived on the islands some 1,600 years ago [1]. Wetlands may have initially increased due to cultivation of taro and rice, but it unknown how duck populations would have responded to the combination of increased wetlands and efforts to keep them from consuming crops. From the late 19th century to fairly recently, wetlands have steadily declined due to development, changes in agriculture practices, and introduced pigs and goats [1].
Hawaiian ducks were also harmed by human hunting, predation of eggs and chicks by introduced rats, mongooses, dogs, cats, fish and birds. Hybridization with feral mallards that escaped from commercial farms established on Oahu in the 1930s and 1940s continues to threaten the species. Hybridization is also a problem on Kaua`i and Hawaii.
The Hawaiian duck was fairly common in the 19th century, but was rare in many places and generally declining in the early 20th century [3]. By 1949 it was extirpated from Maui and Molokai, rarely seen on Hawaii, and reduced to just 500 birds on Kauai, 30 on Oahu, and possibly some birds on Niihau [1]. By 1962 it occurred only on Kauai [3]. The Kauai population declined significantly between 1956 and 1982 [4]. A State of Hawaii captive breeding program reintroduced the species to the Kohala Mountains on the island of Hawaii from 1958 to 1980, resulting in a current population of about 200 birds that utilize stock ponds, streams and the Hakalau Forest National Wildlife Refuge [1, 3]. Hybridization is occurring in both high- and low-elevation sites [1].
A total of 326 Hawaiian ducks were reintroduced to Oahu by the state between 1968 and 1980 [3]. The introduction site was occupied by feral mallards, and no mallard-control program was initiated. Most of the current population is believed to be hybridized, with suspected pure birds declining and suspected hybrids increasing in recent years [1]. The state introduced 12 Hawaiian ducks to Maui in 1989 and 1990, but did not control existing mallard populations [1, 3]. There are currently 20-50 birds on the island, mostly at Kanaha Pond, and most, if not all, are hybridized [1, 3].
Biannual summer and winters surveys indicate a population increase between 1967 and 2007, with the Kauai population increasing and others declining due to hybridization [1]. The most recent estimate is from 2002 of 2,200 birds on Kauai (2,000) and Hawaii (200) and unknown numbers of pure birds within the 300 Hawaiian duck-like birds on Oahu and 50 on Maui. [3]. The 2011 federal recovery plan concludes that the population is increasing, but the most recent rangewide estimate is still from 2002 [1].
Kauai supports considerably more birds than all other islands combined due to its having few mongooses and very low levels of hybridization [1]. The species occurs year-round on the Hanalei National Wildlife Refuge and nearby taro fields, though most breeding occurs in montane streams [1]. Use of the refuge increased (first as loafing habitat, later as foraging habitat) due to the creation of impoundments in the 1980s and 1990s and modifications in the late 1990s [1]. The species also uses reservoirs, particularly near Lihu`e and on the Mana Plain [1].
CITATIONS
[1] U.S. Fish and Wildlife Service. 2011. Recovery Plan for Hawaiian Waterbirds, Second Revision. U.S. Fish and Wildlife Service, Portland, Oregon.
[2] Engilis, A., Jr. and T.K. Pratt. 1993. Status and population trends of Hawaii’s native waterbirds, 1977-1987. Wilson Bulletin 105:142-158.
[3] Engilis, A., Jr., K.J. Uyehara, and J.G. Giffin. 2002. Hawaiian Duck (Anas wyvilliana). In The Birds of North America, No. 694 (A. Poole and F. Gill, eds.). The Birds of North America, Inc., Philadelphia, PA.
[4] W.E. Banko 1987. Historical synthesis of recent endemic Hawaiian birds. Koloa-Maoli. CPSU/UH Avian history report 12 B-Pt. 1. Univ. of Hawai‘i, Manoa.
Hawaiian goose (Branta sandvicensis)
| Status: Endangered | Critical habitat: none | Listed: 3/11/1967 | Recovery plan: 9/24/2004 |
Range: HI(b) ---
SUMMARY
Once numbering more than 20,000 birds, the Hawaiian goose (or “nene”) was reduced to 30 individuals by 1918 due to overhunting, habitat loss and introduced predators. As a result of captive breeding, reintroductions, predator control and habitat protection, it increased from 400 birds in 1980 to 1,744 in 2006.
RECOVERY TREND
The Hawaiian goose (Branta sandvicensis) or "nene" is Hawaii's state bird. It inhabits shrub and grasslands, and breed and nests on the slopes of volcanoes and some lowland areas [5].
It was once found on most of the larger Hawaiian islands including Kauai, Molokai, Maui and the Big Island and may have numbered in the 20,000s prior to European settlement [1, 3]. As settlers moved onto the islands in the late 1770s, the nene declined due to hunting pressure. The introduction of predatory mongoose in 1883, which preyed on adults, chicks and eggs, further depressed the population [1]. By 1918 only an estimated 30 individuals remained [2].
In the 1950s, captive-breeding programs were initiated in Hawaii and England [2]. These programs eventually released more than 2,300 nenes [2]. In 1967, due to the tenuous state of the remaining population, the nene was listed as an endangered species under the precursor to the Endangered Species Act [4].
Today the Hawaiian goose occurs in the wild on the islands of Hawaii, Maui (reintroduced) and Kauai (reintroduced) [5]. In order to facilitate recovery, the Hawaiian national park system provides supplemental feeding during periodic food shortages [2]. The wild population was estimated at 1,241 individuals in 2004 and 1,744 in 2006 [6].
CITATIONS
[1] The Wildfowl and Wetlands Trust. 2006. Hawaiian Goose General Information. Website <http://www.wwt.org.uk/threatsp/pastwwt/nene.htm> accessed 1/10/06.
[2] National Audubon Society. 2002. Hawaiian Goose. Website <http://audubon2.org/webapp/watchlist/viewSpecies.jsp?id=100> accessed 1/10/06.
[3] NetState. 2006. Hawaii State Bird. Website <http://www.netstate.com/states/symb/birds/hi_nene.htm> accessed 1/10/06.
[4] U. S. Fish and Wildlife Service. Hawaiian Goose (Branta sandvicensis) Species Account. Website <http://ecos.fws.gov/docs/life_histories/B00C.html> accessed 1/15/06.
[5] Honolulu Zoo. 2006. Hawaiian Goose (Nene). Website <http://www.honoluluzoo.org/nene_goose.htm; back from brink> accessed January, 2006.
[6] BirdLife International. 2012. Species factsheet: Branta sandvicensis. Website <http://www.birdlife.org/datazone/speciesfactsheet.php?id=383> accessed 09/02/2012.
Hawaiian stilt (ae`o) (Himantopus mexicanus knudseni)
| Status: Endangered | Critical habitat: none | Listed: 10/13/1970 | Recovery plan: 10/28/2011 |
Range: HI(b) ---
SUMMARY
The Hawiian stilt is threatened by habitat loss, predation, and formerly, hunting. It declined to just 200 birds by 1941. The population increased after listing in 1970 and averaged nearly 1,500 birds from 1998-2007.
RECOVERY TREND
The Hawaiian stilt (Himantopus mexicanus knudseni) prefers to nest on freshly exposed mudflats with low growing vegetation. Nesting may occur in fresh or brackish water and in either natural or manmade ponds.
With the exception of Lanai, Ka-ho‘olawe and possibly Hawai‘i, the stilt historically inhabited all the major Hawaiian Islands [7]. As of 2001, they occur on all the main islands except Ka-ho‘olawe. The largest population occurs on O‘ahu, primarily on the north and windward coast at Kahuku Point on James Campbell National Wildlife Refuge, Kahuku Point oyster ponds, Amorient aquaculture ponds, Roland Pond and at Nuupia Ponds in Kaneohe. Smaller populations exist at Pearl Harbor and along the leeward coast. On Kaua‘i, the subspecies is found in large river valleys such as Hanalei, Wailua and Lumahai, on the Mana Plain, and at reservoirs and sugarcane effluent ponds in Lihue and Waimea. On Maui, the largest groups occur on the Kanaha and Kealia coastal wetlands.
Other populations occur in reservoirs and aquaculture areas. On Molokai, birds occur in south coast wetlands and playa lakes. The species colonized Lanai in 1989 where it occurs in Lanai City's wastewater treatment ponds. On the island of Hawaii, the largest populations occur on the Kona coast from Kawaihai Harbor south to Kailua. It also occurs in the Makalawena and Aimakapa ponds, Cyanotech Ponds and Kona wastewater treatment ponds. Smaller populations occur along the Hamakua Coast and in the Kohala River valleys of Waipio, Waimanu and Pololu. Anchialine ponds along the Kona coast provide prime feeding sites.
While no historic population estimates exist, the Hawaiian stilt was formerly quite common. It declined to 200 birds by 1941 due to habitat loss, predation and human hunting, but climbed to about 1,000 birds by 1949, in response to release from hunting pressure [1]. The 1941 estimate has been questioned by some as being too low due to the much higher 1949 estimate, but modeling indicates the species is capable of explosive growth under good conditions [3].
Winter and summer surveys have been conducted since 1956. A review of trends from 1956 to 1989 [4] showed that summer population estimates were more variable on an island basis and were less reliable than winter counts. The statewide summer population count (excluding Kaua'i/Ni'ihau which were not surveyed until 1975) declined significantly from 1968 to 1979, and then increased significantly from 1980 to 1989. The winter counts showed that the Maui population increased significantly from 1956 to 1989, being relatively stable from 1956 to 1971 then increasing from 1972 to 1989. The Moloka'i population increased significantly from 1968 to 1989. The Hawaii population declined significantly from 1968 to 1976, and then increased significantly from 1977 to 1989. The O'ahu population declined significantly from 1956 to 1968, and then increased significantly from 1969 to 1989. The Kaua'i/Ni'ihau population showed no trend between 1975 and 1989 (but the study had little power to detect a trend due to sample size). The statewide population (excluding the Kaua'i/Ni'ihau population) increased significantly between 1968 and 1989.
The U.S. Fish and Wildlife Service corrected errors in past biannual survey data, concluding that the statewide population has increased significantly since 1976 [7]. The recovery plan calls for a stable or increasing population of at least 2,000 for downlisting and delisting. Based on biannual Hawaiian waterbird surveys from 1998 through 2007, the Hawaiian stilt population averaged 1,484 birds, but fluctuated between approximately 1,100 and 2,100 birds [7].
CITATIONS
[1] Robinson, J. A., J. M. Reed, J. P. Skorupa, and L. W. Oring. 1999. Black-necked Stilt (Himantopus meicanus). In The Birds of North America, No. 449 (A. Poole and F. Gill, eds.). The Birds of North America, Inc., Philadelphia, PA
[3] Reed, J.M, C.E. Elphic, and and L.W. Oring. 1998. Life history and viability analysis of the endangered Hawaiian stilt. Biological Conservation 84:35-45
[4] Reed, M.J. and L.W. Oring. 1993. Long-term population trend of the endangered Ae'o (Hawaiian stilt, Himantopus mexicanus knudseni). Transactions of the Western Section of the Wildlife Society 29:1993(54-60).
[5] Bureau of Sport Fisheries and Hawai`i Department of Land and Natural Resources. 1970. Hawaii’s Endangered Waterbirds. Bureau Sport Fisheries and Wildlife, Department of Interior, and Hawai`i Division of Fish and Game, Department of Land and Natural Resources. Portland, OR.
[6] Shallenberger, R.J. 1977. An ornithological survey of Hawaiian wetlands. U. S. Army Corps of Engineers Contract DACW 84-77-C-0036, Honolulu, HI. 406 pp.
[7] U.S. Fish and Wildlife Service. 2011. Recovery Plan for Hawaiian Waterbirds, Second Revision. Portland, Oregon. October 28, 2011.
[8] Reed, J.M., C.S. Elphick, E.N. Leno, and A.F. Zuur. 2011. Long-term population trends of endangered Hawaiian waterbirds. Popul Ecol (2011) 53:473–481.
Inyo California towhee (Pipilo crissalis eremophilus)
| Status: Threatened | Critical habitat: 8/3/1987 | Listed: 8/3/1987 | Recovery plan: 4/10/1998 |
Range: CA(b) ---
SUMMARY
The Inyo California towhee occurs in a single, arid mountain range in Southern California. Its habitat was degraded by cattle, feral horses, burros, off-road vehicles, campers and hikers. It was listed endangered with critical habitat in 1987. Its population remained between 100-200 birds from 1978-1992, then began increasing in response to habitat protection efforts, reaching 741 in 2007. It reached its 400-bird numeric delisting goal in the mid-1990s. In 2008 it was declared recovered.
RECOVERY TREND
The Inyo California towhee (Pipilo crissalis eremophilus) inhabits the west and east slope of the southern Argus Range (from Wilson Canyon and Indian Joe Canyon northward to Bendire Canyon) at elevations ranging from 2,680 feet to 6,200 feet [2]. Approximately 68 percent of its range is within the China Lake Naval Air Weapons Station (NAWS), 26 percent is administered by the Bureau of Land Management (BLM), 5 percent is administered by the California Department of Game and Fish, and less than 1 percent is privately owned. Within this range, the towhee breeds in relatively small and sometimes isolated patches of dense thickets of willows and desert olive (Forestiera pubescens) along stream sides, springs and seeps [2]. It forages in the adjacent arid uplands.
The primary threat to the towhee has been the destruction of its habitat by cattle, feral horses and burros, off-road vehicles, campers, and hikers [1]. All of these threats have been substantially reduced since the species was placed on the federal endangered species list in 1987. Fire has recently become a localized threat, but the magnitude of its impact is unknown [10].
The Inyo California towhee population is believed to have been relatively stable (100 to 200 birds) between 1978 and 1987 [1, 3, 4] and between 1992 and 1995 (about 200 birds) [1]. A comprehensive 1998 survey located 640 adult birds [5]. Of birds on public lands, 72 percent were on NAWS, 25 percent on BLM, and 2 percent on state lands [2]. A survey of BLM and state lands in 2004 documented 204 adults and estimated a range-wide population of 725 adults [2]. Sites surveyed in 1998 and 2004 increased by an average of 13.6 percent. The increase was attributed in part to a reduction of feral burro and horse numbers [2]. More than 11,600 burros and 2,400 horses have been removed from the Argus and Coso ranges since 1980, improving riparian and upland vegetative conditions [2]. Settlement of a lawsuit brought by the Center for Biological Diversity in 2001 required further reductions of feral equines, off-road vehicles, camping, and other impacts on specific towhee habitats on BLM lands [6]. An August 2005 fire on NAWS impacted some riparian habitat, as did a 2005 flash flood in Mountain Springs Canyon, but the extent of habitat damage its impact on the towhee is not known [10].
While the population increased between 1998 and 2004, the range contracted, probably due to drier conditions reducing the suitability of marginal habitats [2]. The towhee appears to expand into marginal breeding habitats during wet years and contract to core riparian habitats in drier years. The appearance of singing birds in the Panamint Mountains 20 kilometers to the east of the Argus Range suggests the towhee may be colonizing ranges beyond that historically known, and may be capable of recolonizing the Coso Range 20 kilometers to the west as well [2]. Comprehensive surveying of these ranges has been recommended [2].
The U.S. Fish and Wildlife Service recovery plan requires a minimum of 400 birds with a stable population for at least five years before the species can be considered recovered [1]. The towhee appears to have maintained a population of 640 to 725 birds for six years, but the estimate is based on a projection from BLM and state lands to NAWS. If surveys on NAWS confirm the population level, the species should be considered for delisting. Before delisting can occur, however, long-term management agreements must be executed to ensure continuing control of feral equines, off road vehicles, uncontrolled recreation and water diversions. In 2008, the U.S. Fish and Wildlife Service recommended delisting [12].
CITATIONS
[1] U.S. Fish and Wildlife Service. 1998. Recovery plan for the Inyo California towhee (Pipilo crissalis eremophilus). U.S. Fish and Wildlife Service, Portland, OR. 32 pp.
[2] LaBerteaux, D. 2004. Inyo California Towhee (Pipilo crissalis eremophilus) Survey in the Argus Range, Inyo County, California. Prepared for the BLM, Ridgecrest Field Office. 62pp + appendices.
[3] Cord B. and J.R. Jehl, Jr. 1979. Distribution, biology, and status of a relict population of brown towhee. Western Birds 10:131-156
[4] U.S. Fish and Wildlife Service. 1987. Determination of threatened status and critical habitat designation for the Inyo brown towhee. United States Fish and Wildlife Service, Portland, OR, August 3, 1987 (52 FR 28780).
[5] LaBerteaux, D. L., and B. H. Garlinger. 1998. Inyo California Towhee (Pipilo crissalis eremophilus) census in the Argus and Coso Mountain Ranges, Inyo County, California. Prepared for Commanding Officer (83E000D), Naval Air Weapons Station, China Lake, CA. Contract N62474-98-M-3113). 94 pp. + appendices.
[6] CBD v. BLM. 2001. Stipulation and proposed order concerning all further injunctive relief. Settlement in Center for Biological Diversity et al. v. Bureau of Land Management et al., CIV 00-0927 WHA (JCS), approved by the court on March 1, 2001.
[7] NRPI. 1998. Indian Spring Exclosure. The Natural Resource Projects Inventory, reported April 16, 1998, www.ice.ucdavis.edu/nrpi/NRPIDescription.asp?ProjectPK=4460
[8] RRPI. 1998. Christmas Spring Exclosure. The Natural Resource Projects Inventory, reported April 16, 1998, www.ice.ucdavis.edu/nrpi/NRPIDescription.asp?ProjectPK=4463
[9] BLM, U.S. Fish and Wildlife Service, and CDFG. 1999. West Mojave Plan, Draft Evaluation Report, Suggested Conservation Strategies. Bureau of Land Management, U.S. Fish and Wildlife Service, and California Department of Fish and Game, working
draft, September 22, 1999.
[10] LaBerteaux, D. 2005. Personal communication with Denise LaBerteaux, Eremico Biological Services, October 23, 2005
[11] West Mojave Planning Team. 1999. Current management situation of special status species in the West Mojave Planning Area. Bureau of Land Management, U.S. Fish and Wildlife Service, and California Department of Fish and Game.
[12] U.S. Fish and Wildlife Service. 2008. 5 Year Review of the Inyo California Towhee (Pipilo crissalis eremophilus). Portland, OR. 24 pp.
Kirtland's warbler (Dendroica kirtlandii)
| Status: Endangered | Critical habitat: none | Listed: 3/11/1967 | Recovery plan: 6/30/1985 |
Range: FL(m), GA(m), KY(m), MI(b), NC(m), OH(m), PA(m), SC(m), WV(m), WI(b) ---
SUMMARY
Kirtland's warbler declined due to fire suppression suppresse creation of stands of young jack pine, nest parasitism by brown-headed cowbirds, and loss of forest habitat to development and agriculture. It was listed as an endangered species in 1967. In 1971, there were only 201 surviving pairs. In response to habitat protection and restoration, and cowbird control, the population grew steadily to 1,805 pairs in 2011.
RECOVERY TREND
Kirtland's warbler (Dendroica kirtlandii) was described in 1851 and the first nest was discovered in 1903 in northern lower Michigan [1]. Until 1996 all known nests were within 60 miles of this site [1].
Kirtland’s warblers nest in grasses and shrubs below living tree branches in young jack pine forests [1]. This early seral stage habitat was historically maintained by fire [2]. The population size peaked between 1885 and 1900, probably due to the cessation of logging during a period of widespread fire [1]. By 1951, however, the warbler had been reduced to 432 pairs due to fire suppression and nest parasitism by brown-headed cowbirds [1, 3].
Between 1957 and 1962, the U.S. Forest Service and the Michigan Department of Natural Resources created four warbler management areas within state and national forests [1]. The population increased slightly to 502 pairs by 1961, but then declined to its lowest point of 201 pairs in 1971 [2]. During the mid-1970s, some 134,000 acres of jack pine forest in 24 units were designated for Kirtland's warbler management on state and national forests. Additional lands were added in the 1990s and 2000s, bringing the total public land specifically managed for the Kirtland's warbler to more than 180,000 acres [4]. These forests are managed by logging, burning, seeding and replanting on a rotational basis to consistently provide approximately 38,000 acres of productive nesting habitat [1]. In addition, in 1972 the U.S. Fish and Wildlife Service (in cooperation with the U.S. Forest Service, Michigan Department of Natural Resources and the Michigan Audubon Society) initiated a cowbird control program. On average,4,000 cowbirds per year have been removed from Kirtland's warbler breeding areas [1].
The number of territorial males remained at about 200 pairs through 1989, began to increase in 1990, and grew steadily to 1,805 in 2011 [5]. The vast majority of the 2007 territories (1,697) were in Michigan; eight were in Wisconsin, two were in Ontario [2]. Wisconsin was discovered to have been recolonized in 1990 (one singing male) and sporadically thereafter. There was nesting in Wisconsin in 2005 (three nests), 2006 (four nests), and 2007 (eight nests). Ontario was also discovered to have been recolonized in 1990 (one singing male) and sporadically thereafter.
CITATIONS
[1] Michigan Department of Natural Resources. 2006. Kirtland's Warbler (Dendroica kirtlandii). Available at www.michigan.gov/dnr/0,1607,7-153-10370_12145_12202-32591--,00.html
[2] Carlson, E. 2007. Kirtland's warblers by state and county, 1951-2007. Spreadsheet provided by Elaine Carlson, Michigan Department of Natural Resources, August 24, 2007.
[3] Olson, J. A. 2002. Special animal abstract for Dendroica kirtlandii (Kirtland's warbler). Michigan Natural Features Inventory, Lansing, MI. 5 pp.
[4] Carlson, E. 2007. Personal communication with Elaine Carlson, Michigan Department of Natural Resources, August 26, 2007.
[5] Michigan Department of Natural Resources. September 19, 2011. Michigan's Kirtland's Warbler Continues to Exceed Recovery Goal. Available online at http://www.michigan.gov/dnr/0,4570,7-153-10371_10402-262577--,00.html. Accessed September 26, 2011.
Laysan duck (Anas laysanensis)
| Status: Endangered | Critical habitat: none | Listed: 3/11/1967 | Recovery plan: 7/7/2009 |
Range: HI(b) ---
SUMMARY
By the late 19th century, the Laysan duck had disappeared from most of the Hawaiian Islands due to exotic predators, habitat loss and windblown sand. It is currently threatened by disease, tsunamis and storms, drought and small population size. In 1911 only seven adult ducks remained. The population grew to 440-600 by the 1950s as vegetation recovered. Thanks to a reintroduction program in 2004, the population grew to 891 adult birds on two islands in 2010.
RECOVERY TREND
The Laysan duck (Anas laysanensis) formerly occurred throughout the Hawaiian Islands. By the late 19th century it was known only from Laysan Island and Lisianski Island [1]. Today the species survives only on Laysan Island and in a reintroduced population on Midway Atoll National Wildlife Refuge. The cause of its extirpation from the majority of the Hawaiian islands is unknown, but is presumed to have been induced by Polynesian colonizers and the mammalian predators, such as rats, that they brought with them.
The Laysan duck was first reported on Lisianski Island in 1828. Its fortune changed for the worse in 1844 when shipwrecked sailors washed ashore, eating the duck and other native species to survive [1]. Of greater long-term impact, however, was the accidental introduction of mice (Mus musculus) to the island later that year by a rescue ship. A second shipwreck party washed ashore in 1846. By 1857 mice had denuded the island, destroying the duck's habitat. By 1916 the mouse and rabbit population starved to death due to lack of vegetation [1]. Unencumbered by vegetation, windblown sand filled in the island's freshwater springs. The Laysan duck was extirpated from Lisianski some time between 1845 and 1857.
Laysan Island did not experience sustained human disturbance and was not colonized by humans until guano miners occupied it from 1891 to 1904 [5]. Within six months of arriving, they killed 300,000 nesting seabirds for food and sport. Their greatest impact, however, was the introduction of European rabbits (Oryctolagus cuniculus) that thoroughly denuded the island by the 1910s, reducing hiding cover and prey habitat and allowing windblown sand to bury freshwater springs and reduce the size of the island's central hypersaline lake [4]. The extinction of 14 species including the Laysan rail, Laysan honeycreeper and Laysan millerbird have been linked to the rabbit invasion [3]. Laysan was made part of the Hawaiian Islands Bird Reservation in 1909, but was not policed, allowing Japanese feather hunters to scour it in 1909 and 1910, killing Laysan ducks for food and feathers. The species was nearly driven to extinction, being reduced to less than 100 birds in 1902 and just 7 adults in 1911 and 1912 [1]. Rabbit eradication efforts were unsuccessful in 1912 and 1913, but having denuded the island, the species starved to death by 1923 [5]. Laysan duck numbers slowly increased as the vegetation grew back, allowing the species to increase to about 500 birds by 1957 [1].
Intermittent surveys suggest that the species maintained a population of 400-600 birds from 1957 to 2005, with the exception of a dramatic population crash in late 1993 and early 1994 due to sustained drought [1]. The population grew steadily from the 1994 low point back to about 500 birds in 2004 [1]. In 2004, 20 ducks were translocated to Midway Atoll National Wildlife Refuge [2]. The adult population was estimated at 811 in 2009 (Laysan: 611, Midway Atoll: 200) [5] and 891 in 2010 (Laysan: 521, Midway Atoll: 370) [6]. The population may have declined 20 percent to 30 percent in 2011 due to the March 2011 tsunami that overwashed much of both islands, denuding vegetation, contaminating freshwater wetlands with salt water and marine debris, and causing an outbreak of avaian botulism [7].
Prior the 2011 tsunami, the IUCN was considering downlisting the Laysan duck form "critically endangered" to "vulnerable" due to its 2004-2010 population increase [8].
Avian botulism is an important current threat on Midway Atoll, where outbreaks in 2008, 2009, 2010 and 2011 killed hundreds of adults, requiring intervention by the U.S. Fish and Wildlife Service to remove dead birds and rehabilitate infected birds. Tsunamis and storms threaten both low-lying islands, as does drought. The Laysan population may have reached a carrying capacity of about 500 birds [5].
CITATIONS
[1] U.S. Fish and Wildlife Service. 2004. Draft Revised Recovery Plan for the Laysan Duck (Anas laysanensis). U.S. Fish and Wildlife Service, Portland, Oregon. vii + 94 pp.
[2] Klavitter. 2006. Personal communication with John Klavitter, U.S. Fish and Wildlife Service, Midway Atoll National Wildlife Refuge, January 16, 2006.
[3] Center for Biological Diversity. 2005. Database of Extinct, Endangered and Vulnerable Species. Center for Biological Diversity, Tucson, AZ.
[4] Moulton, D. W., and A. P. Marshall. 1996. Laysan Duck (Anas laysanensis). In The Birds of North America, No. 242 (A. Poole and F. Gill, eds.). The Academy of Natural Sciences, Philadelphia, PA, and The American Ornithologists’ Union, Washington, D.C.
[5] U.S. Fish and Wildlife Service. 2009. Revised Recovery Plan for the Laysan Duck (Anas laysanensis). U.S. Fish and Wildlife Service, Portland, Oregon. ix + 114 pp. http://ecos.fws.gov/docs/recovery_plan/090922.pdf
[6] Reynolds, M. 2011. Letter from Michelle Reynolds to IUCN Species Survival Commission, February 21, 2011. http://www.birdlife.org/globally-threatened-bird-forums/wp-content/uploads/2011/06/Anas-laysanensis-Reynolds-Feb11.pdf
[7] Reynolds, M. 2012. Post on Birdlife International website dated January 16, 2012. http://www.birdlife.org/globally-threatened-bird-forums/2011/06/laysan-duck-anas-laysanensis-downlist-to-vulnerable
[8]. BirdLife International. Global Threatened Birds Forum: Laysan Duck (Anas laysanensis): downlist to Vulnerable? http://www.birdlife.org/globally-threatened-bird-forums/2011/06/laysan-duck-anas-laysanensis-downlist-to-vulnerable.
Laysan finch (Telespiza cantans)
| Status: Endangered | Critical habitat: none | Listed: 3/11/1967 | Recovery plan: 10/4/1984 |
Range: HI(b) ---
SUMMARY
The finch is endemic to Laysan Island, Hawaii. It declined precipitously following the introduction of rabbits that denuded the island of vegetation, but increased following rabbit removal. It remains threatened by invasive species and sea-level rise. The Laysan finch was nearly driven to extinction by habitat damage caused by invasive rabbits. At listing in 1967 the total population was estimated at 7,779 birds. The population fluctuates widely, but was estimated at 17,780 birds in 2006.
RECOVERY TREND
The Laysan finch (Telespiza cantans) is a member of the honeycreeper family. Adult males are 7.5 inches long and have a yellow head, breast, and back, a gray neck collar, and whitish belly. The finch is endemic to Laysan Island in the northwest Hawaiian islands. It declined precipitously following the introduction of rabbits to Laysan Island in 1903. A number of endemic birds became extinct when the rabbits destroyed the island’s vegetation. Rabbits were eliminated in 1923, and the Laysan finch slowly began to recover. A population of finches was introduced to Midway Island in 1891, but was wiped out by invasive rats during World War II [1]. The Laysan finch currently exists in two populations in the northwestern Hawaiian islands-- in the natural population on Laysan Island and in a small translocation-founded population at Pearl and Hermes Reef [3].
Finch population censusing began in 1966, and the finch was protected under the Endangered Species Act in 1967. In 1967, the total population was estimated at 7,779 birds, and the population has fluctuated since that time. In 1976 there were 20,802 birds, but in 1978 there was a sharp decline to 6,188 birds. The population increased to 18,274 birds in 1984, but fell to 5,201 birds in 1988. The 2004 population was estimated at 9,393 birds [2]. The most recent population estimate from 2006 is 17,780 birds [3].
A population of 108 birds was introduced to the four islets of Pearl and Hermes Atoll in 1967 [1, 2]. This population has also fluctuated significantly, with three of the islet subpopulations dying out at least once. Although the population has a positive population trend, it is unstable and will always remain small due to the carrying capacity of the islets. The 2004 population at Pearl and Hermes was estimated at 329 birds, down from 1,105 birds in 2002 [3].
The population on Laysan Island is threatened by habitat loss due to sea-level rise caused by global climate change. The spread of the invasive plant Verbesina encelioides at Pearl and Hermes Reef has led to the near-complete loss of native vegetation on Southeast Island, which harbors the largest population of Laysan finches. The birds nest and forage in habitat dominated by V. encelioides during its summer growing season, but when this annual plant dies back for the winter, the finches are left with little or no food resources; population modeling experiments indicate that this habitat degradation substantially increases the extinction risk for the Pearl and Hermes population [3].
Efforts currently are under way to evaluate potential future translocation sites for this species [3].
CITATIONS
[1] Morin, M. P. and S. Conant. 2002. Laysan Finch (Telespiza cantans) and Nihoa Finch (Telespiza ultima). In The Birds of North America, No. 639 (A. Poole and F. Gill, eds.). The Birds of North America, Inc., Philadelphia, PA.
[2] Freifeld, H. 2005. Laysan finch popuation status, 1966-2005. Data provided by Holly Freifeld, U.S. Fish & Wildlife Service, Honolulu, HI, September 23, 2005.
[3] U.S. Fish and Wildlife Service. 2008. Laysan finch (honeycreeper) (Telespiza cantans) 5-Year Review: Summary and Evaluation. Pacific Islands Fish and Wildlife Office. 13 pp.
Least Bell's vireo (Vireo bellii pusillus)
| Status: Endangered | Critical habitat: 2/2/1994 | Listed: 5/2/1986 | Recovery plan: 5/6/1998 |
Range: CA(b) ---
SUMMARY
Once one of California's most abundant birds, the least Bell’s vireo declined drastically due to habitat loss and brood parasitism by the brown-headed cowbird. It remains threatened by cowbirds, invasive plants, agriculture and grazing. Since listing and critical habitat designation, there has been an increase from 300 pairs of birds in 1986 to 2,500 pairs of birds in 2006. The number of territories has increased tenfold from 291 in 1986 to 2,968 known territories in 2006.
RECOVERY TREND
The least bell’s vireo (Vireo bellii pusillus) was formerly abundant in the riparian woodlands of California's Central Valley and low elevation riparian streams in Southern California and northern Baja, Mexico [1]. It was one of California's most abundant birds in the late 19th and early 20th centuries, but was reduced to just 300 pairs by 1986. The decline was driven by the separate and combined effects of habitat loss and brood parasitism by the invasive brown-headed cowbird (Molothrus ater). It was listed as an endangered species by the state of California in 1980 and the U.S. Fish and Wildlife Service in 1986 [2]. Similar declines occurred in Baja, Mexico, but were not as well documented. The population and habitat extent in Mexico was much smaller historically and currently than in California.
Due to intensive habitat protection and restoration and cowbird control, the California vireo population increased dramatically from 300 estimated pairs in 1986 [1] to 2,500 in 2004 [9]. In 1994, 38,000 acres of critical habitat were designated in 10 areas stretching from Santa Barbara to San Diego County [8]. The proposal of critical habitat on the U.S. Marine Corps’ Camp Pendleton in 1986 spurred the development of a memorandum of understanding between the military and the U.S. Fish and Wildlife Service to remove exotic plants, trap cowbirds, research and monitor the species, and take other conservation measures [1].
Territorial males in the Prado Basin steadily increased from 19 to at least 600 between 1986 and 2005 [6, 10]. The Santa Ana River watershed (including the Prado Basin) supported at least 988 territorial males in 2005 [10]. Storm damage limited the 2005 survey effort, so the reported numbers are somewhat less than the actual. The Anza Borrego State Park population increased steadily from 32 territorial males in 1986 to 109 in 2005 [3, 4, 5]. The Camp Pendleton population increased from 100 males in 1986 to 827 in 2005, but declined from its 1998 peak of 1,010. A 16-kilometer stretch of the San Luis Rey River increased its population from 24 to 114 between 1986 and 2004, but declined from its 1999 peak of 132 [9]. A population within 5 kilometers of the San Diego River increased from 21 males in 1986 to 33 in 1996 [9]. The Tijuana River population increased from 13 to 142 between 1990 and 1996 [1].
As the population has increased, the occupied range has expanded eastward and northward [1]. In 2005, the vireo appeared on the San Joaquin River National Wildlife Refuge in the Central Valley where it had been absent for 60 years.
Though significant habitat protection and restoration programs have been instituted since 1986, much of the population increase is due to aggressive cowbird trapping funded by mitigation requirements of Endangered Species Act consultations [1, 9]. Several of these populations (e.g. Camp Pendleton, San Luis Rey River, and San Diego River) increased rapidly then leveled off d, suggesting that they may now be primarily limited by habitat condition and extent [9].
From its listing in 1986 to 2006, the population increased 10-fold from 291 to 2,968 known territories [11], leading to a recommendation in the 2006 Five-Year Review to downlist the species. The population has grown during each five-year period since the original listing, although the rate of increase slowed from 1996 to 2006. Riverside County has seen a 2,997-percent increase, and San Diego County has seen a 621-percent increase. Lesser but significant increases have also been seen in Orange, Ventura, San Bernardino and Los Angeles counties. Only the population in Santa Barbara County has declined since listing [11].
At the time of listing, loss of habitat due to agricultural practices, urbanization and exotic plant invasion were identified as major threats to vireo populations. Since the listing of the vireo, destruction and modification of riparian habitat within its current range has been curtailed significantly, primarily as a consequence of protections provided by listing and critical habitat designation. Agriculture, grazing and invasive plants continue to threaten riparian habitat within the larger historic range [11].
The draft 1998 federal recovery plan allows for downlisting to "threatened" status when 11 named river basins have stable or improving populations of at least "several hundred" breeding pairs for five years [1]. Delisting can occur when three additional specific river basins have populations of several hundred breeding pairs each and either all 14 river basin populations are self-sustaining or endowments are established to permanently protect them from cowbirds and exotic plant encroachment. The downlisting criteria would require the existence of approximately 3,300 pairs. The delisting criteria would require about 4,200 pairs.
The ongoing recovery of the species is dependent on continuing management of cowbirds and invasive plants and prevention of further habitat loss to development [11].
CITATIONS
[1] U.S. Fish and Wildlife Service. 1998. Draft Recovery Plan for the Least Bell’s Vireo. U.S. Fish and Wildlife Service, Portland, OR. 139 pp.
[2] U.S. Fish and Wildlife Service. 1986. Determination of Endangered Status for the Least Bell’s Vireo. U.S. Fish and Wildlife Service. May 2, 1986 (51 FR 16474).
[3] Kus, B. 2001. Least Bell’s Vireo Surveys and Nest Monitoring at Anza Borrego Desert State Park in 2000: Final Report. U.S. Geological Survey, Western Ecological Research Center, San Diego Field Station.
[4] Joregensen, P. 2005. Bell’s vireo population survey and cowbird trapping report for Anza-Borrego Desert State Park (Vireo bellii pusillus) and Picacho State Recreation Area (Vireo bellii pusillus) for the 2004 Breeding Season. California State Parks, Colorado Desert District, Borrego Springs, CA.
[5] Jorgensen, P. 2005. Personal communication with Paul Jorgenson, California State Parks, Colorado Desert District, November 7, 2005.
[6] Pike, J., D. Pellegrini, L. Hays, and R. Zembal. 2005. Least Bell's Vireos and Southwestern Willow Flycatchers in the Prado Basin of the Santa Ana River Watershed, CA. Unpublished report prepared by the Orange County Water District and U.S. Fish and Wildlife Service.
[7] Kus, B. 2006. Least bell's vireo population trend at Camp Pendleton, 1981-2005. Spreadsheet provided by Barbara Kus, USGS Western Ecological Research Center, San Diego, CA, January 12, 2006.
[8] U.S. Fish and Wildlife Service. 1994. Designation of critical habitat for least Bell's vireo. U.S. Fish and Wildlife Service, February 2, 1994 (59 FR 4845).
[9] Kus, B.E. and M.J. Whitfield. 2005. Parasitism, productivity, and population growth: response of least Bell's vireos (Vireo bellii extimus) and southwestern willow flycatchers (Empidonax traillii extimus) to cowbird (Molothrus spp.) control. Ornithological Monographs 57:16-27.
[10] Hays, L. 2006. Personal communication with Loren Hays, U.S. Fish and Wildlife Service, Carlsbad, CA, January 17, 2006.
[11] U.S. Fish and Wildlife Service. 2006. Least Bell’s Vireo (Vireo bellii pusillus) 5-Year Review Summary and Evaluation. Carlsbad Fish and Wildlife Office. 27 pp.
Light-footed clapper rail (U.S. DPS) (Rallus longirostris levipes)
| Status: Endangered | Critical habitat: none | Listed: 10/13/1970 | Recovery plan: 6/24/1985 |
Range: CA(b) ---
SUMMARY
Declines in light-footed clapper rail populations were caused by the loss of salt marshes and wetlands. The rail remains threatened by predation, small population size, climate change, severe weather events, poor habitat quality and automobile strikes. The U.S population has fluctuated since listing in 1970, but shows a clearly increasing trend going from 203 pairs of birds in 11 marshes in 1980 to 376 pairs in 19 marshes in 2010.
RECOVERY TREND
The light-footed clapper rail (Rallus longirostris levipes) is found exclusively in salt marshes between Santa Barbara, Calif. and San Quintin Bay, Baja California, Mexico. Nesting occurs primarily in dense cordgrass, wrack deposits and in hummocks of high marsh within the low marsh zone [1]. Due to loss and degradation of salt marshes, the overall acreage and suitability of wetlands for the light-footed clapper rail has declined. The species was listed as endangered in 1970.
The California population of light-footed clapper rails has fluctuated between 1980 and 2010, but shows a clearly improving trend from 203 pairs in 11 marshes in 1980 to a high of 443 pairs in 2007, dropping some to 376 pairs in 19 marshes in 2010 [2, 3, 5, 6]. A captive breeding program initiated by the Chula Vista Nature Center, SeaWorld San Diego, the U.S. Fish and Wildlife Service and several independent biologists released more than 200 chicks between 2001 and 2008 [4].
Since 1980, the lowest number of pairs detected was 142 in 1985. The highest number of pairs detected was 443 in 2007 when 19 marshes were censused. Of these 19 marshes, eight had almost 92 percent of the total light-footed clapper rail pairs counted in 2007. These marshes include, from north to south; Mugu Lagoon, Seal Beach National Wildlife Refuge, Upper Newport Bay, Batiquitos Lagoon, San Elijo Lagoon, San Dieguito Lagoon, Los Penasquitos Lagoon, and Tijuana Slough National Wildlife Refuge. Of these, Upper Newport Bay and Tijuana Slough NWR together represent 69 percent of the total pairs counted in 2007 [5].
The Upper Newport Bay population of light-footed clapper rails has been the largest since the statewide census began in 1980, and likely has been for decades. It has typically consisted of 100 pairs of rails or more and has recovered the few times that it dropped below this threshold. In contrast, the second and third largest populations at Seal Beach NWR and Tijuana Slough NWR have been dramatically affected by major environmental perturbations. These larger populations have subsequently rebounded, but only after many years of intensive management. Each of the smaller populations is under constant threat of extirpation because of the extremely small population sizes [5].
Following the 2007 high of 443 pairs, the largest populations declined in 2008 due to severe weather events, but these populations were rebounding as of 2010. The 2010 count of 376 pairs is the third-highest count on record and is a 17.5 percent increase over the breeding population detected in 2009. In 2010 Upper Newport Bay remained the largest population with 131 pairs. Tijuana Slough NWR did not recover significantly in 2010 toward the record high level of 142 pairs in 2007 but did increase from 2009 by 33 percent to 76 breeding pairs in 2010 [6].
Thirteen of the small subpopulations increased in size from 2009 to 2010, increasing by a combined total of 59 breeding pairs in 2010. The subpopulation in Batiquitos Lagoon reached a new high total of 36 breeding pairs. Point Mugu increased by 33 percent to 12 pairs and the Seal Beach tally was up slightly to 25 pairs. San Elijo Lagoon reached its all-time high count of 15 breeding pairs in 2006 and again in 2010 and the U.C. Kendall-Frost Reserve held strong at 10 pairs. Excluding the two largest subpopulations, there were six subpopulations in double figures, ranging from 10 to 36 pairs and totaling 126 breeding pairs, or 33.5 percent of the state total. The remaining 11 subpopulations ranged from one to nine pairs and totaled 43 breeding pairs of clapper rails, or 11.4 percent of the total [6].
Restoration and management are contributing to the recovery of the rail, but the species remains vulnerable to weather fluctuations, predation, climate change, poor habitat quality and automobile strikes.
CITATIONS
[1] U.S. Fish and Wildlife Service. Light-footed clapper rail Life History. http://ecos.fws.gov/docs/life_histories/B04B.html
[2] Zembal, R., S.M. Hoffman, and J.R. Bradley. 1997. Light-footed clapper rail management and population assessement, 1996. Bird and Mammal Conservation Program Report, 97-08. Final Report to the California Department of Fish and Game, Sacramento, CA.
[3] Hayes, L. 2005. Light-footed clapper rail nesting data, 1997-2004. Data provided by Loren Hayes, U.S. Fish and Wildlife Service, Carlsbad, CA, August 1, 2004.
[4] U.S. Fish and Wildlife Service. 2008. Journal Entry. CARLSBAD FWO: U.S. Fish and Wildlife Service Journal Entry: Light-footed Clapper Rail Breeding Program Success is Something to Cheer About, August 22, 2008, http://www.fws.gov/FWSJournal/regmap.cfm?arskey=24778
[5] U.S. Fish and Wildlife Service. 2009. Light-footed clapper rail (Rallus longirostris levipes) 5-Year Review: Summary and Evaluation. Carlsbad Fish and Wildlife Office. 26 pp. http://ecos.fws.gov/docs/five_year_review/doc2573.pdf
[6] California Department of Fish and Game. 2010. Status and Distribution of the Light-footed Clapper Rail in California 2010 Season. Available at:
http://kerineal.com/clapperrail.com/joomla/images/stories/resources/2010CRR.pdf
[7]The Clapper Rail Study Team. 2011. Website: http://www.clapperrail.com/clapperrail.com/joomla/.
Mississippi Sandhill crane (Grus canadensis pulla)
| Status: Endangered | Critical habitat: 6/30/1975 | Listed: 6/4/1973 | Recovery plan: 9/6/1991 |
Range: MS(b) --- AL(x), FL(x), GA(x), LA(x), TX(x)
SUMMARY
Less than 2 percent of the Mississippi sandhill crane's wet pine savanna habitat remains. It was to a single population of 40 birds in 1973, threatened by habitat loss, predation, isolation, harassment, contaminants and hurricanes. The release of captive-bred sandhill cranes began in 1981, and the wild population increased from 33 birds in 1989 to 135 birds in 1993. The population has remained relatively steady due to ongoing captive augmentation with 110 birds in 2009 and 2011.
RECOVERY TREND
The Mississippi sandhill crane (Grus canadensis pulla) historically consisted of a Georgia/Florida population and a separate population along the Gulf Coastal Plain of Texas, Louisiana, Mississippi and Alabama [1]. It was so plentiful in southern Louisiana in the late 1880s that it was considered a farm pest. It was extirpated from Louisiana by the 1910s and from Alabama by the 1960s. It is currently found only on the 7,813-hectare Mississippi Sandhill Crane National Wildlife Refuge in southern Jackson County, Miss.
By 1929, the Mississippi sandhill crane population was about 75 birds [2]. When placed on the endangered species list in 1973, about 40 birds remained. In 1975 critical habitat was designated and the 7,813-hectare Mississippi Sandhill Crane Wildlife Refuge was established. The first federal recovery plan was completed in 1976. The U.S. Geological Survey’s Patuxent Wildlife Research Center began releasing captive-raised birds into the wild flock in 1981 [4]. The wild population increased steadily from 33 birds in 1989 to 135 birds in 1993 [2]. Despite extensive damage to the refuge, the species survived Hurricane Katrina with minimal short-term mortality [3]. In 2009 there were about 110 individuals, including about 20 to 25 breeding pairs [5].
The crane's remaining habitat has been divided and subdivided and now consists only of small islands surrounded by human-altered landscapes. Cranes have also been directly harassed, shot, and may suffer the effects of environmental contaminants [5]. There are ongoing problems with natural recruitment due primarily to nest predation, but the population remains stable at 105 to 120 birds per year due to augmentation with captive-reared cranes [6].
Without Endangered Species Act protection and the creation of the Mississippi Sandhill Crane National Wildlife Refuge, this subspecies would very likely have been lost to extinction. Only two percent of wet pine savanna habitat remains, and the remnant survives in large part due to the creation of the crane refuge.
CITATIONS
[1] U.S. Fish and Wildlife Service. 1991. Mississippi Sandhill Crane Recovery Plan. U.S, Fish and Wildlife Service, Atlanta, Georgia. 42pg.
[2] Gee, G.F. and S.G. Hereford. Mississippi Sandhill Cranes. U.S. Geological Service website (http://biology.usgs.gov/s+t/noframe/b157.htm) visited December 28, 2005.
[3] Hereford, S.G. 2005. Personal communication with Scott Hereford, Senior Wildlife Biologist, Mississippi Sandhill Crane National Wildlife Refuge, December 2005.
[4] Noyes, S. 2005. Mississippi Sandhill Crane and PWRC. Volunteers - Friends. Friends of Patuxent 16(9).
[5] U.S. Fish and Wildlife Service. 2009. Mississippi Sandhill Cranes webpage. http://www.fws.gov/mississippisandhillcrane/mssandhillcranes.html
[6] Hereford, S. 2011. Personal Communication between Scott Hereford, Senior Wildlife Biologist, Mississippi Sandhill Crane National Wildlife Refuge, and Tierra Curry. September 15, 2011.
Northern Aplomado falcon (Falco femoralis septentrionalis)
| Status: Endangered | Critical habitat: none | Listed: 2/25/1986 | Recovery plan: 6/8/1990 |
Range: AZ, NM, TX
SUMMARY
Aplomado falcons are threatened by widespread habitat encroachment resulting from control of range fires, intense overgrazing, agricultural development, channelization of desert streams, pesticide exposure and predation. The falcon was completely extirpated from the United States by 1960. In 2011 there were 79 falcons in the reintroduced population in south Texas; there are also experimental populations in west Texas and southern New Mexico.
RECOVERY TREND
The Aplomado falcon is a species found in both North and South America in two disjunct populations. As a whole this species is not deemed at risk due to the large range and total global population, which is estimated at 500,000 birds [5]. The two southern subspecies range across South America, with the exception of the Amazon basin. The falcon also occurs on Trinidad [5].
The disjunct northern subspecies of the Aplomado falcon was found historically in the United States throughout southeast Arizona and southern New Mexico, the Trans-Pecos region of Texas, and along the Rio Grande into southern Texas [1]. Aplomado falcon habitat includes coastal prairies, savannas and desert grasslands. Its historical range extended through the Chihuahuan Desert of Mexico throughout the state of Chihuahua, along the entire Gulf Coast of Mexico, south to the Northern Yucatan and into Chiapas, and along the Pacific slope of Central America north of Nicaragua [1]. The last U.S. specimen was taken in 1949. Site reports of this species continued in south Texas into the 1950s [1]. The Northern Aplomado falcon was completely extirpated from its U.S. range by 1960 and has also been extirpated from much of its range in Mexico and Central America [1]. The population in Mexico has been reduced to two breeding areas, one along the eastern coastal savannas of the Gulf Coast from southern Tamaulipas southward, and the other in the Tarabillas Valley of Chihuahua. In the Tarabillas Valley it is nearly extirpated due to the conversion of grassland habitat to grow crops by the growing number of Mennonite farms in the area. The Tarabillas Valley population stood at 18 birds as of 2011 [4].
The northern Aplomado falcon was listed as endangered in 1986, and the U.S. Fish and Wildlife Service began working alongside the Peregrine Fund, which had already begun a captive-breeding and release program in south Texas in the early 1980s [1,2]. Eighteen falcons were successfully released onto the Laguna Atascosa National Wildlife Refuge, Texas, between 1986 and 1989 [2]. Large-scale releases of captive-bred Aplomado falcons into the wild began in 1993 in south Texas. The release program was expanded to the Chihuahuan Desert region of west Texas in 2002 and to New Mexico in 2006 [2]. More than 1,142 captive-bred falcons have been released in Texas [2].
Reintroduced falcons have successfully fledged more than 244 young since 1995 [2]. Predation by great horned owls, raccoons and coyotes is significant, affecting more than half of all nesting attempts [2]. Nesting productivity increased by approximately 40 percent in 2003 and 2004, when falcons were provided artificial nesting structures with barred sides arranged so that falcons can enter the nest while predators cannot [2].
More than 2 million acres of suitable habitat for falcon restoration exist in New Mexico, which could support up to 200 pairs of falcon [2]. Some threats facing the falcon show signs of abatement. The intense overgrazing that resulted in shrub encroachment in Chihuahuan Desert grasslands in New Mexico and Arizona has moderated, and there has been widespread implementation of improved range-management techniques [2]. In addition, the use of DDT was banned in Mexico in 2000 [2].
A 2011 survey of the reintroduced population of Aplomado falcons in south Texas recorded a count of 79 birds occupying 34 of 44 territories surveyed [2]. In 2010 the reintroduction program in the Chihuahuan Desert of New Mexico and west Texas saw the release of 107 young Aplomado falcons at five sites in New Mexico and three sites in west Texas, with 75 falcons reaching independence [2]. In a 2009 survey of this region, 10 breeding pairs were found, although a 2010 survey saw a loss of eight of these pairs [2]. While the Chihuahuan Desert population is still very much in the experimental phase, the south Texas population seems to be self-sustaining and continues to thrive [2]. The captive-breeding program continues to be successful [2].
CITATIONS
[1] U.S. Fish & Wildlife. 1990. Aplomado Falcon Recovery Plan
[2] Peregrine Fund Website http://www.peregrinefund.org/aplomado viewed on 10/21/2011
[3] U.S. Fish and Wildlife Service. 2007. Aplomado Falcon Fact Sheet. Website http://www.fws.gov/endangered/esa-library/pdf/aplomado_falcon_fact_sheet.pdf
[4] Susan Cosier.2011.An Unforseen Foe.Audubon Magazine.Website http://archive.audubonmagazine.org/features0801/endangeredSpecies-webExclusives.html viewed on 10/21/2011
[5] Website http://identify.whatbird.com/obj/447/_/Aplomado_Falcon.aspx viewed on 10/21/2011
[6] Peregrine Fund Website http://blogs.peregrinefund.org/project/1 viewed on 10/21/2011
[7] Texas Parks and Wildlife Website http://www.tpwd.state.tx.us/huntwild/wild/species/aplomfal/ viewed on 10/21/2011.
Northern Great Plains piping plover (Charadrius melodus (Northern Great Plains DPS))
| Status: Threatened | Critical habitat: 9/11/2002 | Listed: 12/11/1985 | Recovery plan: 5/18/1999 |
Range: MT, ND, SD, NE, KS, CO, MN, IA, OK; SC, GA, FL, AL, MS, LA, TX, PR
SUMMARY
The Northern Great Plains piping plover was listed as endangered in 1986 due to threats from habitat loss, predation and disturbance. The number of Northern Great Plains piping plovers in the United States has increased from about 1,000 adults when ti was listed as an endangered species in 1985 to 2,959 adults in 2006.
RECOVERY TREND
In the Northern Great Plains, most piping plovers (Charadrius melodus) nest on the unvegetated shorelines of alkali lakes, reservoirs or river sandbars. The Northern Great Plains population is geographically widespread, with many birds in very remote places, especially in the U.S. and Canadian alkali lakes region, making population monitoring difficult.
The International Piping Plover Census is conducted every five years. The census found that the U.S. portion of the Northern Great Plains piping plover population decreased between 1991 and 1996, then increased in 2001 and again in 2006. In the United States in 1991, there were 2,023 adults and 891 breeding pairs. In 2006, there were 2,959 adults and 1,212 breeding pairs. The population of plovers in Canada increased in 1996, decreased in 2001, and then increased again in 2006. Overall, the number of Great Plains piping plovers has increased from approximately 3,500 birds in 1991 to approximately 4,600 birds in 2006 [1].
The recovery goal in the 1988 recovery plan is for 1,300 pairs in the Northern Great Plains that remain stable for 15 years including 60 pairs in Montana, 650 pairs in North Dakota, 350 pairs in South Dakota, 465 pairs in Nebraska, and 25 pairs in Minnesota [2].
The number of piping plover pairs in Montana increased from fewer than 20 pairs in 1986 to more than 100 pairs in 1992, then fluctuated around 60 pairs from 1994 to 2008. The number of pairs in North Dakota has fluctuated, but increased from around 300 pairs in 1986 to nearly 800 pairs in 2008. The number of pairs in South Dakota increased from around 100 pairs in 1986 to around 250 pairs in 2008. The number of pairs in Nebraska increased from around 100 pairs in 1986 to around 400 pairs in 2008. In Minnesota in 1986, there were approximately 11 plover pairs, but from 2002 to 2008 there were only one to two pairs. A few piping plover pairs are also found in Colorado, Kansas and Iowa. From 1990 to 2008, there were two to 18 pairs in Colorado, two to four pairs in Kansas, and four to seven pairs in Iowa [1].
Modeling strongly suggests that the piping plover population is very sensitive to adult and juvenile survival [1]. Therefore, while there is a great deal of effort extended to improve breeding success, to improve and maintain a higher population over time, it is also necessary to ensure that the wintering habitat, where birds spend most of their time, is secure. While the population increase seen in recent years demonstrates the possibility that the population can rebound from low population numbers, ongoing efforts are needed to maintain and increase the population. In the U.S., piping plover crews attempt to locate most piping plover nests and take steps to improve their success. This work has suffered from insufficient and unstable funding in most areas. In addition to habitat loss, human disturbance, and predation, emerging threats, such as energy development (particularly wind, oil and gas and associated infrastructure) and climate change are likely to impact piping plovers both on the breeding and wintering grounds [1].
CITATIONS
[1] U.S. Fish and Wildlife Service. 2009. Piping Plover (Charadrius melodus) 5-Year Review: Summary and Evaluation. 214 pp.
[2] U.S. Fish and Wildlife Service. 1988. Great Lakes and Northern Great Plains Piping Plover Recovery Plan. 170 pp.
Palau fantail (Rhipidura lepida)
| Status: Delisted | Critical habitat: none | Listed: 6/2/1970 | Recovery plan: none |
Range: PL(b) ---
SUMMARY
The Palau fantail was virtually eliminated by damage caused by World War II. It was protected under the Endangered Species Act in 1970, and threats to the species were largely abated. In 2011 it is considered to be a species of least conservation concern. The species rebounded following near extirpation. Surveys conducted from 1976-1979 found it to be common, and it was delisted in 1985. It is now abundant to common on most Palau islands. As of 2011, the population is thought to be increasing.
RECOVERY TREND
The Palau fantail (Rhipidura lepida) is one of three Palau bird species that were virtually eliminated by damage caused to the Palau Islands (formerly a U.S.-administered United Nations Trust Territory now under an independent constitutional government) during WWII [1]. Surveys conducted from 1976 to 1979 found the fantail to be one of the more common birds in forests throughout the Palau Islands and categorized the species as abundant on Pelelui Island where previously it had been considered scarce [2]. The authors of this survey suggested that the Palau fantail was no longer endangered [2]. The U.S. Fish and Wildlife Service removed the Palau fantail, along with the Palau ground dove and the Palau owl, from the endangered species list in 1985 [1].
The global population size has not been quantified, but the species is described as abundant on Peleliu, and common on most other islands although uncommon on Koror [3]. As of 2011, the population is thought to be increasing [3].
CITATIONS
[1] Noecker R.J. 1998. Congressional Research Service, Report for Congress: Endangered Species List Revisions: A Summary of Delisting and Downlisting. Made available by National Council for Science and the Environment. Washington D.C.
[2] Pratt H.D., J. Engbring, P.L. Bruner, and D.G. Berrett. 1980. 1976-1979 Notes on the taxonomy, natural history, and status of the resident birds of Palau. Condor 82(2): 117-131.
[3] BirdLife International. 2011. Species factsheet: Rhipidura lepida. http://www.birdlife.org/datazone/speciesfactsheet.php?id=6017.
Palau ground dove (Gallicolumba canifrons)
| Status: Delisted | Critical habitat: none | Listed: 6/2/1970 | Recovery plan: none |
Range: PL(b) ---
SUMMARY
The Palau ground dove was virtually eliminated by damage caused to the island during World War II. The primary potential threat to the species today is the potential introduction of alien species such as rats or brown tree snakes. Although populations had been decimated, surveys conducted from 1976-1979 observed Palau ground doves on all major limestone islands. In 1991 the population was estimated at 500. As of 2011 it is thought to remain stable.
RECOVERY TREND
The Palau ground dove (Gallicolumba canifrons) is one of three Palau bird species that were virtually eliminated by damage caused to the Palau Islands (formerly a U.S. administered United Nations Trust Territory now under an independent constitutional government) during World War II [1]. Surveys conducted from 1976 to 1979 observed Palau ground doves on all major limestone islands from Koror to Angaur [2]. Although they were considered rare or uncommon on these islands, scientists thought this could be due to difficulty detecting Palau ground doves when they were present [2]. Because the Palau ground dove is not sought as a game species, and the constitution of Palau has banned the personal possession of firearms, hunting is not a threat to this species [1]. The U.S. Fish and Wildlife Service removed the Palau ground dove, along with the Palau fantail flycatcher and the Palau owl, from the endangered species list in 1985 [1]. The 2011 population is estimated to be stable at around 500 birds [2, 3].
CITATIONS
[1] Noecker R.J. 1998. Congressional Research Service, Report for Congress: Endangered Species List Revisions: A Summary of Delisting and Downlisting. Made available by National Council for Science and the Environment. Washington D.C.
[2] Pratt H.D., J. Engbring, P.L. Bruner, and D.G. Berrett. 1980. 1976-1979 Notes on the taxonomy, natural history, and status of the resident birds of Palau. Condor 82(2): 117-131.
[3] BirdLife International. 2011. Species factsheet: Gallicolumba canifrons. http://www.birdlife.org/datazone/speciesfactsheet.php?id=2622.
Palau owl (Pyroglaux podargina)
| Status: Delisted | Critical habitat: none | Listed: 6/2/1970 | Recovery plan: none |
Range: PL(b) ---
SUMMARY
The Palau owl was virtually eliminated by damage caused to the island during World War II and later may have been threatened by the introduction of a beetle that was poisonous when ingested by the owls. Surveys conducted in 1976 found the owls to be abundant throughout the archipelago and in 1985, the owl was delisted. In 2011 the owl is considered a species of least conservation concern.
RECOVERY TREND
The Palau owl (Pyrroglaux podargina) is one of three Palau bird species that were virtually eliminated by damage caused to the Palau Islands (formerly a U.S. administered United Nations Trust Territory now under an independent constitutional government) during World War II [1]. Surveys conducted in 1945 found that the endemic owl, reported to be common in 1931, was scarce [2]. The population is thought to have continued to decline until the 1960s, possibly due to deaths caused by the ingestion of an introduced beetle [2]. Following efforts to control the introduced beetle (Oryctes rhinoceros), also a pest on coconut plantations, owl populations began to increase [2]. A 1976 to 1979 survey found Palau owls to be abundant throughout the archipelago [2] and in 1985, the U.S. Fish and Wildlife Service removed the Palau owl, along with the Palau ground dove and Palau fantail flycatcher, from the endangered species list [1]. As of 2011 the population remains stable [3].
CITATIONS
[1] Noecker R.J. 1998. Congressional Research Service, Report for Congress: Endangered Species List Revisions: A Summary of Delisting and Downlisting. Made available by National Council for Science and the Environment. Washington D.C.
[2] Pratt H.D., J. Engbring, P.L. Bruner, and D.G. Berrett. 1980. 1976-1979 Notes on the taxonomy, natural history, and status of the resident birds of Palau. Condor 82(2): 117-131.
[3] IUCN. 2011. IUCN Red List of Threatened Species. Version 2011.1. http://www.iucnredlist.org/apps/redlist/details/143216/0.
Puerto Rican parrot (Amazona vittata)
| Status: Endangered | Critical habitat: none | Listed: 3/11/1967 | Recovery plan: 5/9/2009 |
Range: PR(b) ---
SUMMARY
The Puerto Rican parrot declined to near extinction due to deforestation, hunting and hurricane damage. When listed as an endangered species in 1967, there were just 24 birds in one population. Due to habitat protection, captive breeding and predator control, it increased to 377 birds in 2001 in two wild populations and two breeding facilities.
RECOVERY TREND
The Puerto Rican parrot (Amazona vittata) formerly inhabited mature and old-growth forests on Puerto Rico and the adjacent smaller islands of Culebra, Mona, Vieques, and possibly the Virgin Islands [6]. Interspersed with small sandy and marshy areas, these forests covered most of the islands, providing nesting cavities in large, upland trees, and seeds and fruits in upland, lowland, and coast plains forests.
EARLY POPULATION STATUS
Though absolute numbers are not precisely known, 100,000 to 1 million Puerto Rican parrots are believed to have coexisted with the Taino Indians for several hundred years prior to the arrival of Spanish colonists [6]. Also known as Arawak, the Taino came to Puerto Rico from South America, calling it Boriken (or Borinquen), "the land of the great lords." They lived in small villages, sustained by seafood, pineapples, cassava, guava, garlic, sweet potatoes, hunting and wild crafting.
When Columbus landed on Puerto Rico on November 19, 1493, there were between 20,000 and 50,000 Taino on the island and on the order of 1 million to 3 million throughout the Greater Antilles (Cuba, Jamaica, Haiti, Dominican Republic, Puerto Rico and related islands) [13]. Bartolomé de Las Casas, a Spanish priest living in the Dominican Republic, who championed the rights of indigenous peoples, wrote in 1561 that “between 1494 and 1508 more than three million people died from war, slavery and the mines. Who in future generations will believe this? I myself as an eyewitness can scarce believe it.” [8]
By 1513, so few Taino remained that the Spanish began importing slaves from Africa to farm their plantations and mine the mountains [8]. By 1544, just 60 were thought to remain in Puerto Rico. Whether the Taino became extinct, survived in remote Cuban villages, or carried on as a mixed-race people (61 percent of contemporary Puerto Ricans have Native American mtDNA [9]) is controversial, but they were clearly decimated within a decade of Puerto Rico’s colonization.
The Puerto Rican parrot would also be driven to near extinction, but over a much longer period of time. It was still common in 1650, 150 years after colonization [10]. The human population of Puerto Rico was just 880 souls by then, almost entirely Spanish and African and mixed-race slaves. The forests were still largely intact.
In the next 200 years, Puerto Rico’s human population would grow to 500,000 [10]. Vast expanses of forest, especially in the lowlands, were cleared for agriculture. It was during this period that the first significant parrot declines were reported (for example, by the German naturalist Morritz in 1836) [8].
The human population doubled in the next 50 years, reaching 1 million in 1900 [10]. Seventy-six percent of the land area had been converted to agriculture, and remaining forests were highly fragmented, with just 1 percent in an old-growth state [7, 10]. The Puerto Rican parrot was by then extirpated from the outer islands and reduced to five locations on the mainland [6].
In the next 100 years, Puerto Rico’s population would nearly quadruple, reaching 3.7 million in 2011 [12].
RECENT POPULATION STATUS
As the island’s human population continued to grow, its native habitats continued to decline, and its wildlife suffered increasing pressures. The Culebra parrot (A. v. gracilipes), a subspecies of Puerto Rican parrot, was driven extinct by hunting and persecution on Culebra Island in 1912 [14]. By 1937, the Puerto Rican parrot numbered just 2,000 birds [7]. By 1954, only 200 remained, all in the Luquillo Mountains, which was, and is, the largest contiguous tract of native forest on the island. It was preserved as a forest reserve by the Spanish Crown in 1876, and is one of the oldest reserves in the Western Hemisphere. It was made a U.S. forest reserve in 1908 and a national forest in 1935; it is now the El Yunque National Forest [7]. The population dwindled to 130 in 1963, 70 in 1966, and 24 in 1967 [2, 6, 7].
In 1967, the U.S. Fish and Wildlife Service placed the Puerto Rican parrot on the nation’s first endangered species list and established a recovery program the following year composed of the Wildlife Service, the U.S. Forest Service, the National Biological Survey, the Puerto Rico Department of Environmental and Natural Resources, and many academic and independent scientists [6].
The wild parrot population continued to fall after being listed as endangered, reaching a low of 14 wild birds in 1975 [2, 6, 7, 14]. After that, conservation actions began to bear fruit and the number of birds in the wild increased to 47 in 1989. That same year, though, the island was hit by Hurricane Hugo, leaving just 24 wild birds in 1990.
Between 1990 and 2011, the captive Puerto Rican parrot population grew fairly steadily from 59 to about 300 [6, 13]. The wild population, however, has struggled. Between 1990 and 1998, it grew steadily from 24 to 42 birds. In 1998 Hurricane George caused extensive damage to eastern Puerto Rico. Thereafter, the wild parrot population declined almost steadily to 16 in 2006, the second lowest level ever recorded. Since then, however, the population has increased dramatically to 77 in 2011 through expansion of the captive-breeding and reintroduction program, establishment of a second wild population, and better understanding of reproductive limitations.
CAPTIVE BREEDING
In 1973 the Luquillo Aviary was established in an abandoned Army building in the Caribbean National Forest (now the Yunque National Forest) to secure the population against extinction should all wild birds die, and to augment the wild population with captive-reared birds [6]. The building was old, inadequate and poorly located, but was the only available federal facility in proximity to the Luquillo Mountains. In 2007, it was replaced by a new facility, the Iguaca Aviary, also run by the U.S. Fish and Wildlife Service.
In 1993, a second captive-breeding facility, the José L. Vivaldi Aviary, was built with a U.S. Fish and Wildlife Service matching grant, state funds and private contributions in the Rio Abajo Forest [6] to expand the breeding program and insure against the Luquillo Aviary being destroyed by a hurricane. It is run by the Puerto Rico Department of Environmental and Natural Resources.
IMPROVING NESTING SUCCESS
Prior to 1973, nesting success (=fledging of at least one chick) ranged from 11 percent to 26 percent [6], which in the best of circumstances would sustain only slow growth, and in actuality was not sufficient to offset mortality. The recovery program sought to increase nesting success by improving the quality and quantify of nesting habitat, protecting nest areas from disturbance and controlling non-native predators and competitors. All breeding pairs since 1976 have used created or modified nest sites designed to prevent entry of water and discourage entry by predators and competitors. By 1987, nesting success increased to 81 percent. Efforts were intensified after Hurricane Hugo.
Nesting success has also be improved by fostering aviary-born chicks in wild nests, rescuing imperiled chicks and returning them to the wild, and release of breeding age birds into the wild [6].
CREATING A SECOND POPULATION
In 1989, the Puerto Rico Department of Natural and Environmental Resources entered into an agreement with the U.S. Fish and Wildlife Service to manage the 5,850-acre Rio Abajo Forest to enhance its potential as a future parrot reintroduction site [6]. In 2006, 22 birds were reintroduced. The wild population there has since grown to 55 birds [6, 13], and in 2011 was twice as large as the El Yunque population.
CITATIONS
[1] U.S. Fish and Wildlife Service. 1999. Revised Recovery Plan for the Puerto Rican Parrot, Technical/Agency Draft. U.S. Fish and Wildlife Service Southeast Region, Atlanta, GA
[2] U.S. Fish and Wildlife Service. 2008. Puerto Rican Parrot Five-Year Review. Available at https://ecos.fws.gov/docs/five_year_review/doc1989.pdf
[3] U.S. Fish and Wildlife Service. 2003. Three is a charm. U.S. Fish and Wildlife Service press release, May 14, 2002.
[4] U.S. Fish and Wildlife Service. 2004. Flight freedom. U.S. Fish and Wildlife Service press release, May 3, 2004.
[5] Puerto Rico Department of Environmental and Natural Resources. 2005. Puerto Rico's Comprehensive Wildlife Conservation Strategy 2005.
[6] U.S. Fish and Wildlife Service. 2009. Recovery Plan for the Puerto Rican Parrot, Second Revision. Available at http://ecos.fws.gov/docs/recovery_plan/090617.pdf
[7] Meyers, M.J. Puerto Rican parrots. National Biological Service, Patuxent Environmental. Available at http://boricua.com/la-isla/puerto-rican-parrots. Accessed May 8, 2012.
[8] Rouse, I. 1993. The Tainos: Rise and Decline of the People Who Greeted Columbus. Yale University Press (New Haven)
[9] Martínez Cruzado, J. C. 2002. The Use of Mitochondrial DNA to Discover Pre-Columbian Migrations to the Caribbean: Results for Puerto Rico and Expectations for the Dominican Republic. Kacike: The Journal of Caribbean Amerindian History and Anthropology
[10] Snyder, N.F.R., J.W. Wiley and C.B. Kepler. 1987. The parrots of Luquillo: natural history and conservation of the Puerto Rican parrot. Western Foundation of Vertebrate Zoology.
[11] Library of Congress. Abolition of slavery in Puerto Rico. Website available at http://www.loc.gov/rr/hispanic/1898/slaves.html
[12] World Population Review. 2012. Puerto Rico population 2012. Website available at http://worldpopulationreview.com/puerto-rico-population-2012/
[13] Fox, B. 2011. Endangered Puerto Rican Parrot on the Rise. Associated Press, June 15, 2011 available at http://abcnews.go.com/Technology/wireStory?id=13929877#.T6mgQujE_nh
[14] U.S. Fish and Wildlife Service. 2001. Puerto Rican Parrot Release. Press release available at http://library.fws.gov/Pubs4/PR_parrot_release.pdf.
Puerto Rican plain pigeon (Columba inornata wetmorei)
| Status: Endangered | Critical habitat: none | Listed: 10/13/1970 | Recovery plan: 10/14/1982 |
Range: PR(b) ---
SUMMARY
Hunting and clearing of forests for agriculture caused the once-abundant Puerto Rican plain pigeon to decline to near extinction. The pigeon remains highly threatened by habitat loss for development, hurricane damage to forests and low bird density. Survey methods have changed, making population comparisons difficult. Overall the total population of pigeons has fluctuated but increased from a few hundred survivors at listing in 1970 to an estimated population of about 1,600 birds in 2010.
RECOVERY TREND
The Puerto Rican plain pigeon (Columba inornata wetmorei) was common and widespread in the foothills and valleys of Puerto Rico in the 1800s, but declined to near extinction in the 1920s and 1930s due to unregulated hunting, clearing of forests for agriculture, and hurricane damage to forests [1]. It was feared to be extinct when a small population was discovered in eastern Puerto Rico in 1963. It was placed on the endangered species list in 1970 and has increased in population size since listing due to a prohibition on shooting, protection and restoration of forest habitats, and a captive breeding program (established at the University of Puerto Rico’s Hamacao Campus in 1984).
Due to differences in survey methods, it is difficult to quantify absolute change in population size, but the total population of the pigeon has increased since it was protected under the Endangered Species Act in 1970. The area of occupancy has increased, but the pigeon remains limited to eastern Puerto Rico. Habitat loss continues to be the main threat at the center of abundance in east-central Puerto Rico. The pigeon remains at high risk of extinction due to low density, ongoing habitat loss, and the threat of hurricane damage and other stochastic events. The pigeon is very sensitive to hurricane damage to its habitat, and was negatively impacted by Hurricane Hugo in 1989 and by Hurricane Georges in 1998 [3].
Counts conducted from 1973 to 1983 in known roosting areas estimated that the population in the species’ core habitat increased from approximately 100 birds from 1973-1983 to 218 birds from 1986-1992 [2]. Theses counts were of a small area, were not adjusted for detection probability, and likely underestimate the total population size at the time [5]. Since then, population estimate methodologies have changed, making it difficult to quantify change in population size, but total population has been estimated at more than 1,000 birds since 1997 [5]. In 1998 the population was estimated at more than 3,000 birds, but following Hurricane Georges the population declined to 1,200 birds in 1999. The population then rebounded to more than 3,000 birds in 2001, but then declined again, to about 1,600 birds in 2010 [5].
The 1982 U.S. Fish and Wildlife Service recovery plan calls for the establishment of two populations with at least 250 nesting pairs each [4]. The total population is much larger than 500 pairs, but it is not clear if they exist in one or more distinct populations. Regardless, it’s questionable whether 500 nesting pairs constitute a non-endangered status in Puerto Rico's current landscape. The recovery plan should be updated and a population viability assessment should be conducted.
CITATIONS
[1] Rivera-Milán, F.F., C.R. Ruiz, J.A. Cruz, M. Vázquez, and A.J. Martínez. 2003. Population monitoring of Plain Pigeons in Puerto Rico. Wilson Bulletin 115: 45–51.
[2] Rivera-Milan, F.F. 2005. Monitoring of pigeon and dove populations on Puerto Rico and Territorial Islands (1986-2005). U.S. Fish and Wildlife Service, unpublished manuscript, October 3, 2005.
[3] Rivera-Milán, F.F., C.R. Ruiz, J.A. Cruz, and J.A Sustache. 2003. Reproduction of Plain Pigeons (Columba inornata wetmorei) in east-central Puerto Rico. The Auk 120(2):466-480.
[4] U.S. Fish and Wildlife Service. 1982. Puerto Rican Plain Pigeon Recovery Plan. U.S. Fish and Wildlife Service, Atlanta, Ga. 52 pp.
[5] F.F. Rivera-Milán. 2011. Biologist, U.S. Fish and Wildlife Service, personal communication.
San Clemente loggerhead shrike (Lanius ludovicianus mearnsi)
| Status: Endangered | Critical habitat: none | Listed: 8/11/1977 | Recovery plan: 1/26/1984 |
Range: CA(b) ---
SUMMARY
The San Clemente loggerhead shrike's habitat was severely degraded by sheep, pigs, mule deer and goats beginning in the late 1880s. Nonnative grazers have been eliminated, but nonnative predators such as cats and rats are a significant threat. There were about 50 birds in 1977 when the shrike was listed as an endangered species. It declined to just 14 birds in 1998. A captive breeding program was initiated in 1999, steadily increasing the species to a minimum of 185 breeding birds in 2009.
RECOVERY TREND
The San Clemente loggerhead shrike (Lanius ludovicianus mearnsi) is endemic to San Clemente Island off the coast of Southern California. Its habitat has been degraded by sheep, pigs, mule deer and goats since the late 1880s [1]. The U.S. Navy took control of the island in 1934, began removing feral ungulates in 1973, and completed the task in 1993 [2]. Following the removal of goats, fire became a significant habitat destruction factor [1]. Predation by feral cats, island foxes and ravens was responsible for 44 percent of nest failures in the late 1980s [1]. Nonnative grazers have been completely removed from the island, which has allowed native shrubs and trees to begin the process of vegetation recovery that is expected to support nesting by shrikes and increase the invertebrate and vertebrate prey base. Nonnative predators (cats and black rats) are now considered the highest cause of mortality to shrikes on San Clemente Island, despite current efforts to remove the predator pressure [9].
The shrike declined to about 20 birds in the early 1900s [7]. In 1977, when the species was listed, the number of shrikes had increased to about 50 [3], but then declined to 14-19 birds between 1996 and 1999 [6]. Between 1999 and 2005, 255 captive reared shrikes were hacked into the wild [8]. Combined with control of shrike predators and habitat protection, the reintroduction program steadily increasining the population to a minimum of 185 breeding birds in 2009 [6].
CITATIONS
[1] Yosef, R. 1996. Loggerhead Shrike (Lanius ludovicianus). In The Birds of North America, No. 231 (A. Poole and F. Gill, eds.). The Academy of Natural Sciences, Philadelphia, and The American Ornithologists’ Union, Washington, D.C.
[2] U.S. Department of the Navy, Southwest Division. 2002. San Clemente Island Integrated Natural Resources Management Plan Final, May 2002. San Diego, CA. Prepared by Tierra Data Systems, Escondido, CA.
[3] U.S. Fish and Wildlife Service. webpage. San Clemente loggerhead shrike, Lanius ludovicianus mearnsi. http://ecos.fws.gov/docs/life_histories/B05R.html accessed January 7, 2006.
[4] U.S. Navy. 2004. Something to shrike about. Currents, Fall 2004:7-13.
[5] NatureServe. 2005. NatureServe Explorer: An online encyclopedia of life [web application]. Version 4.5. NatureServe, Arlington, Virginia.
[6] Institute for Wildlife Studies. 2012. San Clemente Loggerhead Shrike (Lanius ludovicianus mearnsi) website http://www.iws.org/species_loggerhead_shrike.html. Accessed May 6, 2012
[7] U.S. Navy. 2001. Shrike Back. Currents, Fall 2001.
[8] U.S. Fish and Wildlife Service. 2009. San Clemente Loggerhead Shrike (Lanius ludovicianus mearnsi) 5-Year Review: Summary and Evaluation. Carlsbad Fish and Wildlife Office. 22 pp.
San Clemente sage sparrow (Amphispiza belli clementeae)
| Status: Threatened | Critical habitat: none | Listed: 8/11/1977 | Recovery plan: 1/26/1984 |
Range: CA(b) ---
SUMMARY
The San Clemente sage sparrow declined due to the effects of overgrazing. Nonnative ungulates have been removed from the island, but the sparrow remains threatened by military activities, predation, fire and climate change. In 1976, there were 112 sage sparrows. The species was listed as endangered in 1977 and increased to 1,240 sparrows in 2010; an increase of 1,233 percent.
RECOVERY TREND
The San Clemente sage sparrow (Amphispiza belli clementeae) is endemic to San Clemente Island off the coast of Southern California. It occurs in three discontinuous patches of maritime sage scrub dominated by boxthorn (Lycium californicum): a narrow coastal belt on the western shore extending north from Seal Cove, a smaller area four kilometers to the south, and a degraded site just north of the runway on the north end of the island [4]. Its habitat has been degraded by sheep, pigs, mule deer and goats since the late 1880s [1]. The U.S. Navy took control of the island in 1934, began removing feral ungulates in 1973, and completed the task in 1992 [2].
The primary threat identified at listing, the browsing effect of feral goats and the rooting effect of feral pigs, has been eliminated, although impacts to the habitat from the historic overgrazing remain. Other ongoing threats include habitat modification from military activities, increased fire frequency, and fire suppression activities; predation from introduced and native predators; small population size, low juvenile survivorship, and limited distribution. The species is also threatened by climate change [8].
The sage sparrow was common in the early 1900s [5], but declined to 112 birds in 1976 [7]. It was listed as an endangered species in 1977, increased to 360 in 1981 [6], then declined to 38 in 1984 [6], before increasing to 195-280 in 1986 [7]. Contemporary populations have ranged from a low of 452 individuals in 2000 to a high of 1,519 individuals in 2002 [8]. In 2010, the population was estimated at 1,240 adults [9].
CITATIONS
[1] U.S. Fish and Wildlife Service. 1984. Recovery Plan for the Endangered and Threatened Species of the California Channel Islands. U.S. Fish and Wildlife Service, Portland, OR. 165 pp.
[2] U.S. Navy, Southwest Division. 2002. San Clemente Island Integrated Natural Resources Management Plan Final, May 2002. San Diego, CA. Prepared by Tierra Data Systems, Escondido, CA.
[3] Institute for Widlife Studies. 2005. San Clemente sage sparrow. Website <www.iws.org/san_clemente_sage_sparrow.htm> accessed October 1, 2005.
[4] SERG. 2003. TAR 4 Habitat Monitoring and Restoration Plan. Soil Ecology and Research Group, San Diego State University. Available at <www.serg.sdsu.edu/SERG/restorationproj/channel_islands/TAR4/TAR4.htm>.
[5] Martin, J. W., and B. A. Carlson. 1998. Sage Sparrow (Amphispiza belli). In The Birds of North America, No. 326 (A. Poole and F. Gill, eds.). The Birds of North America, Inc., Philadelphia, PA.
[6] Hyde, K.M. 1985. The status of the San Clemente sage sparrow. Unpublished report on file at: the Natural Resources Office, North Island Naval Air Station, San Diego, CA. 55 pp.
[7] NatureServe. 2005. NatureServe Explorer: An online encyclopedia of life [web application]. Version 4.5. NatureServe, Arlington, Virginia.
[8] U.S. Fish and Wildlife Service. 2009. San Clemente sage sparrow (Amphispiza belli clementeae) 5-Year Review: Summary and Evaluation. Carlsbad Fish and Wildlife Office. 29 pp.
[9] United States Department of Navy. 2012. Draft Environmental Assessment for the Replacement of the Fuel Storage and Distribution System, Naval Auxiliary Landing Field, San Clemente Island, CA. Available at https://www.neco.navy.mil/necoattach/N6247312R14020003Draft_San_Clemente_Island_EA_March_2012[1].pdf.
Tinian monarch (Monarcha takatsukasae)
| Status: Delisted | Critical habitat: none | Listed: 6/2/1970 | Recovery plan: none |
Range: MP(b) ---
SUMMARY
The removal of native forests for sugarcane production prior to World War II and military activities during the war caused the Tinian monarch, a forest bird endemic to Tinian Island, to reach critically low levels. The Tinian monarch adapted well to shrubby vegetation seeded following WWII. After its population reached 39,338 in 1982, the monarch was proposed for downlisting; a continued increase led to the species’ delisting in 1999.
RECOVERY TREND
The Tinian monarch (Monarcha takatsukasae) is a forest bird endemic to the island of Tinian in the Mariana Archipelago [1]. The removal of native forests for sugarcane production prior to World War II and military activities during the war caused the Tinian monarch population to reach critically low levels [1, 2]. The species was listed as endangered in 1970 [1].
Following the war, the U.S. military seeded much of Tinian with a shrubby legume to which the Tinian monarch adapted well [2]. Surveys conducted in 1982 estimated the Tinian monarch population at 39,338 [1]. This prompted the downlisitng of the monarch to “threatened” in 1987 [1]. In 1994 and 1995, the population was estimated at 52,900 and in 1996, a replication of the 1982 surveys produced an estimate of 55,720 [1]. The 1996 survey also found that forest density had increased indicating that the quality of the monarch’s habitat had improved as well [1]. In 1999 the U.S. Fish and Wildlife Service proposed delisting the Tinian monarch and in 2004 the final rule to delist the species was published [1]. Although current agricultural development is expected to remove some forest habitat, much of the land on Tinian is leased by the U.S. Navy for training, and development in these areas is expected to be minimal [2].
CITATIONS
[1] U.S. Fish and Wildlife Service. 2004. Draft Post-delisting Monitoring Plan for the Tinian Monarch (Monarcha takatsukasae): Notice of Availability. Federal Register December, 13, 2004. (69 FR 72211-72212)
[2] U.S. Fish and Wildlife Service. 1985. Proposal to remove the Tinian Monarch flycatcher from the list of threatened and endangered species. Federal Register November 1, 1985 (50 FR 45632-45633].
Western snowy plover (Pacific DPS) (Charadrius nivosus nivosus (Pacific DPS))
| Status: Threatened | Critical habitat: 12/7/1999 | Listed: 3/5/1993 | Recovery plan: 8/13/2007 |
Range: CA(b), OR(b), WA(b) ---
SUMMARY
The snowy plover declined on the Pacific Coast due to habitat loss, disturbance of nest sites, and encroachment of European beach grass. It remains threatened by predation, disturbance and climate change. When listed as an endangered species in 1993, the U.S. population was estimated at about 1,500 adults. Protection efforts have allowed the population to increase to more than 3,600 adults in 2010.
RECOVERY TREND
The Pacific Coast western snowy plover (Charadrius alexandrinus nivosus) inhabits beaches, lagoons and salt-evaporation ponds along the coasts of California, Oregon and Washington in the United States, and in Mexico [1] with the largest number of breeding birds occurring south of San Francisco Bay to southern Baja [2]. Because of a decline in active nesting colonies and breeding and wintering populations the Pacific coast population of snowy plovers was listed as threatened in 1993 [3]. It is estimated that at the time the plover was listed, approximately 1,500 western snowy plovers nested in the United States [4]. The decline of Pacific coast snowy plovers has been attributed to loss of nesting habitat and habitat degradation caused by expanding beach-front development and recreation, human disturbance, encroachment of European beach grass on nesting grounds, and predation [1, 2].
Although the snowy plover still faces the same threats that it did prior to listing, protections have reduced the magnitude of these threats [5]. Since listing, the number of snowy plovers and nesting sites has increased and progress has been made toward bringing the species back to health [5]. Measures taken to benefit plovers since listing include building exclosures to help reduce nest predation, restoring habitat by removing European beachgrass, posting signs and symbolic fencing around breeding sites, distributing information to the public, and increased law enforcement [4]. In addition, 12,145 acres were designated as critical habitat for snowy plovers in 2005, and in 2011 the Service proposed increasing the total critical habitat to 28,261 acres [6, 8]. As of 2010, the total U.S. population was estimated at 3,656 adults, with 3,379 birds in California, 234 in Oregon, and 43 in Washington [9]. The California and Oregon populations have increased since 2005, but the Washington population has been declining since 2005 [10].
California: Statewide surveys conducted in the late 1970s estimated the snowy plover population at 1,566 adults and found that only 20 of 53 historic breeding sites were occupied [4]. Later, an additional 11 locations were identified as sites that had once supported, but subsequently lost, nesting plovers [4]. Plover numbers continued to decline and in 2000 only 976 breeding plovers were observed [4]. Since then, numbers increased to 1,680 adult plovers observed during 2005 survey season and further still to 3,379 birds in 2010 [7, 9].
Oregon: Historically, snowy plovers nested at 29 coastal locations in Oregon [4]. By the time the species was listed in 1993, 23 of these sites had been lost [4]. Since listing, snowy plovers have reoccupied four of these sites bringing the number of breeding sites in the state up to 10 [4]. Since 1994, the number of adult breeding snowy plovers has been slowly increasing [4], and the 2010 population was estimated at 232 to 236 adults, the highest estimate recorded since monitoring began in 1990 [9].
Washington: Plovers once nested at five coastal sites, but only two of these sites are currently active [10]. The mean 2010 Washington breeding adult population was 43 (95 percent confidence interval: 39-46). The Washington population declined by approximately six birds per year from 2005 to 2010 (p < 0.001) [10].
The recovery criteria are outlined in the 2007 recovery plan [11]. The Pacific coast population of the western snowy plover will be considered for delisting when the following criteria have been met: 1. An average of 3,000 breeding adults has been maintained for 10 years, distributed among six recovery units as follows: Washington and Oregon, 250
breeding adults; Del Norte to Mendocino counties, Calif., 150 breeding adults; San Francisco Bay, Calif., 500 breeding adults; Sonoma to Monterey counties, Calif., 400 breeding adults; San Luis Obispo to Ventura Ccounties, Calif., 1,200 breeding adults; and Los Angeles to San Diego counties, Calif., 500 breeding adults.
CITATIONS
[1] U.S. Fish and Wildlife Service. Species Account: Western Snowy Plover. Website <http://ecos.fws.gov/docs/life_histories/B07C.html> accessed May, 2006.
[2] U.S. Fish and Wildlife Service. 2006. Background and Q&A’s about the West Coast Population of Snowy Plovers Website <http://www.fws.gov/sacramento/ea/news_releases/2006%20News%20Releases/Plover_petition-4d_2006_QA.html> accessed May, 2006.
[3] U.S. Fish and Wildlife Service. 1993. Determination of Threatened Status for the Pacific Coast Population of the Western Snowy Plover. Federal Register 58 FR 12864-12874.
[4] U.S. Fish and Wildlife Service. 2006. 12-Month Finding on a Petition to Delist the Pacific Coast Population of the Western Snowy Plover. Federal Register 71 FR 20607-20624.
[5] U.S. Fish and Wildlife Service. 2006. Western Snowy Plover Nesting Success Improves Again in 2005. New Release, November 4th, 2005. Available at <http://news.fws.gov/NewsReleases/showNews.cfm?newsId=5D35B69D-65BF-03E7-207B4B69FD517A95>.
[6] U.S. Fish and Wildlife Service. 2005. Critical Habitat Designated for Pacific Coast Population of the Western Snowy Plover. News Release, September 26, 2005. Available at <http://news.fws.gov/NewsReleases/showNews.cfm?newsId=93B3C371-65BF-03E7-2BFCCD9F7349AD9D>.
[7] U.S. Fish and Wildife Service. 2006. Comparison of the 2005 and 2006 summer Snowy Plover surveys on the Pacific Coast. Arcata, CA. Available at: www.fws.gov/arcata/es/birds/reports/2006%20Pacific%20Coast%20breeding%20survey.v2%20update.pdf
[8] U.S. Fish and Wildlife Service. 2011. Revised Critical Habitat for the Pacific Coast Population of the Western Snowy Plover. 76 FR 16046.
[9] U.S. Fish and Wildlife Service. 2011. Western Snowy Plover Species Profile. http://www.fws.gov/arcata/es/birds/WSP/plover.html
[10] Pearson, S.F., C. Sundstrom, W. Ritchie, and K. Gunther. 2010. Washington State Snowy Plover Population Monitoring, Research, and Management: 2010 Nesting Season Research Progress Report. Washington Department of Fish and Wildlife, Wildlife Science Division, Olympia.
[11] U.S. Fish and Wildlife Service. 2007. Recovery Plan for the Pacific Coast Population of the Western Snowy Plover. 292 pp.
Whooping crane (Grus americana)
| Status: Endangered | Critical habitat: 5/15/1978 | Listed: 3/11/1967 | Recovery plan: 3/30/2007 |
Range: CO(m), FL(b), GA(m), IL(m), IN(m), KS(m), KY(m), MT(m), NE(m), ND(m), OK(m), SD(m), TN(m), TX(s), WI(b), WY(m) --- AL(x), AR(x), DE(x), DC(x), IA(x), LA(x), MD(x), MN(x), MS(x), MO(x), NJ(x), NC(x), OH(x), SC(x), UT(x), VA(x), WV(x)
SUMMARY
The whooping crane declined precipitously in the late 1800s and early 1900s due to hunting and habitat loss. It remains threatened by habitat degradation, collisions with power lines, and oil and gas development. When listed as endangerd in 1967, the whooping crane consisted of 43 wild and 7 captive birds. By 2011, it had grown to 437 wild and 162 captive birds.
RECOVERY TREND
The whooping crane (Grus americana) formerly occurred from the Arctic coast to central Mexico, and from Utah to New Jersey, South Carolina, Georgia and Florida [1]. In the 19th and 20th century, it's primary nesting area extended from central Illinois, northwestern Iowa, northwestern Minnesota, and northeastern North Dakota northwesterly through southwestern Manitoba, southern Saskatchewan and into east central Alberta. Wintering grounds and migration routes included much of the United States east of the Rocky Mountains. As of 2012, whooping cranes nest in the wild at only three locations:
1) Wood Buffalo National Park and adjacent areas in Canada (this population winters in Aransas National Wildlife Refuge, Texas),
2) Central Florida (this is an introduced, non-migratory population), and
3) Wisconsin (this population winters in Florida) [1].
An effort to reintroduce whooping cranes into the Rocky Mountain area by cross-fostering whooping cranes to sandhill crane foster parents was abandoned when the last whooping crane introduced into this population died in 2002 [1]. Captive whooping crane populations are maintained at the Calgary Zoo, International Crane Foundation, Patuxent Wildlife Research Center, San Antonio Zoo, New Orleans Zoo, Lowry Park Zoo, and the Audubon Center for Research on Endangered Species.
Whooping crane populations in 1870 were variously estimated at 1,300 to 1,400 and 500 to 700 birds, but then declined precipitously due to hunting and habitat destruction [1]. Conservation efforts were able to maintain an extremely endangered but relatively stable population of 21 to44 birds between 1938 and 1966 [2]. When placed on the endangered species list in 1967, just 48 wild and six captive birds remained. In 1978, critical habitat was designated in parts of Idaho, Kansas, Nebraska, Oklahoma and Texas, primarily on federal and state wildlife management lands [3]. Due to intensive habitat management, nest area protection, captive breeding and reintroductions, the population rose steadily to 513 (368 wild and 145 captive) birds in 2006. [2, 4]. Estimates as of May 2007 indicated a population decline of 31 birds [5], due in part to a storm that killed 17 of 18 birds being held at the Chassahowitzka National Wildlife Refuge in Florida. The total population was 372 in 2000 and jumped to 599 in 2011 [8].
The 2003 draft international recovery plan sets forth two alternate criteria for downlisting the whooping crane to threatened status: 1) The Aransas-Wood Buffalo population must have at least 160 total birds with at least 40 productive pairs, and two additional separate self-sustaining populations must have at least 25 productive pairs and 100 total birds each. All three populations must maintain their status for a decade; or the Aransas-Wood Buffalo population must have 250 reproducing pairs and a total of 1,000 birds [1]. In either scenario, at least 21 productive pairs and 153 total birds must be maintained in captivity. Downlisting is estimated to occur in 2035. Delisting criteria have not yet been established.
Current threats to the species include low genetic diversity, loss and degradation of migration stopover habitat, construction of power lines, the proposed Keystone XL pipeline, degradation of coastal habitat, and in Texas, the threat of chemical spills [1].
CITATIONS
[1] Canadian Wildlife Service and U.S. Fish and Wildlife Service. 2007. International Recovery Plan for the Whooping Crane (Grus americana), Third Revision Albuquerque, New Mexico. 196 pp. http://ecos.fws.gov/docs/recovery_plans/2007/070604_v4.pdf
[2] Didrickson, B. 2011. Historic Whooping Crane Numbers: 1939-2011. International Crane Foundation. www.savingcranes.org/images/stories/site_images/conservation/whooping_crane/pdfs/historic_wc_numbers.pdf
[3] U.S. Fish and Wildlife Service. 1978. Determination of critical habitat for the whooping crane. 43 FR 20938.
[4] Stehn, T. 2007. Whooping crane numbers - November 22, 2006. Report provided by Tom Stehn, U.S. Fish and Wildlife Service, on May 16, 2007.
[5] Stehn, T. 2007. Whooping crane numbers - May 14, 2007. Report provided by Tom Stehn, U.S. Fish and Wildlife Service, on May 16, 2007.
[6] Dinnage, R.J. 2007. Federal whooping crane relocation program suffers setback. Land Letter, February 2007.
[7] U.S. Geological Survey. 2010. The Whooping Crane: Return from the Brink of Extinction. Http://whoopers.usgs.gov/publications/CraneInfoSheet_4pp.pdf. Accessed October 5, 2011.
Wood stork (U.S. breeding DPS) (Mycteria americana (U.S. breeding DPS))
| Status: Endangered | Critical habitat: none | Listed: 2/28/1984 | Recovery plan: 5/18/1999 |
Range: AL(s), FL(b), GA(b), MS(s), NC(s), SC(b) ---
SUMMARY
A loss of suitable wetland feeding habitat reduced wood stork populations from an estimated 15,000-20,000 pairs in the late 1930s to around 5,000 pairs in the late 1970s. The number of wood stork nesting colonies increased from 29 at the time of listing in 1984 to 71 in 2002 and numbers of nests increased from an estimated 6,040 in 1984 to approximately 12,000 in 2009.
RECOVERY TREND
The wood stork (Mycteria americana) is the only species of stork that regularly occurs in the United States [1]. It may once have bred in all the southeastern coastal states from Texas to South Carolina, but today, the wood stork breeds only in Florida, Georgia and coastal South Carolina [1]. Post-breeding birds can sometimes be seen as far north as North Carolina and as far west as Mississippi and Alabama [1]. Precipitous declines in the wood stork’s range and population occurred during the mid-1900s [2]. The total population in the southeastern U.S. declined from an estimated 15,000 to 20,000 pairs in the 1930s to between 4,500 and 5,700 pairs in most years between 1977 and 1980 [1]. This decline was accompanied by a major shift in breeding abundance from southern Florida (where large colonies numbering between 5,000 and10,000 nesting pairs were found [1]) to a much more dispersed distribution northward though peninsular Florida and into coastal Georgia and South Carolina [3] where colonies formed at artificial water impoundments [4]. The decline in wood stork populations was primarily due to loss of suitable feeding habitat [1]. In south Florida in particular, manipulation of water levels through levees, canals and floodgates changed natural water regimes and affected the stork’s habitat [1].
Wood stork populations are monitored using aerial synoptic surveys to count nests [5]. Although population estimates based on this technique can be biased by changes in colony location and may underestimate population size, it is considered the most effective method for monitoring long-term population trends [5]. Aerial surveys were conducted over a 10-year period starting in 1975 and again over two five-year periods starting in 1991 and 2001 [5]. The number of nesting colonies increased from 29 at the time of listing in 1984 to 71 in 2002 and numbers of nests increased from an estimated 6,245 in 1984 to 11,279 in 2006 [8]. The nesting pairs population then fell back to fewer than 6,000 in 2007-08 due to drought in Florida before rebounding to approximately 12,000 in 2009 [7]. Increases seen starting in the late 1990s in southern Florida may have been in part due to favorable rainfall and drying patterns [6]. Future monitoring will continue to track population trends and will also help to monitor effectiveness of the “Comprehensive Everglades Restoration Plan,” a recent long-term plan intended to restore more natural water regimes to the Everglades [6].
Reclassification from “endangered” to “threatened” can be considered when there are 6,000 nesting pairs with annual regional productivity of greater than 1.5 chicks per nest per year (averaged over three years) [1]. In 2002, a scientific protocol was drafted for monitoring stork nest productivity and data collection began in 2003 to assess progress toward this goal [5]. The wood stork (U.S. breeding distinct population segment) was recommended for downlisting in the 2007 five-year Review [8] and received a positive 90-day finding to downlist in 2010 [7].
CITATIONS
[1] U.S. Fish and Wildlife Service. 1997. Revised Recovery Plan for the U.S. Breeding population of the Wood Stork. Atlanta, GA. 41p.
[2] Rodgers, J.A. Jr., S.T. Schwikert, and L. White. 2004. Productivity of Wood Storks in North and Central Florida. U.S. Fish and Wildlife Service Wood Stork Report Newsletter 3(1), April 2004.
[3] Meyer, K.D. and P.C. Frederick. 2004. Final Report: Survey of Florida’s Wood Stork (Mycteria Americana) Nesting Colonies, 2004. U.S. Fish and Wildlife Service, Atlanta, GA.
[4] Brooks, B. 2002. Background on Wood Stork (Mycteria Americana). Power Point Presentation.
[5] U.S. Fish and Wildlife Service. 2003. Wood Stork Report #2, March 2003.
[6] Ogden, J.C. 2004. Status of Wading Bird Recovery in Florida -2003. U.S. Fish and Wildlife Service Wood Stork Report Newsletter 3(1), April 2004.
[7] U.S. Fish and Wildlife Service. Sept. 21, 2010. 90-Day Finding on a Petition To Reclassify the U.S. Breeding Population of Wood Storks From Endangered to Threatened. 75 Fed. Reg. 57426.
[8] U.S. Fish and Wildlife Service. 2007. Wood stork (Mycteria americana) 5-Year Review: Summary and Evaluation. Jacksonville, FL. 34 pp.
