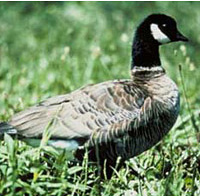
Aleutian Canada goose (Branta hutchinsii leucopareia)
| Status: Delisted | Critical habitat: none |
| Listed: 3/11/1967 | Recovery plan: 9/30/1991 |
Range: AK(b), CA(s), OR(s), WA(m) ---
SUMMARY
In the 1960s the Aleutian Canada goose was feared extinct due to predation by non-native foxes introduced to its nesting island, and to a less degree, by excessive hunting and loss of winter and migration habitat. It was rediscovered in 1962. In 1967 it was listed as an endangered species and grew from ~790 birds in 1975 to ~60,000 in 2005. It was declared recovered and removed from the endangered list in 2001, seven years earlier than projected by its recovery plan.
RECOVERY TREND
The Aleutian Canada goose was an abundant subspecies of Canada goose that nested in the northern Kuril and Commander Islands, in the Aleutian Archipelago, and on islands south of the Alaska Peninsula east to near Kodiak Island [1]. The birds wintered in Japan and in the coastal western United States to Mexico [1].
The fur industry began introducing Arctic and red foxes to the goose's nesting islands 1750, reaching a peak between 1915 and 1939 [2]. Foxes were released on 190 islands within the Aleutian Canada goose’s breeding range in Alaska [1]. They decimated the species by predating heavily on eggs, goslings and flightless molting geese.
Hunting, especially on the migration and wintering range in California, also contributed to population declines, as did loss and degradation of migration and wintering habitat [1]. Between 1938 and 1962, there were no sightings of Aleutian Canada geese, and it was feared the subspecies had gone extinct [1]. In 1962, however, a remnant population was discovered on rugged, remote Buldir Island in the western Aleutians [2].
After the Aleutian Canada goose was listed as endangered, efforts to eliminate introduced foxes from former nesting islands and to reintroduce the geese were initiated [1]. Hunting closures were implemented in wintering and migration areas [3]. Also, in the early 1980s biologists discovered two additional islands that supported small numbers of breeding Aleutian Canada geese [1].
Although early releases of captive-reared geese proved largely unsuccessful due to low survival rates, populations began to increase, likely due to the hunting closures in California and Oregon [1]. Translocations of wild-caught geese, implemented when the population on Buldir Island became large enough, proved more successful and as new breeding colonies became established, numbers increased rapidly [1]. In addition, important wintering and migration habitat in California and Oregon was acquired and designated as national wildlife refuges, and local landowners were encouraged to protect and manage habitat [2].
By 1990, the population had increased to an estimated 6,300, up from 790 counted in 1975, and the species was downlisted from endangered to threatened [1]. Between 1990 and 1998, the average annual population growth rate was estimated at 20 percent, and new populations became firmly established on Agattu, Alaid and Nizki islands in the western Aleutians [2]. In 1999, the population reached more than 30,000 [3]. In 2001, with the population estimated at 37,000, the Fish and Wildlife Service declared the Aleutian Canada goose recovered, and the species was taken off the list of endangered species [1]. In 2005 the population was approximately 60,000 [4]. While the Aleutian Canada goose continues to rebound in the western Aleutians, Russian scientists are conducting an ongoing program to reestablish it in the Asian portion of the birds’ range [1].
CITATIONS
[1] U.S. Fish and Wildlife Service. 2001. Endangered and Threatened Wildlife and Plants; Final Rule to Remove the Aleutian Canada Goose From the Federal List of Endangered and Threatened Wildlife. Federal Register (66 FR 15643).
[2] U.S. Fish and Wildlife Service. 2001. An Endangered Species Success Story: Secretary Norton Announces Delisting of Aleutian Canada Goose. News Release, March 19, 2001. Available at <http://news.fws.gov/newsreleases/R9/571EA0D1-2270-400B-B350418F893BCCEC.html?CFID=1629288&CFTOKEN=63346966>
[3] U.S. Fish and Wildlife Service. 2001. Aleutian Canada Goose Road to Recovery Timeline. Available at <http://alaska.fws.gov/media/pdf/road-to-recovery.pdf>.
[4] Trost, R. E., and M. S. Drut. 2005. 2005 Pacific Flyway data book: waterfowl harvests and status, hunter participation and success, and certain hunting regulations in the Pacific Flyway and United States. U.S. Fish and Wildlife Service, Division of Migratory Bird Management, Portland, Oregon.
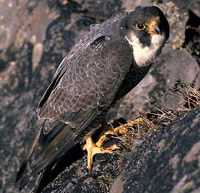
American peregrine falcon (Falco peregrinus anatum)
| Status: Delisted | Critical habitat: 8/11/1977 |
| Listed: 6/2/1970 | Recovery plan: 6/30/1991 |
Range: AL(m), AK(b), AZ(b), AR(m), CA(b), CO(b), CT(b), DE(b), DC(m), GA(b), ID(b), IL(b), IN(b), IA(b), KS(m), KY(b), LA(m), ME(b), MD(b), MA(b), MI(b), MN(b), MS(m), MO(m), MT(b), NE(b), NV(b), NH(b), NY(b), NM(b), NJ(b), NC(b), ND(m), OH(b), OK(m), OR(b), PA(b), RI(b), SC(b), SD(b), TN(b), TX(b), UT(b), VT(b), VA(b), WA(b), WV(m), WI(b), WY(b) ---
SUMMARY
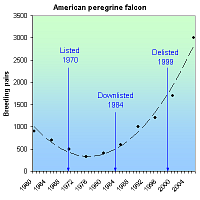
The use of DDT and other organochlorine pesticides thinned American peregrine falcon eggshells, causing reproductive failure and population declines. The banning of DDT, captive-breeding efforts and nest protections allowed falcons to increase from 324 breeding pairs in 1975 to 3,005 pairs as of 2006. The species was delisted in 1999.
RECOVERY TREND
The American peregrine falcon (Falco peregrinus anatum) breeds only in North and Central America and occurs throughout much of North America from the subarctic boreal forests of Alaska and Canada south to Mexico [1]. It is estimated that prior to the 1940s, there were approximately 3,875 nesting pairs of peregrines in North America [1]. From the 1940s through the 1960s, however, the population of the peregrine, and many other raptors, crashed as a result of the introduction of synthetic organochlorine pesticides to the environment. By 1975, there were only 324 known nesting pairs of American peregrine falcons in the U.S. [2].
Scientists investigating the peregrine's decline found unusually high concentrations of the pesticide DDT and its breakdown product DDE in peregrine falcons and other birds of prey [1]. Organochlorine pesticides were put into use following World War II. Use peaked in the late 1950s and early 1960s and continued through the early 1970s [1]. Organochlorine pesticides cause direct mortality and reduced reproduction in birds of prey because they ingest high doses of pesticides concentrated and stored in the fatty tissue of prey animals that themselves ingested contaminated food [1]. Heavily contaminated females may fail to lay eggs and organochlorines passed from the female to the egg can kill the embryo before it hatches [1]. DDE, the principal metabolite of DDT, prevents normal calcium deposition during eggshell formation, causing eggs to frequently break before hatching [1]. During the period of DDT use in North America, eggshell thinning and nesting failures were widespread in peregrine falcons, and in some areas, successful reproduction virtually ceased [1].
The degree of exposure to these pesticides varied among regions, and peregrine falcon numbers in more contaminated areas suffered greater declines [1]. The eastern population plunged from an estimated 350 active nest sites in the 1930s and 1940s to no active breeding birds from 1964 to 1975 [3]. Peregrine falcons in the Great Plains states east of the Rocky Mountains and south of U.S. and Canadian boreal forests were also essentially extirpated [1]. West of the 100th meridian, peregrine falcons were significantly reduced [1]. Local populations were greatly depressed or extirpated and by 1965 fewer than 20 pairs were known west of the U.S. Great Plains [1].
In 1970, the American peregrine was listed as endangered and efforts to recover the species began. The use of DDT was banned in Canada in 1970 and in the United States in 1972 [1]. This was the single-most significant action in the recovery of the peregrine falcon [1]. In addition, in the eastern United States, efforts were made to reestablish peregrine falcons by releasing offspring from a variety of wild stocks that were held in captivity by falconers [1]. The first experimental releases of captive-produced young occurred in 1974 and 1975 in the eastern United States [1]. These and future releases demonstrated that “hacking,” the practice of retaining and feeding young captive bred birds in partial captivity until they are able to fend for themselves, was an effective method of introducing captive-bred peregrines to the wild [1]. Since then, more than 6,000 falcons have been released in North America [1]. Approximately 3,400 peregrines were released in parts of southwest Canada, the northern Rocky Mountain States, and the Pacific Coast states [1].
In the late 1970s, Alaska became the first place American peregrine falcon population growth was documented and, by 1980, populations began to grow in other areas [1]. Not only did the number of peregrine falcons begin to increase, productivity (another important measure of population health) improved [1]. Efforts to reestablish peregrine falcons in the East and Midwest proved largely successful, leading to downlisting of the species in 1984 [1], and by 1999 peregrines were found to be nesting in all states within their historical range east of the 100th meridian, except for Rhode Island, West Virginia and Arkansas [1]. In highly urban areas, peregrine falcons showed great adaptability, and began substituting skyscrapers for natural cliff faces as nesting sites [4]. By 1998, the total known breeding population of peregrine falcons was 1,650 pairs in the United States and Canada, far exceeding the recovery goal of 456 pairs. Other recovery goals, including estimates of productivity, egg-shell thickness, and contaminants levels, had also been met, allowing the species to be delisted in 1999 [1]. Monitoring of American peregrine populations has continued under a post-delisitng monitoring plan [5]. The estimated North American population was 3,005 pairs as of 2006 [6].
ALASKA: Surveys conducted between 1966 and 1998 along the upper Yukon River demonstrated increases in the number of occupied nesting territories from a low of 11 known pairs in 1973 to 46 pairs in 1998 [1]. Similarly, along the upper Tanana River, the number of occupied nesting territories increased from two in 1975 to 33 in 1998 [1]. The recovery objective of 28 occupied nesting territories in the two study areas was first achieved in 1988, with 23 nesting territories on the Yukon River and 12 on the Tanana River [1].
PACIFIC STATES: By 1976, no American peregrine falcons were found at 14 historical nest sites in Washington [1]. Oregon had also lost most of its peregrine falcons and only one or two pairs remained on the California coast [1]. Surveys conducted from 1991 to 1998 indicated a steadily increasing number of American peregrine falcon pairs breeding in Washington, Oregon and Nevada [1]. Known pairs in Washington increased from 17 to 45 and in Oregon from 23 to 51 [1]. The number of American peregrine falcons in California increased from an estimated low of five to 10 breeding pairs in the early 1970s to a minimum of 167 occupied sites in 1998 [1]. The increase in California was concurrent with the restriction of DDT and included the release of more than 750 American peregrine falcons through 1997 [1].
ROCKY MOUNTAINS/SOUTHWEST: The Rocky Mountain/Southwest population of the American peregrine falcon has made a profound comeback since the late 1970s when surveys showed no occupied nest sites in Idaho, Montana or Wyoming and only a few pairs in Colorado, New Mexico and the Colorado Plateau, including parts of southern Utah and Arizona [1]. Surveys conducted from 1991 through 1998 indicated that the number of American peregrine falcon pairs in the Rocky Mountain/Southwest area has steadily increased [1]. In 1991, there were 367 known pairs; in 1998 the number of pairs increased to 535 [1].
EASTERN STATES: The eastern peregrine population has a unique history and complex status under the Act [1]. Peregrine falcons were extirpated in the eastern United States and southeastern Canada by the mid-1960s [1]. Releases of young captive bred peregrines have reestablished populations throughout much of their former range in the East [1]. In 1998, 193 pairs were counted in five designated eastern state recovery units [1]. The number of territorial pairs recorded in the eastern peregrine falcon recovery area increased an average of 10 percent annually between 1992 and 1998 [1]. Equally important, the productivity of these pairs during the same seven-year period averaged 1.5 young per pair, demonstrating sustained successful nesting [1].
CITATIONS
[1] U.S. Fish and Wildlife Service. 1999. Final Rule to Remove the American Peregrine Falcon from the Federal List of Endangered and Threatened Wildlife, and to Remove the Similarity of Appearance Provision for Free-Flying Peregrines in the Conterminous United States. Federal Register (64 FR 46542).
[2] Hoffman, C. 1999. The Peregrine Falcon is Back! New release, U.S. Fish and Wildlife Service, August 20, 1999.
[3] Clark, K. 2005. The Peregrine Falcon in New Jersey, Report for 2005. New Jersey Department of Environmental Protection, Division of Fish and Wildlife, Endangered and Nongame Species Program.
[4] New Jersey Division of Fish and Wildlife. Fact sheet, Peregrine Falcon Falco pereginus. New Jersey Department of Environmental Protection, Division of Fish and Wildlife, Endangered and Nongame Species Program. Website <http://www.njfishandwildlife.com/tandespp.htm> accessed February, 2006.
[5] U.S. Fish and Wildlife Service. 2003. Monitoring Plan for the American Peregrine Falcon, A Species Recovered Under the Endangered Species Act. U.S. Fish and Wildlife Service Division of Endangered Species and Migratory Birds and State Programs. Pacific Region, Portland Oregon 53pp.
[6] Green, M., T. Swem, M. Morin, R. Mesta, M. Klee, K. Hollar, R. Hazelwood, P. Delphey, R. Currie, and M. Aramal. 2006. Monitoring Results for Breeding American Peregrine Falcons (Falco peregrinus anatum), 2003. Biological Technical Publication BTP-R1005-2006. U.S. Department of Interior, Washington, D.C.
Arctic peregrine falcon (Falco peregrinus tundrius)
| Status: Delisted | Critical habitat: none | Listed: 6/2/1970 | Recovery plan: 6/30/1991 |
Range: AL(m), AK(b), AZ(m), AR(m), CA(m), CO(m), CT(m), DE(m), DC(m), FL(m), GA(m), ID(m), IL(m), IN(m), IA(m), KS(m), KY(m), LA(m), ME(m), MD(m), MA(m), MI(m), MN(m), MS(m), MO(m), MT(m), NE(m), NV(m), NH(m), NY(m), NM(m), NJ(m), NC(m), ND(m), OH(m), OK(m), OR(m), PA(m), RI(m), SC(m), SD(m), TN(m), TX(m), UT(m), VT(m), VA(m), WA(m), WV(m), WI(m), WY(m) ---
SUMMARY
The Arctic peregrine falcon declined due to the egg shell-thinning effects of DDT and other organochlorine pesticides. Its listing as an endangered species in 1970 (along with other birds of prey) prompted the EPA to ban DDT in 1972. Counts of migratory Arctic falcons increased from 103 in 1976, to 1,017 in 2004. The species was downlisted to threatened in 1984 and delisted in 1991.
RECOVERY TREND
The Arctic peregrine falcon (Falco peregrinus tundrius) is one of three peregrine falcon subspecies [1]. It nests in tundra regions of Alaska, Canada (Yukon, Northwest Territories, Quebec, and possibly Labrador), and the ice-free perimeter of Greenland [1]. It is a long-distance migrant that winters in Latin America from Cuba and Mexico south through Central and South America [1].
Severe declines in peregrine falcon numbers began in the 1950s [1]. These declines were linked to organochlorine pesticides that were put into use following World War II, and whose use peaked in the late 1950s-early 1960s [1]. Scientists investigating the peregrine's decline found unusually high concentrations of the pesticide DDT and its breakdown product DDE in peregrine falcons and other birds of prey [2]. Organochlorine pesticides cause direct mortality and reduced reproduction in birds of prey which, being at the top of the food chain, ingest high doses of pesticides concentrated and stored in the fatty tissue of prey animals that themselves ingested contaminated food [1]. Heavily contaminated females may fail to lay eggs and organochlorines passed from the female to the egg can kill the embryo before it hatches. DDE, the principal metabolite of DDT, prevents normal calcium deposition during eggshell formation, causing eggs to frequently break before hatching [1]. Arctic peregrine numbers reached their lowest levels in the early 1970s and in some areas of North America successful reproduction virtually ceased [1]. Populations are thought to have decreased by as much as 80 percent [2].
The listing of the Arctic peregrine falcon as endangered in 1970--as well as the bald eagle, brown pelican, and American peregrine falcon shortly before--fostered a national outcry against the production and spaying of DDT. In 1972, the Environmental Protection Agency banned most used of DDT in the United States [1]. Canada had already restricted DDT use in 1970. These restrictions are the central cause of the recovery of the Arctic and American peregrine falcons (the bald eagle and brown pelican benefited greatly as well, but their recovery also involved substantial habitat protections and reintroductions).
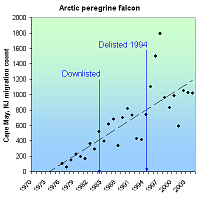
As DDT levels declined after 1972, peregrine falcon productivity rates rose to pre-DDT levels and the population size and range began to increase. This happened most rapidly in northern areas, where pesticide exposur was lower and impacts upon populations were less severe [1]. In 1984, the U.S. Fish and Wildlife Service downlisted the Arctic peregrine falcon from endangered to threatened status [2, 6]. In 1991, the agency initiated a review determine if the species had recovered [2] and in 1994 removed it from the endangered species list [6].
Four major factors were considered in the delisting process: (1) Population size and trend, (2) reproductive performance, (3) pesticide residues in eggs, and (4) eggshell thickness [1]. Despite a lack of long-term studies using consistent methodologies, there was strong evidence of significant population increases throughout the Arctic [1]. Four areas in northern North America (one in Alaska and three in Canada’s North West Territories) for which historical survey information was available indicated the number of Arctic peregrine pairs occupying nesting territories increased since the 1960s [1]. Some areas of Alaska even exceeded the original estimates of pre-DDT-era population size [1]. In addition, in the eastern Arctic, peregrines began nesting in previously vacant nesting sites [1]. Standardized yearly migration counts at New Jersey’s Cape May, an area where Arctic peregrines concentrate during migration, also saw increasing numbers, most likely from Arctic breeding grounds especially in Greenland and eastern Canada (these counts may have also contained peregrines in the American subspecies; however, banding recoveries indicate that the majority of peregrines along the East Coast during fall migration are from the Arctic and thus represent a true increase in Arctic peregrine numbers) [1].
Productivity in all regions where data had been gathered was sufficient to support a stable or increasing population since the 1980s [1]. There had also been improvements in levels of DDE concentration in eggs. Concentrations in excess of 15-20 parts per million (wet weight basis) are associated with high rates of nesting failure. Residue in eggs in 1993 was well below this critical level [1]. Alaskan eggshells collected between 1988 to 1991 were on average only 12 percent thinner than pre-DDT thickness (17 percent or greater reduction in thickness results in population declines).
Arctic peregrine falcon numbers have continued to rise after the species' delisting. On the Sagavanirktok River in Alaska, where Arctic peregrine surveys have been conducted since the late 1950s, the number of pairs increased from five in 1958, to 23 in 1992, to 25 in 1999 [3]. Migration counts at the Cape May Hawkwatch site in New Jersey increased from 103 in 1976 to 1,024 in 2003 [4].
CITATIONS
[1] U.S. Fish and Wildlife Service. 1993. Proposal to Remove the Arctic Peregrine Falcon From the List of Endangered and Threatened Wildlife. 58 Fed. Reg 188.
[2] U.S. Fish and Wildlife Service. 1995. Peregrine falcon, (Falco peregrinus anatum, Falco peregrinus tundrius, Falco peregrinus pealei). Species account. Website <http://www.fws.gov/species/species_accounts/bio_pere.html> accessed October, 2005.
[3] Wright, J.M. and P.J. Bente. 1999. Documentation of active peregrine falcon nest sites, 1 Oct 1994- 31 March 1998. Alaska Department of Fish and Game. Annual research report. Endangered species conservation fund federal aid project SE-2-9, 10, and 11. Juneau, AK. 15 pp.
[4] Cape May Bird Observatory. 2012. Cape May Hawkwatch, Cape May, New Jersey. New Jersey Audubon Society. Website <http://www.njaudubon.org/Sightings/cmhw25.html> accessed April 2, 2012.
[5] NatureServe. 2011. NatureServe’s Central Databases. Arlington, VA. U.S.A
[6] U.S. Fish and Wildlife Service. 1994. Removal of Arctic Peregrine Falcon From the List of Endangered and Threatened Wildlife. 59 Fed. Reg. 50796.
Bald eagle (continental U.S. DPS) (Haliaeetus leucocephalus (Continental U.S. DPS))
| Status: Delisted | Critical habitat: none | Listed: 3/11/1967 | Recovery plan: 5/18/1999 |
Range: AL(b), AZ(b), AR(b), CA(b), CO(b), CT(b), DE(b), DC(b), FL(b), GA(b), ID(b), IL(b), IN(b), IA(b), KS(b), KY(b), LA(b), ME(b), MD(b), MA(b), MI(b), MN(b), MS(b), MO(b), MT(b), NE(b), NV(b), NH(b), NY(b), NM(b), NJ(b), NC(b), ND(b), OH(b), OK(b), OR(b), PA(b), RI(b), SC(b), SD(b), TN(b), TX(b), UT(b), VT(b), VA(b), WA(b), WV(b), WI(b), WY(b) ---
SUMMARY
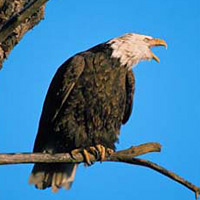
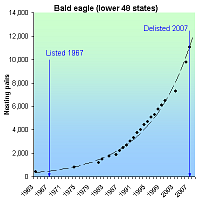
The bald eagle declined throughout the lower 48 states, and was extirpate from most of them due to habitat loss, persecution, and DDT-related eggshell thinning. The banning of DDT, increased wetland protection and restoration, and an aggressive, mostly state-based reintroduction program caused eagle pairs to soar from 416 in 1963 to 11,052 in 2007 when the eagle was removed from the endangered list.
RECOVERY TREND
The bald eagle (Haliaeetus leucocephalus) first declined in the 1800s at the hands of trophy hunters, feather collectors, and wanton killing [1]. It was already extirpated or at low numbers in most states by the 1940s when DDT and other organochlorines became widely used. DDE, a breakdown product of DDT, accumulates in the fatty tissue of female eagles, impairing the formation of calcium needed for normal egg formation, causing a decline in reproductive success. DDT caused eagle numbers plummet further, and in 1967 the species was listed as endangered in the lower 48 states [1].
The eagle was joined on the list by the American peregrine falcon, Arctic peregrine falcon and brown pelican in 1970. The listing of these large, charismatic birds rallied the nation to band the production and sale of DDT in 1972.
Due to the DDT ban, increased habitat protection, and aggressive captive breeding and translocation programs (mostly run by state wildlife agencies), bald eagle pairs in the lower 48 soared from 416 in 1963 to 11,052 in 2007 when it was removed from the threatened species list [2, 7]. In 1984, 13 states lacked nesting eagles. By 1998, it was absent from only two. By 2006, it nested in all 48 states [7].
The eagle was proposed for delisting in 1998 [1] and again in 2006 [4]. It was downlisted in 1995 and delisted in 2007 [6].
The bald eagle is managed under five federal recovery plans, divided by region:
Chesapeake Recovery Region: Virginia east of Blue Ridge Mountains, Delaware, Maryland, the eastern half of Pennsylvania, West Virginia Panhandle and two-thirds of New Jersey. Delisting goals were met in 1996 [1]. As of 2003, there were more than 800 nesting pairs in this region [4].
Northern States Recovery Region: 25 Northernmost states. Delisting goals were met in 1991, with 1,349 occupied breeding areas across 20 states. As of 2007, there were an estimated 4,215 breeding pairs in the northern recovery region [6].
Pacific Recovery Region: Idaho, Nevada, California, Oregon, Washington, Montana and Wyoming. Numeric delisting goals were met in 1995 [1]. As of 2001, there were
1,627 nesting pairs in this recovery region [4].
Southeastern Recovery Region: Alabama, Arkansas, Florida, Georgia, Kentucky, Louisiana, Mississippi, North Carolina, South Carolina, Tennessee and eastern Texas. Downlisting goals were met between 1991 and 1998. More than 1,700 pairs were counted in 2000 [4, 6].
Southwestern Recovery Region: Oklahoma and Texas west of the 100th meridian, New Mexico, Arizona and California bordering the Lower Colorado River. The goal established in the recovery plan has been exceeded. In 2003, 46 occupied breeding areas were reported in New Mexico and Arizona. In 2004, the Arizona had 41 occupied breeding areas [4].
In the eight Northeast states from New Jersey to Maine and Vermont, nesting eagle pairs increased from 21 in 1967 to 562 in 2005 [5]. The majority were in Maine, which supported all 21 pairs in 1967 and 385 pairs in 2005. Eagles returned to Massachusetts and New Hampshire in 1990, with the former supporting 19 pairs in 2005 and the latter eight in 2004. In 2005 there were 53 pairs in New Jersey, 94 in New York and one in Vermont. The Northeast is also an important wintering area, with the Connecticut population increasing from 20 to 92 between 1979 and 2005, and the New York population increasing from six to 194 between 1978 and 2006 [5].
CITATIONS
[1] U.S. Fish and Wildlife Service. 1999. Proposed rule to remove the bald eagle in the Lower 48 states from the list of endangered and threatened wildlife. Federal Register, July 6, 1999 (64 FR 36453)
[2] U.S. Fish and Wildlife Service. 2007. Bald Eagle Numbers Soaring. May 14, 2007 press release.
[4] U.S. Fish and Wildlife Service. 2006. Removing the bald eagle in the Lower 48 States from the list of endangered and threatened wildlife; reopening of public comment period with new information. Federal Regiter, February 16, 2006 (71 FR 8238).
[5] Center for Biological Diversity. 2006. Bald eagle trends in the Northeastern United States. Tucson, AZ.
[6] U.S. Fish and Wildlife Service. 2007. Removing the Bald Eagle in the Lower 48 States From the List of Endangered and Threatened Wildlife; Final Rule. 72 Fed. Reg 37346.
[7] Suckling, K. and W. Hodges. Status of the bald eagle in the lower 48 states and the District of Columbia: 1963-2007. Center for Biological Diversity, Tucson, AZ. Available at http://www.biologicaldiversity.org/species/birds/bald_eagle/report/index.html.
Bighorn sheep (Peninsular Ranges DPS) (Ovis canadensis pop. 2)
| Status: Endangered | Critical habitat: 2/1/2001 | Listed: 3/18/1998 | Recovery plan: 10/25/2000 |
Range: CA(b) ---
SUMMARY
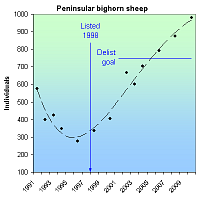
The Peninsular bighorn sheep declined to near extinction because of housing developments, agriculture, collisions with cars, predation by mountain lions and diseases contracted from domestic sheep. Sheep populations plummeted from 971 in 1971, to 276 in 1996, but since being listed as endangered in 1998, the number of bighorns has increased to 981 as of 2010.
RECOVERY TREND
The Peninsular bighorn sheep is a distinct population of bighorn (Ovis canadensis) that is restricted to east-facing, lower elevation slopes (typically below 4,600 feet) of the Peninsular Ranges along the northwest edge of the Sonoran Desert in southern California. Though populations occur in Mexico, the species is only listed as endangered from the San Jacinto Mountains south to the U.S.-Mexico border. It has declined due to loss of habitat to agriculture and housing development, car collisions, predation by mountain lions, diseases contracted from domestic sheep, disturbance by humans and dogs, fire suppression, and spread of exotic plants such as tamarisk [1]. It was listed as an endangered species in 1998. Critical habitat was designated on 844,897 acres in 2001, but was reduced to 376,938 acres in 2009 [3].
The historic population size is unknown, but the species was considered "rare" in 1971 when it was estimated at 971 animals [1]. The highest recent population was 1,171 animals in 1974 and 1979. The population plummeted to 276 in 1996 but following listing, increased to 981 as of 2010 [4]. Approximately 100 peninsular bighorn are captive-bred and used to augment the wild population [2].
CITATIONS
[1] U.S. Fish and Wildlife Service. 2000. Recovery Plan for bighorn sheep in the Peninsular Ranges, California. United States Fish and Wildlife Service, Portland, OR. 251 pp.
[2] Bighorn Institute. 2005. Endangered Peninsular Bighorn Sheep, website (www.bighorninstitute.org/endangered.htm) accessed September 30, 2005.
[3] U.S. Fish and Wildlife Service. 2009. Designation of Critical Habitat for Peninsular Bighorn Sheep and Determination of a Distinct Population Segment of Desert Bighorn Sheep (Ovis canadensis nelsoni), Final Rule. 74 FR 17288.
[4] U.S. Fish and Wildlife Service. 2011. Peninsular bighorn sheep (Ovis canadensis nelsoni) 5 Year Review: Summary and Evaluation. Carlsbad, CA.
Blue whale (Balaenoptera musculus)
| Status: Endangered | Critical habitat: none | Listed: 6/2/1970 | Recovery plan: 10/23/1998 |
Range: AK(s), CA(s), FL(o), HI(s), ME(o), MD(o), MA(o), NH(o), NY(o), NC(o), OR(m), RI(o), SC(o), WA(m) ---
SUMMARY
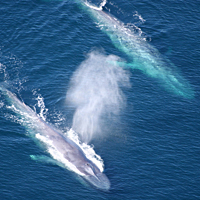
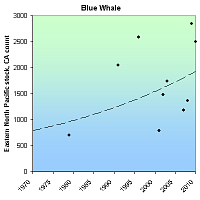
The blue whale population was reduced by as much as 99 percent due to whaling that occurred before the mid-1960s. The number of whales reported off the coast of California, the largest stock in U.S. waters, increased from 704 in 1980 to an estimated 2,497 in 2010.
RECOVERY TREND
The blue whale (Balaenoptera musculus) is the largest animal ever known to have lived on Earth [1]. Blue whales are found in all oceans worldwide and are separated into populations from the North Atlantic, North Pacific and Southern Hemisphere [1]. Each population is composed of several stocks that typically migrate between higher-latitude summer feeding grounds and lower-latitude wintering areas. The largest numbers of blue whales in U.S. waters are within the eastern North Pacific stock. Other U.S. stocks occur in waters off the coast of Hawaii and the Northeast [1].
Pre-whaling blue whale populations had about 350,000 individuals [3]. In 1868, the invention of the exploding harpoon gun made the hunting of blue whales possible and in 1900, whalers began to focus on blue whales and continued until the mid 1960s [1, 3]. During this time, it is estimated that whalers killed up to 99 percent of blue whale populations [3]. Currently, there are about 5,000-10,000 blue whales in the Southern Hemisphere and about 3,000-4,000 in the Northern Hemisphere [3]. Current threats include collisions with vessels, entanglement in fishing gear, reduced zooplankton production due to habitat degradation, and disturbance from low-frequency noise [1]. The offshore driftnet gillnet fishery is the only fishery likely to take blue whales, but few mortalities or serious injuries have been observed [2].
EASTERN NORTH PACIFIC STOCK
The Eastern North Pacific Stock feeds in waters off the coast of California from June to November and then migrates south to Mexico (sometimes going as far south as Costa Rica) in winter/spring [2]. Recently, blue whales seen off the coast of Alaska were photo-matched to photos from the Southern California area, indicating that California animals now migrate as far north as Alaska [4]. This is probably a reestablishment of a traditional migratory route [4]. The number of whales reported off the coast of California increased from 704 in 1979/80 to 2497 in 2010 [2, 11]. It is not certain if the overall increasing trend indicates a growth in the size of the stock, or just increased use of California waters [2], but in general, the stock is thought to have increased [1]. Because this is the largest stock in U.S. waters, it dominates the trend of the species in U.S. waters.
WESTERN NORTH PACIFIC STOCK
Blue whales feeding along the Aleutian Islands are probably part of a central western North Pacific stock that is thought to migrate to offshore waters north of Hawaii in winter [5]. Sightings of blue whales in Hawaiian waters are infrequent, although acoustic recordings indicate that blue whales occur there. There are no estimates of population size for this stock [5]. No blue whales were sighted during aerial surveys of Hawaiian waters conducted from 1993 to 1998 or during shipboard surveys conducted in the summer/fall of 2002 [5]. In 2004, three blue whales were seen in the western Aleutians, the first U.S. sightings of blue whales from this western North Pacific population in several decades [6]
NORTH ATLANTIC STOCK
The blue whale is an occasional visitor along the Atlantic coast of the Northeast [7]. Sightings of blue whales off Cape Cod, Mass., in summer and fall may represent the southern limit of the feeding range of the western North Atlantic stock that feeds primarily off the Canadian coast [7]. Blue whales have been sighted as far south as Florida, however, and the actual southern limit of this stock’s range is unknown [7]. Because blue whales are not frequently seen in U.S. Atlantic waters, there are insufficient data to determine the stock's population trend [7]. In 1997, the total number of photo-identified individuals for eastern Canada and New England was 352 [1].
CITATIONS
[1] NMFS. 1998. Recovery plan for the blue whale (Balaenoptera musculus). Prepared by Reeves R.R., P.J. Clapham, R.L. Brownell, Jr., and G.K. Silber for the National Marine Fisheries Service, Silver Spring, MD. 42 pp.
[2] NOAA Fisheries. 2004. Stock Assessment Report. Blue Whale (Balaenoptera musculus): Eastern North Pacific Stock. Revised 3/15/05. National Oceanic and Atmospheric Administration, Washington, D.C.
[3] American Cetacean Society. 2005 American Cetacean Society Fact Sheet: Blue Whale (Balaenoptera musculus). Website http://www.acsonline.org/factpack/bluewhl.htm (accessed on 11/30/05).
[4] NOAA. Fisheries. 2004. NOAA Scientists Sight Blue Whales in Alaska. Press Release 7/27/2004.
[5] NOAA Fisheries. 2004. Stock Assessment Report. Blue Whale (Balaenoptera musculus): Western North Pacific Stock. Revised 3/15/05. National Oceanic and Atmospheric Administration, Washington, D.C.
[6] Rankin, Barlow and Stafford. (in press) Marine Mammal Science.
[7] NOAA Fisheries. 2002. Stock Assessment Report. Blue Whale (Balaenoptera musculus): Western North Atlantic Stock. Revised Jan. 2002. National Oceanic and Atmospheric Administration, Washington, D.C
[8] NOAA Fisheries. 2007. Stock Assessment Report. Blue Whale (Balaenoptera musculus): Eastern North Pacific Stock. National Oceanic and Atmospheric Administration, Washington, D.C.
[9] NOAA Fisheries. 2008. Stock Assessment Report. Blue Whale (Balaenoptera musculus): Eastern North Pacific Stock. National Oceanic and Atmospheric Administration, Washington, D.C.
[10] NOAA Fisheries. 2009. Stock Assessment Report. Blue Whale (Balaenoptera musculus): Eastern North Pacific Stock. National Oceanic and Atmospheric Administration, Washington, D.C.
[11] NOAA Fisheries. 2010. Stock Assessment Report. Blue Whale (Balaenoptera musculus): Eastern North Pacific Stock. National Oceanic and Atmospheric Administration, Washington, D.C.
California bighorn sheep (Sierra Nevada DPS) (Ovis canadensis sierrae)
| Status: Endangered | Critical habitat: 8/5/2008 | Listed: 4/20/1999 | Recovery plan: 9/24/2007 |
Range: CA(b) ---
SUMMARY
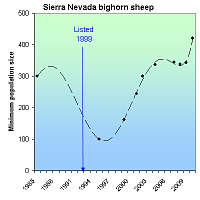
The Sierra Nevada big horn sheep declined due to hunting, disease, introduction of domestic sheep, habitat loss and disturbance. It's historic population of more than 1,000 sheep declined to 300 in 1985 and 100 in 1995 prior to its emergency listing as an endangered species in 1999. Since then its population increased to at least 420 in 2010.
RECOVERY TREND
The Sierra Nevada bighorn sheep (Ovis canadensis sierrae) formerly included 20 subpopulations on the eastern slope of California's Sierra Nevada, and at least one subpopulation on the western slope [1]. The historic population size is not well known, but has been estimated at 1,000 or more individuals [5]. It began declining in the mid-1800s due to hunting, disease and the introduction of domestic sheep. About half the subpopulations were gone by the early 1900s. The species continued dwindling to five populations in the 1950s and two in the 1970s [2].
The population was estimated at 250 in 1978 on Mount Williamson, Mount Baxter, and Sawmill Canyon, and 300 in 1985 (mostly In Mount Baxter and Sawmill Canyon) [1, 3, 4]. Thereafter it plunged to a historic low of 100 in 1995. After being listed as endangered in 1999 on an emergency basis, the bighorn's population increased to a minimum of about 350 in 2004, remained at this level through 2009, then increased to 420 in 2010 [5, 6, 7].
CITATIONS
[1] U.S. Fish and Wildlife Service. 2003. Draft Recovery Plan for the Sierra Nevada Bighorn Sheep. U.S. Fish and Wildlife Service, Portland, Oregon. xiii + 147 pp.
[2] U.S. Fish and Wildlife Service. 2000. Final rule to list the Sierra Nevada Distinct Population Segment of the California Bighorn Sheep as Endangered. U.S. Fish and Wildlife Service, January 3, 2000 (65 FR 20).
[3] Sierra Nevada Bighorn Sheep Foundation. 2000. Sierra Nevada Bighorn Population Status, Census Work 1995 On. www.sierrabighorn.org/endanger/population_status.htm
[4] Sierra Nevada Bighorn Sheep Foundation. 2002. Sierra Nevada Bighorn Sheep 2002 Update, Herds Continue to grow. www.sierrabighorn.org/endanger/2002%20update.htm
[5] U.S. Fish and Wildlife Service. 2007. Recovery Plan for Sierra Nevada Bighorn Sheep. Portland, OR. xiv + 199 pp.
[6] U.S. Fish and Wildlife Service. 2008. Sierra Nevada Bighorn Sheep Ovis canadensis californiana (=Ovis canadensis sierrae) 5-Year Review: Summary and Evaluation. Portland, OR. 41 pp.
[7] Stephenson, T. R., et al. 2012. 2010-2011 Annual Report of the Sierra Nevada Bighorn Sheep Recovery Program: A Decade in Review. California Department of Fish and Game.
California brown pelican (Pelecanus occidentalis californicus )
| Status: Delisted | Critical habitat: none | Listed: 10/13/1970 | Recovery plan: 2/3/1983 |
Range: AZ(o), CA(b), OR(s), WA(s) ---
SUMMARY
The California brown pelican declined due to habitat loss, reproductive failure from DDT-related eggshell thinning and toxic exposure to the pesticide endrin. It was listed as endangered in 1970, but continued declining to a low of 466 pairs in 1978. Since then, it as increased, though inconsistently, reaching 11,695 nesting pairs when delisted in 2009. The banning of DDT and protection of nesting areas, especially in Channel Islands National Park, are responsible for its recovery.
RECOVERY TREND
The California brown pelican’s (Pelecanus occidentalis californicus) breeding range extends from California's Channel Islands south along the Pacific coast to Baja California, eastward throughout most of the Gulf of California, and southward along the mainland Pacific coast of Mexico to Islas Tres Maria [1]. It formerly bred as far north as Point Lobos in Monterey County. Currently, U.S. nesting colonies are located on West Anacapa and Santa Barbara islands of the California Channel Islands. The nesting range recently expanded to the Salton Sea [1]. As non-breeders, pelicans occur from southern British Columbia to El Salvador and inland in the U.S. to Southern California and Arizona.
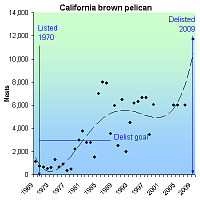
The California nesting population declined from 1,125 to 727 annual nests between 1969 and 1970 when the species was placed on the list of endangered species [1]. The primary cause of decline was exposure to the pesticides endrin, which caused pelican mortality, and DDT, which caused egg-shell thinning. The Channel Island population was particularly impacted by a single Los Angeles factory which began discharging 200 to 500 kilograms of DDT daily in 1952.
DDT was banned in 1972, in large part because of the endangered species listing of the pelican, bald eagle and peregrine falcon. Following the ban, the pelican’s reproductive success began to improve quickly, although breeding effort did not show significant improvement until the early 1980s [3]. With the exception of a good year in 1974, the number of nests remained at low levels through 1978 when a low of 466 nests was recorded. Between 1979 and 1987, the population rose rapidly to 7,900 nests. Between 1987 and 2004, the number of nests fluctuated around a mean of about 5,000 nests. The 2004 nest count was about 7,500 (6,000 on West Anacapa and 1,500 on Santa Barbara Island). The 2006 nest count was about 9,000 with nesting on all three Anacapa islands (4,000 to 5,000), Santa Barbara Island (4,000) and Prince Island (43) [5]. 2006 was the first year since monitoring began that breeding occurred on all three Anacapa islands and the first time since 1939 that breeding occurred on Prince Island. In 1996, a small population of pelicans began nesting in the Salton Sea and has been present in most years since.
The California brown pelican was delisted in 2009 due to recovery, at which time there were 11,695 nesting pairs [7].
CITATIONS
[1] Shields, M. 2002. Brown Pelican (Pelecanus occidentalis). In The Birds of North America, No. 609 (A. Poole and F. Gill, eds.). The Birds of North America, Inc., Philadelphia, PA.
[2] Rogers, T. 2004. Spate of juvenile deaths follows breeding success. San Diego Union Tribune, August 1, 2004.
[3] Harrison, S.C. 2005. Petition to Delist the California Brown Pelican From the Listed of Endangered or Threatened Species Under the Endangered Species Act. Hunton & Williams, Washington, D.C., December 14, 2005.
[4] U.S. Fish and Wildlife Service. 2006. 90-Day Finding on a Petition to Delist the California Brown Pelican and Initiation of a 5-Year Review for the Brown Pelican. Federal Register, May 24, 2006 (71 FR 29908-29910).
[5] Broddrick, L.R. 2006. October 6, 2006 memorandum from L. Ryan Broddrick, Director, California Department of Fish and Game to John Carlson, Jr., Executive Director, California Fish and Game Commission, "Subject: Request of Endangered Species Recovery Council to delist the California brown pelican (Pelecanus occidentalis californicus) under the California Endangered Species Act."
[6] U.S. Fish and Wildlife Service. 2007. 5-Year Review of the Listed Distinct Population Segment of the Brown Pelican (Pelecanus occidentalis). Albuquerque, NM.
[7] U.S. Fish and Wildlife Service. 2009. Removal of the Brown Pelican (Pelecanus occidentalis) From the Federal List of Endangered and Threatened Wildlife. Federal Register, November 17, 2009 (74 FR 59444-59472).
California condor (Gymnogyps californianus)
| Status: Endangered | Critical habitat: 9/24/1976 | Listed: 3/11/1967 | Recovery plan: 4/25/1996 |
Range: AZ(b), CA(b) --- NV(x), OR(x), UT(x), WA(x)
SUMMARY
The California condor was nearly driven extinct by DDT, lead poisoning from ingested bullet fragments, and hunting. Lead poisoning remains a major threat to the species. Wild condors declined to nine birds by 1985. A captive-breeding and release program has increased the population to 386 birds as of 2012, including 213 wild and 173 captive birds.
RECOVERY TREND
The California condor (Gymnogyps californianus) is a member of the vulture family and one of the largest flying birds in the world [1]. Ten-thousand years ago, its range extended across most of North America, but by the arrival of Europeans, its range was largely restricted to the Pacific Coast from British Columbia south to Baja California. By 1940, it was found only in the coastal mountains of Southern California where it nested in the rugged mountains and scavenged in the foothills and grasslands of the San Joaquin Valley. It was listed as an endangered species in 1967 and was given critical habitat the same year.
The condor's decline was driven by DDT which compromised reproduction, poisoning fromlead poisoning, shooting, collection, and drowning in uncovered oil sumps [1].
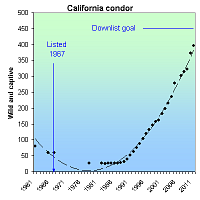
About 600 birds remained in 1890 [1, 2, 3]. It declined to about 60 birds in the late 1930s and early 1940s, 40 in the early 1960s, 27 in 1978, and nine in 1985. All remaining wild birds were taken into captivity in 1987. Since then, a successful captive breeding and reintroduction program increased the 2005 wild population to 121 and the captive population to 158 [2, 3].
The California Department of Fish and Game reports 302 condors in 2007; 315 in 2008; 322 in 2009; 373 in 2010; and 396 in 2011 [4].
The California condor now occurs in three wild populations: in mountains north of the Los Angeles basin, in the Big Sur area of the central California coast, and near the Grand Canyon in Arizona [1].
CITATIONS
[1] U.S. Fish and Wildlife Service. 1996. California Condor Recovery Plan, Third Revision. Portland, Oregon. 62 pp.
[2] California Department of Fish and Game. 2005. California condor population size and distribution. Available at: http://www.dfg.ca.gov/hcpb/species/t_e_spp/tebird/Condor%20Pop%20Stat.pdf
[3] U.S. Fish and Wildlife Service. 2005. Condor population history. Hopper Mountain National Wildlife Refuge Complex. Available at: http://www.fws.gov/hoppermountain/cacondor/Pophistory.html.
[4] Ventana Wildlife Society. 2012. California Condor Recovery Program, Population Size and Distribution updates. Available at: http://www.ventanaws.org/pdf/Status_Reports/2012/Status_Report_February_2012.pdf.
California least tern (Sternula antillarum browni)
| Status: Endangered | Critical habitat: none | Listed: 6/2/1970 | Recovery plan: 6/30/2001 |
Range: CA(b) ---
SUMMARY
California least tern populations crashed in the late 19th century due to collection by the millinery trade. 20th century declines were driven by development, recreational crowding at beaches, and anthropogenically-exacerbated predation by wildlife. By 1970 when the tern was listed as endangered, just 225 pairs remained. Intensive habitat protection, predator control, and recreation management increased the tern to its overall delisting goal of 1,200 pairs in 1988 and to 6,568 pairs in 2010.
RECOVERY TREND
The California least tern (Sterna antillarum browni) nests in colonies on the Pacific coast of California and Baja, Mexico on relatively open beaches where vegetation is limited by tidal scouring [1]. It was formerly found in great abundance from Moss Landing, Monterey County, Calif. to San Jose del Cabo, southern Baja California, Mexico. It declined in the 19th and early 20th centuries due to the millinery trade that hunted birds for their feathers for women's hats, but to a lesser degree than many East Coast birds. The Migratory Bird Treaty Act of 1916 ended the threat, but the least tern plummeted again some decades later due to growing development and recreational pressures that destroyed habitat, disturbed birds, and increased predation by introduced and native species. The construction of the Pacific Coast Highway brought all these threats to much of California's coast. By the 1940s, terns were extirpated from most beaches of Orange and Los Angeles counties and were considered sparse elsewhere. To avoid humans, some tern colonies nest at inland mudflat and dredge fill sites, which appears to make them more susceptible to predation by foxes, raccoons, cats and dogs.
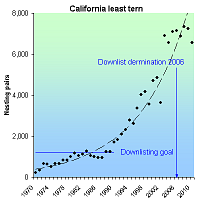
When placed on the endangered species list in 1970, just 225 nesting tern pairs were recorded in California [2]. Protection of nest beaches from development and disturbance, and active predator control programs allowed the species to steadily increase to about 7,100 pairs in California in 2004 [2, 5]. A portion of the increase in the 1970s is attributable to expansion and greater consistency in survey effort, but the greatest increases occurred from 1980 to the present. In 2004, 57 percent of nesting pairs occurred in San Diego County, 26 percent in Los Angeles and Orange counties, 10 percent in Ventura County, 1 percent in San Louis Obispo and Santa Barbara counties, and 6 percent in the San Francisco Bay [3]; the largest sites were at Camp Pendleton (21 percent), U.S. Navy lands at San Diego Bay (16 percent), Los Angeles Harbor, Pier 400 (15 percent), Point Mugu (8 percent), Alameda Point (6 percent), Batiquitos Lagoon Ecological Reserve (6 percent), Huntington State Beach (5 percent), and Tijuana Estuary (5 percent). Since 2005, the population has remained relatively static at about 7,000 pairs. In 2010 there were 6,568 pairs [8,9].
The U.S. Fish and Wildlife Service recovery plan for the California least tern was issued in 1980 and revised in 1985 [1]. Its downlisting and delisting criteria incorporate the total population size, number of colonies, geographic distribution, population viability, and management status. To be downlisted to "threatened" status, the tern must have at least 1,200 breeding pairs distributed in at least 15 "secure" management areas. Each of these management areas must have at least one viable colony. The San Francisco Bay, Mission Bay and San Diego Bay management areas must have at least three, five, and four viable colonies respectively. To be viable, a colony must have at least 20 breeding pairs, a three-year mean reproduction rate of >= 1.0 fledglings/pair, and be fully protected under a long-term management plan. This would require a minimum of 24 viable colonies. To be recovered and delisted, the tern must have at least 1,200 breeding pairs distributed in at least 20 "secure" management areas. Each of these management areas must have at least one viable colony with a mean five-year reproduction rate of >= 1.0 fledglings/pair. The San Francisco Bay, Mission Bay and San Diego Bay management areas must have at least four, six, and six viable colonies respectively. This would require a minimum of 33 viable colonies.
The total population size of 1,200 breeding pairs for downlisting and delisting was reached in 1988 and all subsequent years. The downlisting criterion of 24 colonies was met in 1996 and all subsequent years. The delisting criterion of 33 colonies was met in 2003 and 2004. However, neither the downlisting nor delisting requirements for distribution and viability have been met. While human disturbance has been managed with fencing at most nesting areas, protection from native and non-native predators will require permanent management commitments to ensure continuing viability after the species is recovered and delisted [3].
In 2006, the U.S. Fish and Wildlife Service issued a five-year review recommending the downlisting of the California least tern [5]. It acknowledged that all the downlisting criteria had not been achieved, but asserted that the recovery criteria were out of date. The downlisting recommendation was opposed by the Service biologist who prepared the five-year review [6].
CITATIONS
[1] U.S. Fish and Wildlife Service. 1985. Recovery Plan for the California Least Tern, Sterna Antillarum Browni. U.S. Fish and Wildlife Service, Portland, Oregon. 112pg.
[2] Keane, K. 2005. California least tern monitoring 1969-2004. Spreadsheet provided by Kathy Keene, Keane Biological Consulting, Long Beach, CA on July 25, 2005.
[3] Keane Biological Consulting. 2004. Breeding Biology of the California Least Tern in the Los Angeles Harbor, 2004 Breeding Season. Prepared for the Port of Los Angeles, Environmental Management Division, under contract with the Port of Los Angeles, Agreement No. 2316.
[4] U.S. Fish and Wildlife Service. 2001. Draft revised recovery plan for the California least tern. U.S. Fish and Wildlife Service, Carlsbad, CA.
[5] U.S. Fish and Wildlife Service. 2006. California least tern (Sterna antillarum browni) 5-year review summary and evaluation. U.S. Fish and Wildlife Service, Carlsbad, CA.
[6] Pagel, J. 2006. Letter from Joel Pagel, U.S. Fish and Wildlife Service, to Scott Sobiech, U.S. Fish and Wildlife Service, dated August 23, 2006.
[7] Suckling, K. 2007. Personal observation, Kieran Suckling, Center for Biological Diversity, Tucson, AZ, October 1, 2007.
[8] Keane, K, N. Mudry and S. Langdon. 2011. Status Of The Endangered California Least Tern: Population Trends And Indicators For The Future. Presentation to the Least Tern Working Group annual meeting January 7, 2011.
[9] Marschalek, D. 2011. California Least Tern Breeding Survey 2010 Season. Available online at http://nrm.dfg.ca.gov/FileHandler.ashx?DocumentVersionID=59326, accessed September 13, 2011.
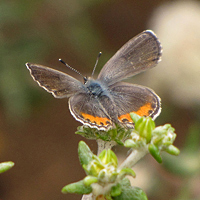
El Segundo blue butterfly (Euphilotes battoides allyni)
| Status: Endangered | Critical habitat: none | Listed: 6/1/1976 | Recovery plan: 9/28/1998 |
Range: CA(b) ---
SUMMARY
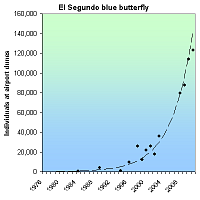
The El Segundo blue butterfly lost approximately 90 percent of its oceanside habitat to construction of the Los Angeles Airport and a housing development. The remaining habitat was highly degraded and overtaken by exotic plants that crowded out its host. The butterfly declined from about 1,000 individuals in the late 1970s, when listed as an endangered species, to about 500 in 1984 before being saved by restoration efforts that steadily increased the population at the Airport Dunes to 123,000 in 2011.
RECOVERY TREND
The El Segundo blue butterfly (Euphilotes battoides ailyni) formerly extended over much of the 3,200-acre El Segundo Dunes of Los Angeles County, Calif. The dunes ranged from Ocean Beach (near Santa Monica) south to Magala Cove in Palos Verdes and were bordered on the west by the Pacific Ocean and the east by Los Angeles coastal prairie.
The El Segundo blue occupied areas within the dunes with high sand content and its obligate host plant, coast buckwheat (Eriogonum parvifolium). The historic population size likely averaged 750,000 butterflies per year [2]. The prairie has since been entirely converted to an urban landscape and the dunes reduced to about 307 mostly degraded acres. The extent of habitat loss peaked, and El Segundo blue numbers likely reached their nadir, in the late 1970s, when virtually all of the dunes were developed or degraded.
Restoration efforts were initiated in the 1980s. Virtually all remaining potential habitat was protected from private development due to geological, conservation and other restrictions by 1990 and was believed to be capable of supporting 100,000 butterflies if fully restored [2]. However, governmental development, especially by the city of Los Angeles and the Los Angeles Airport (LAX) is still a significant threat [4].
AIRPORT DUNES
To end a long conflict with its neighbors, LAX condemned and removed 822 homes from 200 acres on its western border between 1966 and 1975 [2]. The airport has alternately sought to restore and destroy El Segundo blue habitat on the site. In 1975, about 70 percent of the back dune was excavated and recaptured to realign Pershing Drive [2]. The area was reseeded with California buckwheat (Eriogonum fasciculatum), which attracted competing nonnative moths and butterflies, suppressing El Segundo blue numbers. The foredune to the south and west, and last fragment of coastal prairie, were graded during this same period. Only about 40 of the 200 acres escaped degradation during the 1970s. The impacts extirpated 17 of 20 native mammals, seven of 31 butterfly species, seven of 18 amphibians and reptiles, and all five coastal scrub obligate birds [2]. Twenty-two of 73 native species present in 1940 were absent in 1989 and 19 of 51 of extant native plants were represented by fewer than 100 individuals [1].
The El Segundo blue was placed on the federal endangered species list in 1976. LAX proposed developing the dunes as a recreational site with a 27-hole golf course and a 92-acre butterfly preserve in 1982 [2]. In 1985 the California Coastal Commission refused to issue a permit for the project. In the late 1990s, LAX proposed to extend runway into the dunes [1]. In 1987 the city of Los Angeles initiated efforts to reduce California buckwheat and increase coast buckwheat populations. In 1992, the city of Los Angeles established a 203-acre Habitat Restoration Area within the dunes. In response, the population rose from approximately 400-700 in 1984 to about 123,000 in 2011 in response to the habitat restoration actions [1, 2, 3, 5, 6, 7].
CHEVRON BUTTERFLY PRESERE
The 1.6-acre Chevron butterfly preserve has been isolated by development since the 1950s [1]. It is estimated to have supported about 2,000 butterflies from 1965 to 1976 [2]. The population dropped to 1,600 in 1977, 681 in 1979, 400 in 1986 [2]. The decline may have been caused by dune stabilization or lepidopterists crisscrossing the small site, using a capture-release method that can harm butterflies, and removing 839 butterfly larvae for study [2]. In 1986, the preserve had 240 host plants and 1,000 introduced seedlings [2]. The 1996 population was estimated at 5,000 to 7,000 butterflies on 1,200 host plants [1]. The population increase has been attributed to intensive management for the El Segundo blue [1].
MALAGA COVE
The El Segundo blue population was discovered on an eroded and iceplant dominated site in Malaga Cove in 1983 [2]. It had 60 butterflies and fewer than 50 host plants on 1 acre in 1984 [2]. It was fenced in 1986 [2]. Host plants and butterfly populations in 1990 were similar to the 1984 count [2]. The site was degraded by illegal dumping in 1997 [1]. In 2004 it supported 10-30 butterflies [3]. An adjacent population was discovered in 2000 in coastal bluff scrub habitat at York Long Point [3].
BALLON WETLANDS
A single male was reported but not captured at a potentially suitable six-acre private land site within Ballona Wetlands in 1985 [2]. Fifteen host plants but no butterflies were found there on a small dune fragment in 1986 [2]. By 1989 half the plants were dead [2]. A seven-acre site was seeded with native plants in 1990 but was significantly disturbed by a lagoon restoration project in 1997 [1]. The U.S. Fish and Wildlife Service issued a permit to reintroduce the species prior to 1990, but the program has not been carried out [2].
HYPERION
A single butterfly was observed in the late 1980s near a remnant dune on a 30-acre site east of the Hyperion sewage treatment plan [1]. The site was extensively planted with exotic vegetation in 1995 by the cities of El Segundo and Los Angeles [1].
CITATIONS
[1] U.S. Fish and Wildlife Service. 1998. El Segundo Blue (Euphilotes battoides allyni) Recovery Plan. U.S. Fish and Wildlife Service, Portland, OR.
[2] Mattoni, R. 1990. The endangered El Segundo blue butterfly. Journal of Research on the Leptidoptera 29(4):277-304.
[3] Mattoni, R., T. Longcore, C. Zonneveld and V. Novotny. 2001. Analysis of transect counts to monitor population size in endangered insects: the case of the El Segundo blue butterfly, Euphilotes battoides allyni. Journal of Insect Conservation 5:197-206.
[4] Rich, C. 2003. Letter from Catherine Rich, Executive Director, The Urban Wildlands Group, to Cindy Miscikowski, Los Angeles Councilwoman, August 4, 2003.
[5] Los Angeles World Airports. 2012. LAX’s 2011 El Segundo blue butterfly population count increases eight percent over previous year. Press release available at http://www.lawa.org/newsContent.aspx?ID=1547
[6] Sapphos Environmental, Inc. 2005. LAX Master Plan Final EIS, Appendix A-3c: Los Angeles/El Segundo Dunes Habitat Restoration Plan. Los Angeles World Airports, U.S. Department of Transportation, and Federal Aviation Administration.
[7] Los Angeles World Airports. 2011. LAX’s El Segundo blue butterfly count increases thirty percent over 2009. Press release available at http://vny.aero/newsContent.aspx?ID=1394 [8] Marroquin, A. 2009. Once-endangered El Segundo blue butterfly now thrives. DailyBreeze.com July 29. 2009. Available at http://news.duneguide.com/2009_07_01_archive.html
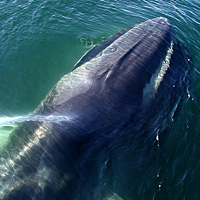
Fin whale (Balaenoptera physalus)
| Status: Endangered | Critical habitat: none | Listed: 6/2/1970 | Recovery plan: 7/30/2010 |
Range: AL(o), AK(s), CA(s), CT(s), DE(s), FL(s), GA(s), HI(s), LA(o), ME(s), MD(s), MA(s), MS(o), NH(s), NY(s), NJ(s), NC(s), OR(s), PA(s), RI(s), SC(s), TX(o), VA(s), WA(s) ---
SUMMARY
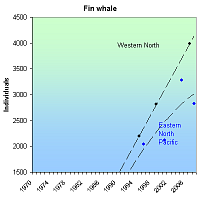
Fin whales were hunted in all the world's oceans for the first three-quarters of the 20th century, causing population decline. Ongoing threats include illegal and legal whaling, vessel collisions, fishing gear entanglement, reduced prey and noise. Total population size is unknown, but both the North Atlantic and North Pacific populations increased between 1995 and 2009.
RECOVERY TREND
Fin whale (Balaenoptera physalus) populations in the North Atlantic, North Pacific and southern oceans mix rarely, if at all. For management purposes, the North Pacific is divided into three stocks: 1) the California/Oregon/Washington stock, 2) the Hawaii stock and 3) the Alaska stock [2]. A western North Atlantic stock inhabits U.S. waters along northeastern coasts [3]. Most groups are thought to migrate seasonally, in some cases over large distances [1]. They feed at high latitudes in summer and move to low latitudes in winter. Some groups move over shorter distances and may be resident to areas with a year-round supply of adequate prey.
Fin whales were hunted, often intensively, in all the world's oceans for the first three-quarters of the 20th century [1]. From 1947 to 1987, approximately 46,000 fin whales were taken from the North Pacific [2]. Commercial whaling did not end until 1976 in the North Pacific and 1987 in the North Atlantic. The current status of fin whale populations relative to pre-whaling levels is uncertain.
In the North Pacific, pre-whaling populations were estimated to be between 42,000 and 45,000 [2]. By 1973, the North Pacific population is thought to have been reduced to 13,620-18,680 — less than 38 percent of historic carrying capacity [2].
California/Oregon/Washington Stock
The California/Oregon/Washington stock of the North Pacific is thought to be increasing [5]. Fin whale acoustic signals are detected year-round off Northern California, Oregon and Washington, with a concentration of vocal activity between September and February [2]. Fin whales increased in abundance along the California coast between 1979 and 1996, and based on ship surveys in 2001, they continued to increase. Populations appeared to be increasing monotonically from 1991 to 2001 [5]. In 2001, 3,279 (CV= 0.31) were estimated in California, Oregon and Washington coastal waters [2]. The 2008 population was estimated at 2,825 whales [9].
Alaskan Stock
Since 1999, information on abundance of fin whales in Alaskan waters has improved and although the full range has not yet been surveyed, a rough estimate of the size of the population west of the Kenai Peninsula is 5,703 [6]. Surveys conducted in 1999 and 2000 in the central-eastern Bering Sea and southeastern Bering Sea provided provisional estimates of 3,368 (CV = 0.29) and 683 (CV = 0.32), respectively [6]. One aggregation of fin whales spotted in 1999 involved more than 100 animals [6]. Because historical abundance information is lacking, population trends are difficult to determine [6].
Hawaiian Stock
Fin whales are rare in Hawaiian waters and the stock is thought to be quite small [7]. Over the course of 12 aerial surveys conducted within about 25 nautical miles of the main Hawaiian Islands in 1993-98, only one fin whale was sighted [7]. More recent acoustic data suggest that fin whales migrate into Hawaiian waters mainly in fall and winter [7]. In 2002, a ship survey of the entire Hawaiian Islands resulted in an abundance estimate of 174 (CV=0.72) fin whales [7].
Western North Atlantic Population
Western North Atlantic fin whales off the eastern U.S. coast north to Nova Scotia and the southeastern coast of Newfoundland are considered a single stock [3]. New England waters represent a major feeding ground, and calving is thought to take place along mid-Atlantic U.S. latitudes from October to January. The locations used for calving, mating and wintering for most of the population remains unknown. It is likely that fin whales occurring in the U.S. Atlantic undergo migrations into Canadian waters, open-ocean areas, and perhaps even subtropical or tropical regions. An abundance of 2,200 (CV=0.24) fin whales was estimated from a 1995 line-transect sighting survey that covered waters from Virginia to the mouth of the Gulf of St. Lawrence. A 1999 estimate of 2,814 (CV=0.21) fin whales, currently considered the best estimate for the western North Atlantic stock, was derived from a line-transect sighting covering waters from Georges Bank to the mouth of the Gulf of St. Lawrence [3]. The best estimate of population for this stock in 2007 is 3,985 whales [8]. Although there is little data on population trends, the minimum population estimate reported in NOAA Fisheries Stock Assessment Reports has steadily increased since 1992.
The main direct threat to fin whales today is the possibility of illegal whaling or a resumption of legal whaling [1]. In 2006, Japan announced that it would expand hunts to include fin whales [4]. It expected to harvest 10 fin whales from Antarctic waters [4]. Collisions with vessels, entanglement in fishing gear, reduced prey abundance due to overfishing and habitat degradation, as well as disturbance from low frequency noise, are also potential threats [1]. The offshore drift gillnet fishery is the main fishery likely to take fin whales [2].
CITATIONS
[1] National Marine Fisheries Service. 1998. Draft Recovery Plan for the Fin Whale (Balaenoptera physalus) and Sei Whale (Balaenoptera Borealis). Silver Spring, MD.
[2] NOAA Fisheries. 2005. Stock Assessment Report. North Atlantic Right Whale (Eubalaena glacialis): Western Stock revised Dec., 2004. National Oceanic and Atmospheric Administration, Washington, D.C.
[3] NOAA Fisheries. 2004. Stock Assessment Report. Fin Whale (Balaenoptera physalus): Western North Atlantic stock. Revised Dec. 2004. National Oceanic and Atmospheric Administration, Washington, D.C.
[4] Hans Greimel, Associated Press. 2005. Japan To Double Usual Whale Kill in New Antarctic Hunt, Expanded To Include Fin Whales. Nov. 9, 2005.
[5] Barlow, J. 2003. Preliminary Estimates of the Abundance of Cetaceans along the U.S. West Coast: 1991-2001 Southwest Fisheries Science Center Administrative Report LJ-03-03. Available at <http://swfsc.nmfs.noaa.gov/prd/PROGRAMS/CMMP/default.htm>.
[6] NOAA Fisheries. 2004. Stock Assessment Report. Fin Whale (Balaenoptera physalus): Northeast Pacific stock. Revised 10/21/2004.
[7] NOAA Fisheries. 2005. Draft Stock Assessment Report. Fin Whale (Balaenoptera physalus): Hawaiian stock. Revised 3/15/2005.
[8] NOAA Fisheries. 2010. Stock Assessment Report. Fin Whale (Balaenoptera physalus): Western North Atlantic Stock. Revised 11/2010.
[9] NOAA Fisheries. 2011. 2010 Stock Assessment Report. Fin Whale (Balaenoptera physalus): California/Oregon/Washington stock. Revised 1/15/2011.
Gray whale (Eastern North Pacific DPS) (Eschrichtius robustus pop. 3)
| Status: Delisted | Critical habitat: none | Listed: 6/2/1970 | Recovery plan: none |
Range: AK(b), CA(b), OR(b), WA(b) ---
SUMMARY
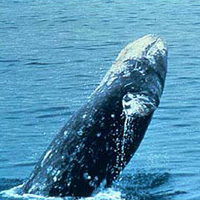
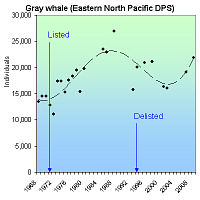
Gray whales declined precipitously due to whaling, becoming extinct in the Atlantic, endangered in the Eastern North Pacific and extremely endangered in the Western North Pacific. They are threatened by oil and gas drilling and coastal development. In 1968, there were 13,426 Eastern North Pacific gray whales. The species was was listed as endangered in 1970 and removed from the list in 1994 when the population reached 20,103 whales. The 2009 population was estimated to be 21,911.
RECOVERY TREND
The Eastern North Pacific gray whale (Eschrichtius robustus) migrates along the West Coast from summer feeding grounds in the Bering and Chukchi seas to nearly landlocked lagoons and bays along the west coast of Baja California where calves are born from early January to mid-February [2].
It historic population size has been estimated at about 19,500 [1] based on log books and historical accounts [4]. However, recent genetic analysis indicates a historic population on the order of 96,000 whales (76,000–118,000) [3].
Early indigenous whaling impacts were likely substantial to this near-shore species, especially to resident populations [4], but have not been quantified. The added pressure of commercial whaling however, drove the species to near extinction in the 19th and 20th centuries. Between 1846 and 1900, commercial whalers killed nearly 9,000 gray whales and indigenous hunters about 6,000 [1]. After 1900, the two groups killed another 11,500 whales, for a total of 27,000 between 1846 and 1946.
Commercial whaling was prohibited in 1946 and indigenous whaling was greatly reduced. At the time of its listing as an endangered species in 1970, the gray whale was extinct in the Atlantic, at low levels in the Eastern North Pacific, and at extremely low levels in the Western North Pacific [2].
Between 1968 and 1988, the Eastern North Pacific gray whale grew from 13,426 whales to a post-exploitation peak of 26,916 [1]. It declined to 20,103 whales by 1994 when it was delisted, remained stable for a few years, and then declined again to about 16,000 whales in 2001 and 2002. These declines were preceded by an unprecedented number of whale strandings in 1999 (273) and 2000 (355), greatly exceeding the previous average (38). The stranding were also unusual in being dominated by adults and subadults (>60%) rather than calves. The whales were visibly emaciated, possibly due to poor feeding conditions (i.e. extensive ice cover) in their wintering grounds.
Recent population estimate are in dispute. The 2010 reanalysis cited for all population numbers in this account [1], indicates the stock grew to 21,911 whales in 2009.
The Western North Pacific gray whale remains listed as an endangered foreign species. It has not recovered since listing and today is comprised of less than 100 whales which are highly endangered by oil and gas drilling proposals in Asia and Russia.
CITATIONS
[1] Punt, A.E. and P.R. Wade. 2010. Population Status of the Eastern North Pacific Stock of Gray Whales in 2009. U.S. Dep. Commer., NOAA Tech. Memo. NMFS-AFSC-207, 43 p.
[2] National Marine Fisheries Service. 1994 Final Rule to Remove the Eastern North Pacific Population of the Gray Whale From the List of Endangered Wildlife. 59 Fed. Reg. 31094.
[3] Alter, S.E., E. Rynes and S.R. Palumbi. 2007. DNA evidence for historical population size and past ecological impacts of gray whales. Proceedings of the National Academy of Sciences 104:15162–15167.
[4] Pyenson, N.D. and D.R. Lindberg. 2011. What Happened to Gray Whales during the Pleistocene? The Ecological Impact of Sea-Level Change on Benthic Feeding Areas in the North Pacific Ocean. PLoS ONE 6(7): e21295. doi:10.1371/journal.pone.0021295.
Gray wolf (Northern Rockies DPS) (Canis lupus (Northern Rockies DPS))
| Status: Endangered | Critical habitat: none | Listed: 3/11/1967 | Recovery plan: 8/3/1987 |
Range: ID(b), MT(b), eastern OR(b), eastern WA(b), WY(b), northern UT(o)
SUMMARY
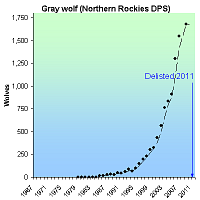
Gray wolves were purposefully hunted, trapped and poisoned to near extinction in the western United States, often by the federal government or with the encouragement of private and state bounties. By 1973, no wild wolves remained in the region. They were listed as endangered in 1967 and began recolonizing the Northern Rocky Mountains from Canada in the early 1980s. Due to prohibition of killing, habitat protection, and reintroductions, the population grew rapidly, was downlisted in 2003, reached 1,679 wolves by 2009, and was delisted in 2011.
RECOVERY TREND
The Northern Rocky Mountains gray wolf (Canis lupus pop.) historically occurred throughout Idaho, the eastern third of Washington and Oregon, all but the northeastern third of Montana, the northern two-thirds of Wyoming, and the Black Hills of South Dakota [1]. As early American settlers began moving west, populations of the gray wolf’s important prey species were over-hunted, causing the wolves to resort to hunting sheep and cattle. As a result, bounty hunting of wolves began in the 19th century and continued through as late as 1965. Around the turn of the century some population control measures were attempted in Yellowstone National Park that led to increased numbers of gray wolves in the area. In response, however, people began killing large numbers of wolves [1]. Beginning in 1912 a minimum of 136 wolves and 80 pups were killed each year and by 1920, only 30 to 40 wolves persisted in this area [1]. By 1973, gray wolves were exterminated from the western lower 48 states and existed only in northeastern Minnesota and Isle Royal, Mich. [2].
Protection of gray wolves was not initiated until the enactment of the Endangered Species Act. By this time gray wolves no longer occurred in the western United States except for the occasional dispersion of Canadian animals into Montana and Idaho that failed to survive long enough to reproduce [3]. Successful recolonization of gray wolves into the Rocky Mountain region did not occur until the early 1980s. Around this time, the Rocky Mountain Gray Wolf Recovery Team was organized with the intent of developing standard observation methods for studying and monitoring the wolves. In 1987, a recovery plan was published. Around this time, the status of the Rocky Mountain Gray wolf was still quite precarious. In Montana, from 1985 to 1986 roughly 15 to 20 wolves were believed to occur near Glacier National Park. In Wyoming from 1982 to 1985, 15 wolves were reported at Yellowstone National Park, and the same number were believed to occur in Idaho in 1986 [1].
Regular monitoring of the Rocky Mountain gray wolf population did not occur until 1995, at which time there were an estimated 14 wolves in Montana and 15 in greater Yellowstone. By 2000, there were an estimated 65 wolves in Montana, 118 in Yellowstone, and 141 in central Idaho [4]. In 2004, a recovery update of the Rocky Mountain gray wolf was released, providing information regarding the status of the gray wolf at three designated recovery areas: the Northwestern Montana Recovery Area (NWMT) in Montana and the Northern Idaho panhandle; the Greater Yellowstone Area (GYA), which includes Wyoming and adjacent parts of Idaho and Montana; and the Central Idaho (CID) area covering central Idaho and adjacent parts of southwest Montana. As of 2004, 16 packs containing 59 wolves were documented at NWMT [3]. In the GYA, 171 wolves in 16 packs inhabited the Wyoming portion and 17 packs occurred in the Montana region. In the CID 64 wolves in 40 groups and as individuals were monitored [3]. The total population of free ranging Rocky Mountain Gray wolves for 2004 was estimated at 59 in Montana, 324 in Greater Yellowstone, and 422 in Central Idaho. In 2005 population estimates were 93, 294, and 525 respectively [4]. In 2009 the population of wolves in the Northern Rockies was about 1,679, up from 1,545 in 2007 and 1,300 in 2006 [4].
The U.S. Fish and Wildife Service delisted the Northern Rockies gray wolf in 2008, but the decision was objected to by conservationists who argued that the recovery plan goal was outdated, and insufficient to remove the threat of extinction because it did not require a large enough or well-connected enough wolf meta-population. In 2011, with encouragement from the Department of Interior, Congress for the first time in the history of the Endangered Species Act, overruled the courts and order the delisting of the Northern Rockies gray wolf without biological or legal review [7].
CITATIONS
[1] U. S. Fish and Wildlife Service. 1987. Northern Rocky Mountain Wolf Recovery Plan. U.S. Fish and Wildlife Service. Denver, CO. 119pp
[2] U. S. Fish and Wildlife Service. 2004. Gray Wolf. U.S. Fish and Wildlife Service. Revised May, 2004.
[3] U.S. Fish and Wildlife Service, Nez Perce Tribe, National Park Service, Montana Fish, Wildlife and Parks, Idaho Fish and Game, and USDA Wildlife Services. 2005. Rocky Mountain Wolf Recovery 2004 Annual Report. U.S. Fish and Wildlife Service, Helena, MT. 72pp. Available at <http://westerngraywolf.fws.gov/annualreports.htm>
[4] International Wolf Center. 2011. Gray Wolf Population Trends in the Contiguous United States. Website <http://www.wolf.org/wolves/learn/wow/regions/United_States_Subpages/Biology1.asp> Accessed October 6, 2011..
[5] U.S. Fish and Wildlife Service. 2006. Designating the Northern Rocky Mountain Population of Gray Wolf as a Distinct Population Segment; Removing the Northern Rocky Mountain Distinct Population Segment of Gray Wolf From the Federal List of Endangered and Threatened Wildlife. Federal Register, February 8, 2006 (71 FR 6634-6660).
[6] U.S. Fish and Wildlife Service. 2007. U.S. Fish and Wildlife Service data cited by Brad Knickerbocker, Gray wolves may lose US protected status, Christian Science Monitor, Febraury 1, 2007.
[7] U.S. Fish and Wildlife Service. 2011. Endangered and Threatened Wildlife and Plants; Reissuance of Final Rule To Identify the Northern Rocky Mountain Population of Gray Wolf as a Distinct Population Segment and To Revise the List of Endangered and Threatened Wildlife. 76 Fed. Reg. 26086.
Guadalupe fur seal (Arctocephalus townsendi)
| Status: Threatened | Critical habitat: none | Listed: 12/16/1985 | Recovery plan: none |
Range: CA(b) ---
SUMMARY
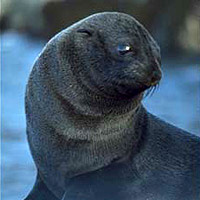
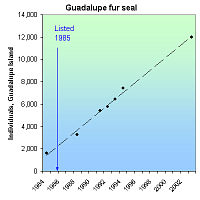
The Guadalupe fur seal was largely extirpated from California in the 1800's due to hunting; it was thought extinct until a bull was seen on San Nicholas Island, California in 1949, and 14 seals were found on Guadalupe in 1954. Since listing, seals have recolonized the U.S. and have been seen in the Channel and Farallon Islands with increasing regularity since the 1980s. The population on Guadalupe Island increased from 1,600 in 1984 to 12,000 in 2003.
RECOVERY TREND
The precise historic range of the Guadalupe fur seal (Arctocephalus townsendi) is not known because early fur traders did not distinguish it from the northern fur seal. It may have extended from the Revillagigedo Islands of Mexico north to Monterey Bay, California and possibly the Farallon Islands. Historic breeding colonies likely existed on California’s San Miguel and San Nicolas Islands.
The historic population was between 20,000 and 100,000 [1], but collapsed rapidly under European hunting pressure. In the three years between 1808-1810, 130,000 seals were killed [3]. By the end of the nineteenth century, populations were so depleted that just 5,575 seals were killed in a 16-year hunting period (1876-1892) [3]. The species was extirpated from California by 1825 and from Isla Benito del Este, Mexico sometime in the 19th century [4]. Only seven seals were found on its Guadalupe Island, Mexico stronghold in 1892. All known seals (15) were killed there in 1894; 35-60 were rediscovered in 1926, but virtually all were killed in 1928. The species was believed extinct until a bull was seen on San Nicholas Island, California in 1949, and 14 seals were found on Guadalupe in 1954 [3].
The Guadalupe Island population has grown steadily since 1954, reaching approximately 12,000 in 2003 [2].
Isla Benito del Este was recolonized by the Guadalupe population sometime between 1984 and 1988 when several bulls were observed hauling out but not breeding [2]. Breeding was first recorded in 1997 when nine pups and 247 non-pups were observed [4]. By 2004, the Isla Benito del Este popuation reached 648 [2].
Seals have also recolonized the United States, being seen in the Channel and Farallon Islands with increasing regularity since the 1980s. In 1997, a pup was born on San Miguel Island.
Individuals are now occasionally sighted as far south as Tapachula near the Mexico/Guatemala border, and as far north as the Point Reyes National Seashore in California, and in the Gulf of California.
CITATIONS
[1] NOAA Fisheries. 2000. Stock Assessment Report: Guadalupe Fur Seal (Arctocephalus townsendi), revised December 15, 2000. National Oceanic and Atmospheric Administration, Washington, D.C.
[2] Gallo-Reynoso J.P., M.O. Maravilla Chávez and A.L. Figueroa Carranza. 2004. La población del lobo fino de Guadalupe, Arctocephalus townsendi, en México. VII Congreso Nacional de Mastozoología, 8-12 de Noviembre de 2004. San Cristóbal de Las Casas, Chiapas. México.
[3] Gilbert, L.R. and R. Hilborn. 2001. Catastrophic events and recovery from low densities in populations of otarriids: implications for risk of extinction. Mammal Review 31(2):131-150.
[4] Gallo-Reynoso, J.P. 2005. Personal communication with Juan Pablo Gallo-Reynoso, Laboratorio de Ecofisiologí, CIAD, Unidad Guaymas.
Humpback whale (Megaptera novaeangliae)
| Status: Endangered | Critical habitat: none | Listed: 6/2/1970 | Recovery plan: 11/15/1991 |
Range: AL(o), AK(s), CA(s), CT(s), DE(s), FL(s), GA(s), HI(s), LA(o), ME(s), MD(s), MA(s), MS(o), NH(s), NY(s), NJ(s), NC(s), OR(s), RI(s), SC(s), TX(o), VA(s), WA(s) ---
SUMMARY
Humpback whale populations were greatly depleted by commercial whaling by the early 1900s. In 1966, the entire North Pacific humpback population was thought to number only around 1,200 animals. As of 2010, the total population of North Pacific humpback was estimated at 21,808.
RECOVERY TREND
Humpback whales (Megaptera novaeangliae) occur in all oceans of the world, generally inhabiting waters over continental shelves, along continental edges and around some oceanic islands [1]. They winter in warm waters in a few specific locations and mate and give birth on wintering grounds where little feeding is thought to take place [1]. For the summer season, they migrate to high-latitude areas where they tend to stay relatively close to shore (although some groups inhabit deeper water) and spend the majority of their time feeding [1].
Humpback whale populations were greatly depleted by commercial whaling [1]. Prior to whaling, humpback whale numbers are thought to have exceeded 125,000 [1]. American whalers alone killed between 14,164 and 18,212 humpback whales between 1805 and 1909 [1]. Humpback whales first received protection in the North Atlantic in 1955 when the International Whaling Commission placed a prohibition on non-subsistence whaling by member nations [1]. Protection was extended to the North Pacific and southern hemisphere populations following the 1965 hunting season [1]. Although hunting has largely been stopped (some exceptions exist that allow the take of a limited number of whales), and populations appear to be increasing, human impacts such as vessel collisions and entanglements are factors that may be slowing the recovery of the humpback whale population [3].
The total level of human-caused mortality and serious injury is unknown, but data indicate that it is significant [3]. Humpback whales are also vulnerable to marine pollution [2]. The increasing levels of anthropogenic noise in the world’s oceans, such as that produced by certain types of sonar, may also be problematic for whales, particularly for baleen whales that communicate using low-frequency sound [4].
GULF OF MAINE, WESTERN NORTH ATLANTIC STOCK
There are likely six stocks within the western North Atlantic humpback population [3]. A feeding aggregation in the Gulf of Maine (considered a single stock) is the only one U.S. waters [3]. Within New England waters, humpbacks are present in spring, summer and autumn [3]. They spend much of their time feeding and their distribution in this region has been largely correlated to prey species and abundance [3]. In winter, humpbacks from the different western Northern Atlantic feeding areas mate and calve primarily in the West Indies, where spatial and genetic mixing among subpopulations occurs [3]. From late December to early April most of the population is found at Silver and Navidad Banks at the end of the Bahamian archipelago, and along the coast of the Dominican Republic [1]. They are also found at much lower densities throughout the remainder of the Antillean arc, from Puerto Rico to the coast of Venezuela [3]. The only U.S.-controlled portions of the breeding range include waters along the Northwest coast of Puerto Rico and the U.S. Virgin Islands [1]. Not all of the stock migrates to the West Indies every winter, however, and significant numbers of animals are found in mid- and high-latitude regions during the winter months [3]. There have recently been a number of wintertime humpback sightings in coastal waters of the southeastern U.S. [3].
North Atlantic humpback numbers are thought to be slowly increasing. An average increase of 1 percent (SE=0.005) was estimated for the period 1979 to 1993 [3]. The best estimate of the number of North Atlantic humpbacks in 1992 and 1993 was 11,570 (CV=0.069) [3]. Data suggest that the Gulf of Maine humpback whale stock is also steadily increasing in size at a rate consistent with the larger population [3]. The Gulf of Maine minimum population was estimated to be 501 in 1992 and 647 in 1999 [3]. Both of these estimates are likely low due to sampling technique [3]. The best estimate of the actual number of animals is thought to be 902 [3].
NORTH PACIFIC
Historic summering range for the North Pacific humpback whales encompassed coastal and inland waters around the Pacific rim from Point Conception, Calif. north to the Gulf of Alaska and the Bering Sea, and west along the Aleutian Islands, Kamchatka Peninsula and into the Sea of Okhotsk [1]. Rough estimates of the pre-whaling population speculate that there were around 15,000 humpbacks in the North Pacific [1]. In 1966, the entire North Pacific humpback population was thought to number only around 1,200 animals [4]. This estimate increased to between 6,000 and 8,000 by 1992 [4]. Although these estimates are uncertain and are based on different methods, the 6 percent to 7 percent growth rate implied is consistent with the observed growth rate of the better-studied eastern North Pacific subpopulation [4].
Although the International Whaling Commission only considered North Pacific humpbacks to be one stock, there is now good evidence for multiple stocks in the North Pacific [4]. There are at least three relatively separate populations that migrate between their respective summer/fall feeding areas and winter/spring calving and mating areas; the eastern North Pacific stock, the central North Pacific stock and the western North Pacific stock [4]. These divisions are a simplification, however, and are not perfect. In general, interchange occurs (at low levels) between breeding areas, although fidelity is extremely high among the feeding areas [4].
The eastern North Pacific stock spend much of their lives within U.S. waters [1]. They winter in coastal Central America and Mexico, migate along the U.S. West Coast, and summer in British Columbia [4]. Mark-recapture population estimates increased steadily from 1988/90 to 1997/98 at about 8 percent per year [4]. Surveys of humpback whale abundance in feeding areas in California, Oregon and Washington conducted from 1991 to 2002 show a steady upward trend with the exception of a large decline in 2000 [5]. The 2002 to 2003 population estimate (1,391, CV=0.22) was higher than any previous estimate and may indicate that the lower numbers in 1999 to 2001 exaggerated any real decline that might have occurred [5]. It could also indicate that a real decline was followed by an influx of new whales from another area [4]. This latter view was substantiated by a greater fraction of new whales seen for the first time in 2003 [4].
The central North Pacific stock, in general, winters around the Hawaiian Islands (some go to Mexico) and migrates to northern British Columbia/Southeast Alaska and Prince William Sound west to Kodiak [6]. Three feeding areas for the Central North Pacific stock have been studied using photo-identification techniques; these include southeastern Alaska, Prince William Sound and Kodiak Island [6]. There has been some exchange of individual whales between these locations, although the aggregation in southeastern Alaska seems to remain relatively isolated from other groups [6]. The current total estimated abundance for this stock is 4,005 individuals [7]. The abundance of the Prince William Sound feeding aggregation is thought to be fewer than 200 whales [6]. In the Kodiak region, 127 individual whales were identified between 1991 and 1994 and abundance was estimated to be 651 (95 percent CI: 356-1,523) [6]. The number of animals in the Southeast Alaska aggregation is thought to have increased [6]. The 2000 estimate of 961 is substantially higher than estimates from the 1980s, which put numbers in the high 300s [6]. In a 2004 report, an annual population rate of increase was calculated to be 10 percent [6]. Another study, based on aerial surveys conducted across the main Hawaiian Islands, and designed specifically to estimate trends in the Central Pacific Stock, found an annual increase of 7 percent from 1993 to 2000 [8]. In 2006, the Southeast Alaska population reached 1,115 [10].
The western North Pacific stock is the least studied of the Northern Pacific populations [9]. This aggregation winters off Japan and probably migrates to waters west of the Kodiak Archipelago (the Bering Sea and Aleutian Islands) in summer/fall [9]. Recent surveys in the central-eastern and southeastern Bering Sea in 1999 and 2000 resulted in humpback whale sightings suggesting that the Bering Sea is an important feeding area [9]. New information indicates that humpback whales from the western and Central North Pacific stocks mix on summer feeding grounds in the central Gulf of Alaska and perhaps the Bering Sea [9]. A major research effort (the SPLASH project) was initiated in 2004 in order to better delineate stock structure of humpback whales in the North Pacific [9]. There are no reliable estimates for the abundance of humpback whales in the western Pacific stock because surveys of the known feeding areas are incomplete, and not all feeding areas are known [9].
The 2010 estimate of abundance of humpback whales in the entire North Pacific Basin based on a Chapman-Petersen estimate is 21,808 (CV=0.04) [10].
CITATIONS
[1] National Marine Fisheries Service. 1991. Recovery Plan for the Humpback Whale (Megaptera novaeangliae). Prepared by the Humpback Whale Recovery Team for the Silver Spring, Maryland. 105pp.
[2] NatureServe. 2005. NatureServe’s Central Databases. Arlington, VA. U.S.A.
[3] NOAA Fisheries. 2005. Stock Assessment Report. Humpback Whale (Megaptera novaeangliae): Gulf of Maine Stock, revised Dec. 2004. National Oceanic and Atmospheric Administration, Washington, D.C.
[4] NOAA Fisheries. 2005. Stock Assessment Report. Humpback Whale (Megaptera novaeangliae): Eastern North Pacific Stock, revised May 15, 2005. National Oceanic and Atmospheric Administration, Washington, D.C.
[5] Calambokidis J., T. Chandler, L. Schlender, G.H. Steiger, and A. Douglas. 1995-2000. Final reports to Monterey Bay, Channel Islands, and Olympic Coast National Marine Sanctuaries, Southwest Fisheries Science Center, and University of California at Santa Cruz. Cascadia Research, 218 1/2; W Fourth Ave., Olympia, WA 9850. Accessed at http://www.cascadiaresearch.org/abstracts/abstract.htm.
[6] NOAA Fisheries. 2005. Stock Assessment Report. Humpback Whale (Megaptera novaeangliae): Central North Pacific Stock, revised Feb 12, 2005. National Oceanic and Atmospheric Administration, Washington, D.C.
[7] NOAA Fisheries, Office of Protected Resources. Cetaceans: Whales, Dolphins, and Porpoises. Humpback Whale. Website <http://www.nmfs.noaa.gov/pr/species/mammals/cetaceans/humpback_whale.doc> accessed January, 2005.
[8] Mobley J. Jr., S. Spitz, and R. Grotefendt. 2001. Abundance of Humpback Whales in Hawaiian Waters: Results of 1993-2000 aerial surveys. Hawaiian Islands Humpback Whale National Marine Sanctuary Office of National Marine Sanctuaries. National Oceanic and Atmospheric Administration U.S. Dept of Commerce. Available at <http://hawaiihumpbackwhale.noaa.gov/research/HIHWNMS_Research_Mobley.pdf>.
[9] NOAA Fisheries. 2005. Stock Assessment Report. Humpback Whale (Megaptera novaeangliae): Western North Pacific Stock, revised Feb 5, 2005. National Oceanic and Atmospheric Administration, Washington, D.C.
[10] NOAA Fisheries. 2010. Draft Stock Assessment Report. Humpback Whale (Megaptera novaeangliae): Central North Pacific Stock, revised Jan 28, 2010. National Oceanic and Atmospheric Administration, Washington, D.C.
Inyo California towhee (Pipilo crissalis eremophilus)
| Status: Threatened | Critical habitat: 8/3/1987 | Listed: 8/3/1987 | Recovery plan: 4/10/1998 |
Range: CA(b) ---
SUMMARY
The Inyo California towhee occurs in a single, arid mountain range in Southern California. Its habitat was degraded by cattle, feral horses, burros, off-road vehicles, campers and hikers. It was listed endangered with critical habitat in 1987. Its population remained between 100-200 birds from 1978-1992, then began increasing in response to habitat protection efforts, reaching 741 in 2007. It reached its 400-bird numeric delisting goal in the mid-1990s. In 2008 it was declared recovered.
RECOVERY TREND
The Inyo California towhee (Pipilo crissalis eremophilus) inhabits the west and east slope of the southern Argus Range (from Wilson Canyon and Indian Joe Canyon northward to Bendire Canyon) at elevations ranging from 2,680 feet to 6,200 feet [2]. Approximately 68 percent of its range is within the China Lake Naval Air Weapons Station (NAWS), 26 percent is administered by the Bureau of Land Management (BLM), 5 percent is administered by the California Department of Game and Fish, and less than 1 percent is privately owned. Within this range, the towhee breeds in relatively small and sometimes isolated patches of dense thickets of willows and desert olive (Forestiera pubescens) along stream sides, springs and seeps [2]. It forages in the adjacent arid uplands.
The primary threat to the towhee has been the destruction of its habitat by cattle, feral horses and burros, off-road vehicles, campers, and hikers [1]. All of these threats have been substantially reduced since the species was placed on the federal endangered species list in 1987. Fire has recently become a localized threat, but the magnitude of its impact is unknown [10].
The Inyo California towhee population is believed to have been relatively stable (100 to 200 birds) between 1978 and 1987 [1, 3, 4] and between 1992 and 1995 (about 200 birds) [1]. A comprehensive 1998 survey located 640 adult birds [5]. Of birds on public lands, 72 percent were on NAWS, 25 percent on BLM, and 2 percent on state lands [2]. A survey of BLM and state lands in 2004 documented 204 adults and estimated a range-wide population of 725 adults [2]. Sites surveyed in 1998 and 2004 increased by an average of 13.6 percent. The increase was attributed in part to a reduction of feral burro and horse numbers [2]. More than 11,600 burros and 2,400 horses have been removed from the Argus and Coso ranges since 1980, improving riparian and upland vegetative conditions [2]. Settlement of a lawsuit brought by the Center for Biological Diversity in 2001 required further reductions of feral equines, off-road vehicles, camping, and other impacts on specific towhee habitats on BLM lands [6]. An August 2005 fire on NAWS impacted some riparian habitat, as did a 2005 flash flood in Mountain Springs Canyon, but the extent of habitat damage its impact on the towhee is not known [10].
While the population increased between 1998 and 2004, the range contracted, probably due to drier conditions reducing the suitability of marginal habitats [2]. The towhee appears to expand into marginal breeding habitats during wet years and contract to core riparian habitats in drier years. The appearance of singing birds in the Panamint Mountains 20 kilometers to the east of the Argus Range suggests the towhee may be colonizing ranges beyond that historically known, and may be capable of recolonizing the Coso Range 20 kilometers to the west as well [2]. Comprehensive surveying of these ranges has been recommended [2].
The U.S. Fish and Wildlife Service recovery plan requires a minimum of 400 birds with a stable population for at least five years before the species can be considered recovered [1]. The towhee appears to have maintained a population of 640 to 725 birds for six years, but the estimate is based on a projection from BLM and state lands to NAWS. If surveys on NAWS confirm the population level, the species should be considered for delisting. Before delisting can occur, however, long-term management agreements must be executed to ensure continuing control of feral equines, off road vehicles, uncontrolled recreation and water diversions. In 2008, the U.S. Fish and Wildlife Service recommended delisting [12].
CITATIONS
[1] U.S. Fish and Wildlife Service. 1998. Recovery plan for the Inyo California towhee (Pipilo crissalis eremophilus). U.S. Fish and Wildlife Service, Portland, OR. 32 pp.
[2] LaBerteaux, D. 2004. Inyo California Towhee (Pipilo crissalis eremophilus) Survey in the Argus Range, Inyo County, California. Prepared for the BLM, Ridgecrest Field Office. 62pp + appendices.
[3] Cord B. and J.R. Jehl, Jr. 1979. Distribution, biology, and status of a relict population of brown towhee. Western Birds 10:131-156
[4] U.S. Fish and Wildlife Service. 1987. Determination of threatened status and critical habitat designation for the Inyo brown towhee. United States Fish and Wildlife Service, Portland, OR, August 3, 1987 (52 FR 28780).
[5] LaBerteaux, D. L., and B. H. Garlinger. 1998. Inyo California Towhee (Pipilo crissalis eremophilus) census in the Argus and Coso Mountain Ranges, Inyo County, California. Prepared for Commanding Officer (83E000D), Naval Air Weapons Station, China Lake, CA. Contract N62474-98-M-3113). 94 pp. + appendices.
[6] CBD v. BLM. 2001. Stipulation and proposed order concerning all further injunctive relief. Settlement in Center for Biological Diversity et al. v. Bureau of Land Management et al., CIV 00-0927 WHA (JCS), approved by the court on March 1, 2001.
[7] NRPI. 1998. Indian Spring Exclosure. The Natural Resource Projects Inventory, reported April 16, 1998, www.ice.ucdavis.edu/nrpi/NRPIDescription.asp?ProjectPK=4460
[8] RRPI. 1998. Christmas Spring Exclosure. The Natural Resource Projects Inventory, reported April 16, 1998, www.ice.ucdavis.edu/nrpi/NRPIDescription.asp?ProjectPK=4463
[9] BLM, U.S. Fish and Wildlife Service, and CDFG. 1999. West Mojave Plan, Draft Evaluation Report, Suggested Conservation Strategies. Bureau of Land Management, U.S. Fish and Wildlife Service, and California Department of Fish and Game, working
draft, September 22, 1999.
[10] LaBerteaux, D. 2005. Personal communication with Denise LaBerteaux, Eremico Biological Services, October 23, 2005
[11] West Mojave Planning Team. 1999. Current management situation of special status species in the West Mojave Planning Area. Bureau of Land Management, U.S. Fish and Wildlife Service, and California Department of Fish and Game.
[12] U.S. Fish and Wildlife Service. 2008. 5 Year Review of the Inyo California Towhee (Pipilo crissalis eremophilus). Portland, OR. 24 pp.
Least Bell's vireo (Vireo bellii pusillus)
| Status: Endangered | Critical habitat: 2/2/1994 | Listed: 5/2/1986 | Recovery plan: 5/6/1998 |
Range: CA(b) ---
SUMMARY
Once one of California's most abundant birds, the least Bell’s vireo declined drastically due to habitat loss and brood parasitism by the brown-headed cowbird. It remains threatened by cowbirds, invasive plants, agriculture and grazing. Since listing and critical habitat designation, there has been an increase from 300 pairs of birds in 1986 to 2,500 pairs of birds in 2006. The number of territories has increased tenfold from 291 in 1986 to 2,968 known territories in 2006.
RECOVERY TREND
The least bell’s vireo (Vireo bellii pusillus) was formerly abundant in the riparian woodlands of California's Central Valley and low elevation riparian streams in Southern California and northern Baja, Mexico [1]. It was one of California's most abundant birds in the late 19th and early 20th centuries, but was reduced to just 300 pairs by 1986. The decline was driven by the separate and combined effects of habitat loss and brood parasitism by the invasive brown-headed cowbird (Molothrus ater). It was listed as an endangered species by the state of California in 1980 and the U.S. Fish and Wildlife Service in 1986 [2]. Similar declines occurred in Baja, Mexico, but were not as well documented. The population and habitat extent in Mexico was much smaller historically and currently than in California.
Due to intensive habitat protection and restoration and cowbird control, the California vireo population increased dramatically from 300 estimated pairs in 1986 [1] to 2,500 in 2004 [9]. In 1994, 38,000 acres of critical habitat were designated in 10 areas stretching from Santa Barbara to San Diego County [8]. The proposal of critical habitat on the U.S. Marine Corps’ Camp Pendleton in 1986 spurred the development of a memorandum of understanding between the military and the U.S. Fish and Wildlife Service to remove exotic plants, trap cowbirds, research and monitor the species, and take other conservation measures [1].
Territorial males in the Prado Basin steadily increased from 19 to at least 600 between 1986 and 2005 [6, 10]. The Santa Ana River watershed (including the Prado Basin) supported at least 988 territorial males in 2005 [10]. Storm damage limited the 2005 survey effort, so the reported numbers are somewhat less than the actual. The Anza Borrego State Park population increased steadily from 32 territorial males in 1986 to 109 in 2005 [3, 4, 5]. The Camp Pendleton population increased from 100 males in 1986 to 827 in 2005, but declined from its 1998 peak of 1,010. A 16-kilometer stretch of the San Luis Rey River increased its population from 24 to 114 between 1986 and 2004, but declined from its 1999 peak of 132 [9]. A population within 5 kilometers of the San Diego River increased from 21 males in 1986 to 33 in 1996 [9]. The Tijuana River population increased from 13 to 142 between 1990 and 1996 [1].
As the population has increased, the occupied range has expanded eastward and northward [1]. In 2005, the vireo appeared on the San Joaquin River National Wildlife Refuge in the Central Valley where it had been absent for 60 years.
Though significant habitat protection and restoration programs have been instituted since 1986, much of the population increase is due to aggressive cowbird trapping funded by mitigation requirements of Endangered Species Act consultations [1, 9]. Several of these populations (e.g. Camp Pendleton, San Luis Rey River, and San Diego River) increased rapidly then leveled off d, suggesting that they may now be primarily limited by habitat condition and extent [9].
From its listing in 1986 to 2006, the population increased 10-fold from 291 to 2,968 known territories [11], leading to a recommendation in the 2006 Five-Year Review to downlist the species. The population has grown during each five-year period since the original listing, although the rate of increase slowed from 1996 to 2006. Riverside County has seen a 2,997-percent increase, and San Diego County has seen a 621-percent increase. Lesser but significant increases have also been seen in Orange, Ventura, San Bernardino and Los Angeles counties. Only the population in Santa Barbara County has declined since listing [11].
At the time of listing, loss of habitat due to agricultural practices, urbanization and exotic plant invasion were identified as major threats to vireo populations. Since the listing of the vireo, destruction and modification of riparian habitat within its current range has been curtailed significantly, primarily as a consequence of protections provided by listing and critical habitat designation. Agriculture, grazing and invasive plants continue to threaten riparian habitat within the larger historic range [11].
The draft 1998 federal recovery plan allows for downlisting to "threatened" status when 11 named river basins have stable or improving populations of at least "several hundred" breeding pairs for five years [1]. Delisting can occur when three additional specific river basins have populations of several hundred breeding pairs each and either all 14 river basin populations are self-sustaining or endowments are established to permanently protect them from cowbirds and exotic plant encroachment. The downlisting criteria would require the existence of approximately 3,300 pairs. The delisting criteria would require about 4,200 pairs.
The ongoing recovery of the species is dependent on continuing management of cowbirds and invasive plants and prevention of further habitat loss to development [11].
CITATIONS
[1] U.S. Fish and Wildlife Service. 1998. Draft Recovery Plan for the Least Bell’s Vireo. U.S. Fish and Wildlife Service, Portland, OR. 139 pp.
[2] U.S. Fish and Wildlife Service. 1986. Determination of Endangered Status for the Least Bell’s Vireo. U.S. Fish and Wildlife Service. May 2, 1986 (51 FR 16474).
[3] Kus, B. 2001. Least Bell’s Vireo Surveys and Nest Monitoring at Anza Borrego Desert State Park in 2000: Final Report. U.S. Geological Survey, Western Ecological Research Center, San Diego Field Station.
[4] Joregensen, P. 2005. Bell’s vireo population survey and cowbird trapping report for Anza-Borrego Desert State Park (Vireo bellii pusillus) and Picacho State Recreation Area (Vireo bellii pusillus) for the 2004 Breeding Season. California State Parks, Colorado Desert District, Borrego Springs, CA.
[5] Jorgensen, P. 2005. Personal communication with Paul Jorgenson, California State Parks, Colorado Desert District, November 7, 2005.
[6] Pike, J., D. Pellegrini, L. Hays, and R. Zembal. 2005. Least Bell's Vireos and Southwestern Willow Flycatchers in the Prado Basin of the Santa Ana River Watershed, CA. Unpublished report prepared by the Orange County Water District and U.S. Fish and Wildlife Service.
[7] Kus, B. 2006. Least bell's vireo population trend at Camp Pendleton, 1981-2005. Spreadsheet provided by Barbara Kus, USGS Western Ecological Research Center, San Diego, CA, January 12, 2006.
[8] U.S. Fish and Wildlife Service. 1994. Designation of critical habitat for least Bell's vireo. U.S. Fish and Wildlife Service, February 2, 1994 (59 FR 4845).
[9] Kus, B.E. and M.J. Whitfield. 2005. Parasitism, productivity, and population growth: response of least Bell's vireos (Vireo bellii extimus) and southwestern willow flycatchers (Empidonax traillii extimus) to cowbird (Molothrus spp.) control. Ornithological Monographs 57:16-27.
[10] Hays, L. 2006. Personal communication with Loren Hays, U.S. Fish and Wildlife Service, Carlsbad, CA, January 17, 2006.
[11] U.S. Fish and Wildlife Service. 2006. Least Bell’s Vireo (Vireo bellii pusillus) 5-Year Review Summary and Evaluation. Carlsbad Fish and Wildlife Office. 27 pp.
Light-footed clapper rail (U.S. DPS) (Rallus longirostris levipes)
| Status: Endangered | Critical habitat: none | Listed: 10/13/1970 | Recovery plan: 6/24/1985 |
Range: CA(b) ---
SUMMARY
Declines in light-footed clapper rail populations were caused by the loss of salt marshes and wetlands. The rail remains threatened by predation, small population size, climate change, severe weather events, poor habitat quality and automobile strikes. The U.S population has fluctuated since listing in 1970, but shows a clearly increasing trend going from 203 pairs of birds in 11 marshes in 1980 to 376 pairs in 19 marshes in 2010.
RECOVERY TREND
The light-footed clapper rail (Rallus longirostris levipes) is found exclusively in salt marshes between Santa Barbara, Calif. and San Quintin Bay, Baja California, Mexico. Nesting occurs primarily in dense cordgrass, wrack deposits and in hummocks of high marsh within the low marsh zone [1]. Due to loss and degradation of salt marshes, the overall acreage and suitability of wetlands for the light-footed clapper rail has declined. The species was listed as endangered in 1970.
The California population of light-footed clapper rails has fluctuated between 1980 and 2010, but shows a clearly improving trend from 203 pairs in 11 marshes in 1980 to a high of 443 pairs in 2007, dropping some to 376 pairs in 19 marshes in 2010 [2, 3, 5, 6]. A captive breeding program initiated by the Chula Vista Nature Center, SeaWorld San Diego, the U.S. Fish and Wildlife Service and several independent biologists released more than 200 chicks between 2001 and 2008 [4].
Since 1980, the lowest number of pairs detected was 142 in 1985. The highest number of pairs detected was 443 in 2007 when 19 marshes were censused. Of these 19 marshes, eight had almost 92 percent of the total light-footed clapper rail pairs counted in 2007. These marshes include, from north to south; Mugu Lagoon, Seal Beach National Wildlife Refuge, Upper Newport Bay, Batiquitos Lagoon, San Elijo Lagoon, San Dieguito Lagoon, Los Penasquitos Lagoon, and Tijuana Slough National Wildlife Refuge. Of these, Upper Newport Bay and Tijuana Slough NWR together represent 69 percent of the total pairs counted in 2007 [5].
The Upper Newport Bay population of light-footed clapper rails has been the largest since the statewide census began in 1980, and likely has been for decades. It has typically consisted of 100 pairs of rails or more and has recovered the few times that it dropped below this threshold. In contrast, the second and third largest populations at Seal Beach NWR and Tijuana Slough NWR have been dramatically affected by major environmental perturbations. These larger populations have subsequently rebounded, but only after many years of intensive management. Each of the smaller populations is under constant threat of extirpation because of the extremely small population sizes [5].
Following the 2007 high of 443 pairs, the largest populations declined in 2008 due to severe weather events, but these populations were rebounding as of 2010. The 2010 count of 376 pairs is the third-highest count on record and is a 17.5 percent increase over the breeding population detected in 2009. In 2010 Upper Newport Bay remained the largest population with 131 pairs. Tijuana Slough NWR did not recover significantly in 2010 toward the record high level of 142 pairs in 2007 but did increase from 2009 by 33 percent to 76 breeding pairs in 2010 [6].
Thirteen of the small subpopulations increased in size from 2009 to 2010, increasing by a combined total of 59 breeding pairs in 2010. The subpopulation in Batiquitos Lagoon reached a new high total of 36 breeding pairs. Point Mugu increased by 33 percent to 12 pairs and the Seal Beach tally was up slightly to 25 pairs. San Elijo Lagoon reached its all-time high count of 15 breeding pairs in 2006 and again in 2010 and the U.C. Kendall-Frost Reserve held strong at 10 pairs. Excluding the two largest subpopulations, there were six subpopulations in double figures, ranging from 10 to 36 pairs and totaling 126 breeding pairs, or 33.5 percent of the state total. The remaining 11 subpopulations ranged from one to nine pairs and totaled 43 breeding pairs of clapper rails, or 11.4 percent of the total [6].
Restoration and management are contributing to the recovery of the rail, but the species remains vulnerable to weather fluctuations, predation, climate change, poor habitat quality and automobile strikes.
CITATIONS
[1] U.S. Fish and Wildlife Service. Light-footed clapper rail Life History. http://ecos.fws.gov/docs/life_histories/B04B.html
[2] Zembal, R., S.M. Hoffman, and J.R. Bradley. 1997. Light-footed clapper rail management and population assessement, 1996. Bird and Mammal Conservation Program Report, 97-08. Final Report to the California Department of Fish and Game, Sacramento, CA.
[3] Hayes, L. 2005. Light-footed clapper rail nesting data, 1997-2004. Data provided by Loren Hayes, U.S. Fish and Wildlife Service, Carlsbad, CA, August 1, 2004.
[4] U.S. Fish and Wildlife Service. 2008. Journal Entry. CARLSBAD FWO: U.S. Fish and Wildlife Service Journal Entry: Light-footed Clapper Rail Breeding Program Success is Something to Cheer About, August 22, 2008, http://www.fws.gov/FWSJournal/regmap.cfm?arskey=24778
[5] U.S. Fish and Wildlife Service. 2009. Light-footed clapper rail (Rallus longirostris levipes) 5-Year Review: Summary and Evaluation. Carlsbad Fish and Wildlife Office. 26 pp. http://ecos.fws.gov/docs/five_year_review/doc2573.pdf
[6] California Department of Fish and Game. 2010. Status and Distribution of the Light-footed Clapper Rail in California 2010 Season. Available at:
http://kerineal.com/clapperrail.com/joomla/images/stories/resources/2010CRR.pdf
[7]The Clapper Rail Study Team. 2011. Website: http://www.clapperrail.com/clapperrail.com/joomla/.
Mohave tui chub (Gila bicolor mohavensis)
| Status: Endangered | Critical habitat: none | Listed: 10/13/1970 | Recovery plan: 9/12/1984 |
Range: CA
SUMMARY
he Mohave tui chub declined to near extinction because of climate change, competition, hybridization and predation by non-native species, water pollution, water withdrawals, habitat loss, and altered flooding regimes. When listed as endangered in 1970, the chub existed in two small populations. Reintroduction programs and intensive habitat creation and protection increased it to 8,500 fish in five large populations in 2012. Six populations are needed for downlisting.
RECOVERY TREND
The Mohave tui chub’s (Gila bicolor mohavensis) recovery from the edge of extinction in 1970, to 8,500 fish in five populations in 2012, is a testament to the Endangered Species Act and decades of hard work by scientists, government agencies, and more recently, visionary high school students who rallied a small town to save the Mojave River’s only native fish. None of that would have been possible though, had the chub not been saved from extinction by two unlikely men: the apocalyptic founder of the Jehovah’s Witnesses and a tax-evading, land-stealing, tonic-selling, radio evangelist/real estate developer dubbed ""King of Quacks"" by the American Medical Association.
BIOGEOGRAPHY
The Mohave tui chub is the only fish native to the Mojave River basin. During the Pleistocene (2.5 million to ~11,700 years ago), it occurred throughout the basin, which at the time was a vast wetland complex comprised of the Mojave River, three very large lakes (Manix, Mojave, and Little Lake Mojave), many small lakes, and a network of meandering channels connecting them [1]. Manix, the largest of the lakes, carved Afton Canyon with its outflow, and from there alternatively flowed into Lake Mojave or Little Lake Mojave [1]. Lake Mojave covered what are now the Soda Lake and Silver Lake playas. Little Mojave Lake covered what are now the East and West Cronese Lake playas.
As the climate warmed during the Holocene (beginning ~11,200 years ago), the basin became increasingly arid. What was largely a lacustrine (=slow-water, wetland) ecosystem, became a fluvial (=relatively swift-water, riverine) ecosystem. The channels and small lakes disappeared; the large lakes shrank to small, ephemerally wet playas, and perennial surface water was confined to the Mojave River and its larger tributaries.
The Mohave tui chub became restricted to the Mojave River mainstem, primarily inhabiting deep pools and slough-like areas: micro-habitats similar to the Pleistocene ecosystem it evolved in [1]. In the early 20th century it was most common in lower elevation, low gradient, perennial reaches downstream of Victorville, Calif. Though stream flow is more reliable in the headwaters upstream of Victorville, the chub is not evolutionarily equipped to establish viable populations in the relatively shallow, swift-flowing, frequent flooding conditions which predominate there.
THREATS AND DECLINE
Human water withdrawals in the modern period greatly exacerbated the natural desertification trend, eliminating most perennial reaches of the river, and confining the chub to a very small range. In the 1930s, nonnative arroyo chubs (used as bait fish) were introduced to the river where they competed and hybridized with the Mohave tui chub [1]. The former’s dominance was facilitated by its better ability to survive flooding. Other detrimental introductions included large-mouth bass, catfish, trout, mosquitofish, bullfrogs and crayfish. These, combined with increased flooding, pollution, water withdrawals and habitat degradation, extirpated non-hybridized Mohave tui chub from the river mainstem by 1970.
The recent discovery of parasitic Asian tapeworms in tui chubs is a concern, but as of 2012 has not been proven to reduce population levels [2]. At least two of the populations—MC Spring (at Soda Springs) and Camp Cady—have reduced genetic diversity [2].
RECENT POPULATION TREND
1970: When listed as an endangered species in October 1970, the Mohave tui chub was extirpated from the Mojave River [1]. It existed in just two populations: Soda Springs and Piute Creek. The 1984 federal recovery plan [1] incorrectly states that it also existed at Paradise Spa and Two Hole Spring (see below).
1978: In 1978, there were three populations [1]. Soda Springs still existed; Piute Creek failed (1977); new populations were established at Lark Seep (1971) and Desert Research Station (1978).
1992: In 1992, there were three populations [4]. Soda Springs and Lark Seep still existed; Desert Research Station failed (1992); a new population was established at Camp Cady (1986).
2008: In 2008, there were four populations [3]. Soda Springs, Lark Seep and Camp Cady still existed; a new population was established at Lewis Center (2008).
2011: In 2011, there were five populations [2]. Soda Springs, Lark Seep, Camp Cady and Lewis Center still existed; a new population was established at Morning Star Mine (2011).
The Mohave tui chub’s total population size in 1970 is not known. We estimate a likely maximum of 1,000 to 2,000 fish based on later trends at Soda Springs and the presumption that the Piute Springs population was never large. The 2011 population was on the order of 8,000 to 9,000 fish [8]. The most recent precise data are: 1,573 fish at Soda Springs (2007), 3,607 at Camp Cady (2007), 6,000 at Lark Seep (2003), 1,560 at Lewis Center (2011), and 1,000 introduced to Morning Star Mine (2011) [6, 9].
RECOVERY TIME AND CRITERIA
The 1984 federal recovery plan requires that to downlist the chub from “endangered” to “threatened,” there must be six populations of at least 500 fish [1]. Each must have been free of threats for at least five years and have survived at least one significant flooding event. Each of the four established populations extant as of 2012 greatly exceeds 500 fish, but only three have been extant for five years. The fifth (Morning Star Mine) also exceeds 500 fish, but it is too early to declare it “established” since it was only established in October 2011.
Recovery efforts increased considerably in response to a 2003 National Park Service sponsored tui chub recovery workshop [4] and plans are underway to increase the size of existing populations and establish new ones [9]. We expect the 1984 downlisting criteria to be met within the next decade. The plan, however, is outdated. A draft revision was completed in 1988 [12], but never finalized. The U.S. Fish and Wildlife Service and other agencies contemplated updating the plan in 2003 (see discussion at [4]), but have not yet done so.
Accounting for the chub’s history of sudden, unexpected population failures (see below), we recommend a more fluid, meta-population approach: ten populations at sites dedicated to chub recovery, which over a five-year period simultaneously include at least six populations of at least 1,000 fish. This criterion anticipates and buffers against sharp population declines and complete population failures. It will prevent a single, catastrophic—but temporary—event from triggering the need to uplist again to endangered status.
The recovery plan requires that to be delisted, the tui chub be re-established in the majority of its historic range [1]. The goal is ambiguous, however, because chub’s historic late-Holocene range is different from the historic Pleistocene range in which it evolved, and which still defines its genetically-driven behavior. Restoration to its historic modern range (the Mojave River mainstem), moreover, is almost certainly unattainable due to climate change, dewatering, widespread presence of numerous nonnative species, urbanization, and lack of slough-like habitats to serve as post-flood recolonization refugia (see discussion at [4]). Under the current delisting criteria, we concur with National Park Service biologists who concluded that “Human population growth and increased water demand in the Mojave River drainage may make delisting the Mohave tui chub impossible” [13].
We recommend that the criteria be updated to recognize that while the chub should be restored to the Mojave River to maintain important natural selection pressures, its range there will be considerably less than the majority of the river. Most future Mohave tui chub populations, like all current populations, will exist in human-created ponds adjacent to the river. There should be approximately 20 of these, of which approximately 12 should simultaneously support at least 1,000 fish over a five-year period.
POPULATIONS EXTANT AS OF 2012
1. SODA SPRINGS, MOJAVE NATIONAL PRESERVE
The Soda Springs complex is known to have been occupied by Mohave tui chubs since at least 1917, with strong evidence pointing back to at least 1907 [1]. It may have been continually occupied much longer than that. It contains the sole remaining, non-introduced, relict chub population (MC Springs) which has served as the ultimate source of all reintroduction efforts since the 1950s. Soda Springs is the only existing population that was also extant in 1970 when the chub was listed as an endangered species.
Soda Springs was used for thousands of years by early predecessors of the Mohave and Chemehuevi peoples and was an important site in the traditional range of the Chemehuevi and Vanyume [7, 11]. Being a rare, dependable water source on the well-used trade route between the California Coast and the Colorado River, Soda Springs would have been extensively visited by native groups, but there is no evidence that they harmed the Mohave tui chub (know as “tui-pagwi” to the Paiute) or its habitat there or elsewhere.
The first European to visit Soda Springs was likely Father Francisco Garces in 1776 [11]. Trapper/explorer Jedediah Smith was the first recorded Anglo to visit the springs. He passed through in 1826 and 1827, finding the water “brackish.” Kit Carson and Lt. John C. Fremont led later expeditions. A permanent military post was established at the springs in 1864 to thwart alleged attacks by Mohaves. The post was shuttered in 1871.
The area was mined for gold, salt and soda at the turn of the century [7, 11]. The heavily used Tonopah-Tidewater Railroad was laid north what is now Lake Tuendae in 1906 [7, 11]. The springs were extensively altered and diverted during this time, but effects on the chub were not recorded.
Between 1914 and 1974, Soda Springs was occupied by two quixotic religious groups who unwittingly saved the Mohave tui chub from extinction by keeping it alive, and even increasing its population, until formal conservation programs took over chub’s fate in 1970s.
Charles Taze Russell, the charismatic founder of the Jehovah’s Witnesses, believed that the second coming of Jesus happened in October of 1874 [15]. He would reign invisibly on this earth, harvesting souls in the desert of modernity for 40 years. Then in October of 1914, Christ would re-ascend to Heaven, bringing an end to the Time of the Gentiles, and unleashing Armageddon “with fury poured out; a time of trouble such as never was before, nor ever shall be; a day of wrath” [15]. Russell divined these dates from biblical numerology and corroborated them in a close examination of the geometry of the Great Pyramid of Giza, which he called the “Bible in stone” [16].
Though his Watchtower Bible and Tract Society was headquartered in Brooklyn, N.Y., Russell and a small band of followers homesteaded Soda Springs in 1914 [7, 18] to mine for gold and wait for the end of the world. The outbreak of World War I later that year was a welcome confirmation of the End of Days—“When our worthy President and also his Holiness the Pope requested Christian people to pray God for the cessation of the European war, we declared that the prayer was not in harmony with the Divine arrangement…the war is the one predicted in the Scriptures as associated with the great day of God Almighty-‘the day of vengeance of our God.’”—at Soda Springs, it led to the jailing of Russell’s German immigrant followers and himself with them [18].
Soda Springs was abandoned in 1916 following Russell’s strange death and a massive flood which damaged the railway and inundated much of the area for two years. It remained abandoned, and what would become, if it was not already, the last relict Mohave tui chub population, was left undisturbed until the arrival of radio evangelist Curtis Howe Springer in 1944 [7].
Springer at various times claimed to be a doctor, college dean, ordained minister, and emissary of non-existent colleges, academies and medical schools [19]. He lectured on health, temperance, marriage, the ill-effects of argumentation, and the virtues of Franklin Roosevelt and his New Deal. He amassed a fortune selling tonics, teas, bath salts and breads to remedy baldness, cancer, sore toes and hemorrhoids, rejuvenate cells, restore beauty and lengthen life. His most popular concoctions were Hollywood Pep Tonic, Antediluvian Desert Herb Tea, and Mo-Hair.
Leaving a string of lawsuits, investigations and failed resorts behind [20], Springer moved to California in the late 1930s, and in 1944 filed mining claims on 12,800 acres of federal land around Soda Springs [1]. He then built the Zzyzx Mineral Springs and Health Spa with the labor of homeless men bussed in from Los Angeles and given room and board [19]. While Springer later used this “charity” to justify Zzyzx’s tax-exempt status [21], others note that he also took control of the men’s social security checks via the his post office, only doling out cash after charging them for his largess [22].
The sprawling complex included a two-story hotel called The Castle, a church, radio station, private airfield (the Zyport), 60 cabins, mineral baths, and falsely advertised “hot” springs. The name Zzyzx was chosen so the enterprise could be marketed as the “last word in health.”
Springer gave sermons twice daily over loud-speakers hidden in the rocks and used the power of his internationally syndicated radio show to draw thousands of people to his Christian health spa [19].
Meanwhile, by 1955, the Mohave tui chub was on its last legs. It was on the verge of extirpation from its entire native habitat in the Mojave River. The last remaining native population lived in the tiny 9-meters-by-9-meters MC Spring on Springer’s resort where it had miraculously survived his introduction of development, wandering tourists, water diversions and sermons. Had this population been lost, the chub would almost certainly be extinct today.
That year, however, Springer created the centerpiece of Zzyzx resort: Lake Tuendae, a 1.4-acre, palm-tree-lined oasis arrived at by the freshly constructed two-lane Boulevard of Dreams [7]. Fed by the “Enrico Caruso Fountain,” the pond was a healing bath for guests and allegedly the source of the salts in Mo-Hair, which he sold to guests and his radio congregation as a cure for baldness. For reasons unknown, Springer transplanted tui chub from MC Spring to the lake, accidentally carrying out the most important action in the history of Mohave tui chub conservation: replicating the world’s last remaining relict population.
The chub thrived in its new habitat, which has since become one of the species’ largest, most stable populations. All tui chub populations created since 1955, and all populations in existence today, were ultimately sourced from Lake Tuendae as the MC Spring population is too small to support translocations [1, 3, 9].
Springer’s empire was expanding as well. His sermons were now broadcast on 221 U.S. and 102 foreign radio stations, his health remedies were selling rapidly, and his income swelled with the sale of land parcels at the edge of Zzyzx, promising to create a permanent Christian community in need of his services [19].
In the late 1960s, it all began to unravel when a civil suit was filed alleging that Mo-Hair did not increase hirsuteness. Singer had been sued over his remedies many times, but this one drew the attention of the American Medical Association and the U.S. Food and Drug Administration. The former had been following Singer since 1929 and 1935 declared him “a person with an ignorance of the human body and its processes that is wide and deep, who by virtue of an unblushing effrontery, combined with a flair for garrulity, dupes an ignorant public” [20]. Now in 1969, it proclaimed him the “King of Quacks” [21]. The latter prosecuted him for false advertising. The Internal Revenue Service began an investigation, and most calamitously, the Bureau of Land Management sought not only to stop the land sales, but to seize the entirety of Zzyzx, alleging that Singer had illegally taken public lands as his own by filing false mining claims.
Years of court battles ensued. In the end, the self-described “last of the old-time medicine men” [21] was sentenced to 60 days in jail (he served 41) and Zzyzx was returned to the public domain in 1974 [1, 7]. In 1994, it became part of the Mojave National Preserve.
The Soda Springs wetland complex consists of three nearby subpopulations:
- MC Spring (=Mohave Chub Spring): MC Springs is the only existing relict population and, via its replication in Lake Tuendae, has served as the founding source of all currently existing populations [4]. At three meters in diameter, it is the smallest subpopulation at Soda Springs, supporting just 20 to 60 small fish in 1981-1982 [1].
- Lake Tuendae: Lake Tuendae was excavated in 1955 by Curtis Howe Springer [1]. Measuring 150 meters by 40 meters (1.4 acres), it has a maximum depth of 3.3 feet and is maintained by pumping from the Zzyzx Well. It was populated with Mohave tui chub from MC Springs shortly after 1955.
- Three Bats Pond (also called West Pond). Three Bats Pond is a 60-meter-by-70-meter water-filled mine shaft that was enlarged by Springer, probably to create the appearance he was mining as required by his mining claims [7]. It is fed by a natural spring and possibly a second spring and groundwater seepage. Heavy pumping from the Zzyzx Well reduces water levels in Three Bats Pond.
Because it experiences greater water quality extremes, Three Bat’s tui chubs are smaller than Lake Tuendae’s. A fish kill occurred in 1981, possibly due to high pH, low dissolved oxygen, and/or ammonia toxicity [1] and the entire population was lost in 1984 due to poor water quality [7].
2. LARK SEEP, CHINA LAKE NAVAL AIR WEAPONS STATIONS
Lark Seep is a perennial wetland created in 1945 by discharge from the City of Ridgecrest’s wastewater treatment plant [4]. The G1 Channel, G1 Seep, George Channel and North Channel were later dug to carry water from Lark Seep farther away from the facility.
In 1971, 425 Mohave tui chubs were transplanted from MC Spring to Lark Seep [4]. An additional 75 fish were transplanted in 1976 [1]. The chub has since been established in G1 Channel, G1 Seep, George Channel and North Channel [4].
In 1984, it was the species’ largest population [1].
3. CAMP CADY STATE WILDLIFE AREA
In 1986, the California Department of Fish and Game excavated two small ponds in the Camp Cady State Wildlife Area and introduced Mohave tui chubs [4]. The ponds are fed from a water pump. They each supported approximately 500 fish.
In 1991, the east pond was drained and lined with plastic to solve a seepage problem [4]. In 2003, the east pond dried up because the property caretaker became ill and neglected it. There is only one pond at Camp Cady now, maintained by Fish and Game volunteers.
4. LEWIS CENTER, ACADEMY OF ACADEMIC EXCELLENCE
The Lewis Center, Academy of Academic Excellence is a K-12 charter school in Apple Valley, Calif. straddling the Mojave River [4]. It manages 138 acres of its 150-acre campus for wildlife.
In 2004, Molly Estes and Amanda Pearson, two students at the Academy, attended a National Park Service-sponsored workshop on recovery of the Mohave tui chub [4]. They began a project which in 2008 resulted in 548 tui chub from Lark Seep being introduced to the Deppe Pond and Tui Slough refuges on the Mojave River Campus of the Lewis Center [5]. A drainage pond between the school and the Mojave River, Deppe Pond was drained, expanded, reshaped, and lined by students, Boy Scouts, volunteers and community members. Tui Slough was excavated by students, Boy Scouts and volunteers. By 2011, the two pond population had grown to 1,560 fish [6].
5. MORNING STAR MINE, MOHAVE NATIONAL PRESERVE
In October 2011, 1,000 tui chub from Lark Seep and Soda Spring were introduced to the Morning Star Mine in the Mohave National Preserve [8]. The 1-acre, groundwater fed site is an abandoned mining pit.
POPULATIONS ELIMINATED AFTER 1970 LISTING
* PARADISE SPA
In 1967, the Bureau of Land Management and the California Department of Fish and Game introduced 50 tui chubs from Soda Spring to Paradise Spa, an artificial pond south of Las Vegas in Clark County, Nev. [1, 10]. The population failed “a few years” later [1]. We can find no record of the failure year, only that it was not present in 1981 [10]. As there is no evidence that it was viable or even extant in late 1970, we do not regard it as post-1970 elimination. It is included here because it was reported as being extant at the time of listing in the 1984 federal recovery plan [1].
* TWO HOLE SPRING
On Aug. 20, 1970—two months before the tui chub was listed as an endangered species—41 fish were introduced to Two Hole Spring, but the population did not become established and was absent in June 1971 [10]. On July 9, 1971, 150 additional fish were reintroduced, but also failed to establish and were missing by July 21, 1971 [10]. Because it was never established, we do not regard it as post-1970 elimination. It is included here because it was reported as being extant at the time of listing in the 1984 federal recovery plan [1].
1. PIUTE SPRINGS
On Dec. 18-19, 1969, 150 fish were introduced to Piute Springs at the base of Piute Wash on Bureau of Land Management land northwest of Needles, Calif. [10, 14]. The wash is subject to flash flooding. Fish were not present in the winter of 1970 following a flood and the population was feared to have been eliminated [14]. It is unknown whether the population survived and/or additional introductions were made, but it was present in 1976 and eliminated by 1978 [10].
2. SOUTH COAST BOTANICAL GARDEN
On Jan. 27, 1970, 147 fish were introduced to the South Coast Botanical Garden. The pond was drained by 1972 (after the fish were relocated elsewhere) [10]. Fifty-five fish were introduced later that year, and were augmented with 105 fish in 1975. None were present in 1976.
3. DOS PALMAS SPRINGS
On May 25, 1972, 100 fish were introduced to Dos Palmas Springs, but were absent by 1980 [10].
4. LION COUNTRY SAFARI PONDS
On June 1, 1972 and March 28, 1975, 822 fish were introduced to Lion Country Safari Ponds [10]. The population was present in January 1974 but absent by November 1977.
5. EATON CANYON NATURE CENTER
On June 5, 1972, 20 fish were introduced to the Eaton Canyon Nature Center [10]. The population later failed [1].
6. BUSCH GARDENS
On June 27, 1972, 49 fish were introduced to Busch Gardens [10]. The population later failed [1].
7. DESERT DISCOVERY CENTER
Sixty chubs were placed in a 300-gallon display tank at the Bureau of Land Management’s Desert Discovery Center (then called the Barstow Way Station) on July 22, 1975 [1]. The population was augmented on July 1, 1981. In 1984, the population size was 50 to 60 fish. The population died around 1995 when maintenance of the tank stopped [4]. Because of its small size, display use and vulnerability to extinction, it was never classified as a conservation population by the U.S. Fish and Wildlife Service [1].
8. DESERT RESEARCH STATION
This 30-meter-by-30-meter pond near Hinckley, Calif. was established with 16 introduced fish on Dec. 12, 1978 [1]. It was augmented with 126 fish from Soda Springs in 1981 and 56 fish from Lark Seep in 1986 [1, 4]. In 1984, the population size was 2,000 to 4,000 [1]. The population died in 1992 when the Barstow Unified School District closed the facility [4].
9. LAKE NORCONIAN
On Feb. 8, 1978, an unknown number of fish were introduced to Lake Norconian, but the population had failed by February 1980 [10].
CITATIONS
[1] U.S. Fish and Wildlife Service. 1984. Recovery Plan for the Mohave Tui Chub, Gila bicolor mohavensis. Portland. Oregon, U.S. Fish and Wildlife Service.
[2] Dudek and ICF International. 2012. Desert Renewable Energy Conservation Plan (DRECP) Baseline Biology Report (March 2012 draft). Prepared for the California Energy Commission, Sacramento, California. Available at http://www.drecp.org/documents/baseline_biology_report/10_Appendix_B_Species_Profiles/10c_Fish/Mohave%20tui%20chub.pdf
[3] U.S. Fish and Wildlife Service. 2009. Mohave tui chub (Gila bicolor mohavensis = Siphaletes bicolor mohavensis) 5-Year Review: Summary and Evaluation. Available at https://ecos.fws.gov/docs/five_year_review/doc2392.pdf
[4] Hughson, D. and D. Woo. 2004. Report on a Workshop to Revisit the Mohave Tui Chub Recovery Plan and a Management Action Plan. Available at http://www.nps.gov/moja/naturescience/upload/ACF46F1.pdf
[5] The Lewis Center. Wish for a Fish webpage http://www.lewiscenter.org/Local-Programs/Mohave-Tui-Chub/index.php Accessed April 14, 2012
[6] The Lewis Center. Working with Mohave tui chub. Web page: http://lcermtcrefugia.blogspot.com/ Accessed April 14, 2012
[7] Woo, D. and D. Hughson. 2004. Zzyzx Mineral Springs- Cultural Treasure and Endangered Species Aquarium. Pages 84-87 in Harmon, D., B. M. Kilgore, and G. E. Vietzke, eds. Protecting Our Diverse Heritage: The Role of Parks, Protected Areas, and Cultural Sites. (Proceedings of the 2003 George Wright Society / National Park Service Joint Conference.) Hancock, Michigan: The George Wright Society, 2004. Available at http://www.georgewright.org/0320woo.pdf
[8] Grunwald, L. 2011. The endangered Mohave tui chub has a new home courtesy of Ventura FWO and others. U.S. Fish and Wildlife Service, FieldNotes Entry, November 16, 2011. Available at http://www.fws.gov/FieldNotes/regmap.cfm?arskey=31046
[9] U.S. Fish and Wildlife Service. 2011. Intra-Service Biological Opinion for Establishing Additional Populations of Mohave tui Chubs in the Mojave Desert in California (8-8-11-FW-22). August 26, 2011. Available at http://www.dmg.gov/documents/20110826_MEMO_BO_Mohave_Tui_Chub_U.S. Fish and Wildlife Service.pdf
[10] Hoover, F. and J. A. St. Amant. 1983. Results of Mohave chub, Gila bicolor mohavensis, relations in California and Nevada. California Fish and Game 69(1):54-56. Available at http://hegel.lewiscenter.org/users/mhuffine/subprojects/Student%20Led%20Research/chubworld/pdfs/hoover.pdf
[11] U.S. National Park Service. 2001. Environmental Assessment: Dredging of Lake Tuendae, Habitat for the Endangered Mohave tui chub (Gila bicolor mohavensis). Available at http://www.dmg.gov/documents/EA_Drdgng_Lake_Tuendae_Habitat_for_the_MTC_NPS_121709.pdf
[12] U.S. Fish and Wildlife Service.1988. Revised Recovery Plan for the Mohave Tui Chub Gila bicolor mohavensis. Available at http://hegel.lewiscenter.org/users/mhuffine/subprojects/Student%20Led%20Research/chubworld/pdfs/hoover.pdf
[13] Wullschleger, J., D. Hughson, and D. Woo. 2004. Recovering the Mohave tui chub. Natural Resource Year in Review – 2004. U.S. National Park Service. Available at http://www.nature.nps.gov/YearInReview/yir2004/03_M.html
[14] St. Amant, J. A. and S. Sasaki, 1971. Progress Report on Reestablishment of the Mohave Chub, Gila Mohavensis. Calif. Dept. of Fish and Game Vol. 57, pp. 307-308. Available at http://cluster.biodiversitylibrary.org/c/californiafishga57_4cali/californiafishga57_4cali_djvu.txt
[15] Russell, C.T. 1876. “Gentile Times: When do they end?” The Bible Examiner, Vol. XXI, No.1, October, 1876. Available at http://www.strictlygenteel.co.uk/examiner/examiner.html; Barbour, N.H. and C.T. Russell. 1877. Three Worlds and the Harvest of this World. Rochester, NY. Available at http://www.strictlygenteel.co.uk/threeworlds/threeworldstitle.html
[16] Russell, C.T. 1898. “Corroborative Testimony of God’s Stone Witness and Prophet: The Great Pyramid in Egypt. Box Ten in Thy Kingdom Come. Watch Tower Bible & Tract Society, Brooklyn, NY. Available at http://www.strictlygenteel.co.uk/kingdomcome/study10.html
[17] Russell, C. T. 1915. “View form the Watch Tower” Zion’s Watch Tower 36(1), January 1, 1915. Available at http://www.mostholyfaith.com/bible/Reprints/Z1915JAN.asp
[18] Jaeger, E.C. 1958. “Live on a Mojave Playa” Desert Magazine 21(2):24-26, February, 1958. available at http://mydesertmagazine.com/files/195802-DesertMagazine-1958-February.pdf
[19] Wikipedia. Curtis Howe Springer. http://en.wikipedia.org/wiki/Curtis_Howe_Springer. accessed April 15, 2012.
[20] Bureau of Investigation 1935. ""Bureau of Investigation: Curtis Howe Springer - A Quack and His Nostrums.” Journal of the American Medical Association, 105(11): 900-902, September 14, 1935. Available at http://jama.ama-assn.org/content/105/11/900.full.pdf
[21] Rasmussen, C. 2002. Zzyzx: An Unlikely Home of Hucksterism and Miracle Cures. Los Angeles Times, June 16, 2002. Available at http://articles.latimes.com/2002/jun/16/local/me-then16
[22] Hays, L. 2005. Pilgrims in the Desert: The Early History of the East Mojave Desert and Baker, California. Mojave Historical Society.
Owens pupfish (Cyprinodon radiosus)
| Status: Endangered | Critical habitat: none | Listed: 3/11/1967 | Recovery plan: 9/30/1998 |
Range: CA
SUMMARY
The Owens pupfish was pushed to the brink of extinction by water diversion and believed extinct by 1942 until it was rediscovered in 1964; the species was protected as endangered in 1967. Current threats are invasive vegetation and fish and stochastic events. A single population of 200 fish was rediscovered in 1964. Following protection in 1967, new populations were established. As of 2008 there were four populations and an estimated total of up to 13,200 fish.
RECOVERY TREND
The Owens pupfish (Cyprinodon radiosus) is a small fish that is about 2.5 inches long and is only found in the Owens Valley portion of the Owens River in Mono and Inyo counties, Calif. Males are bright blue and become brighter during the spring and summer mating season; females are dusky olive-green. Owens pupfish congregate in small schools and feed mostly on aquatic insects. Females may be involved in spawning acts up to 200 times per day, laying one to eggs at a time in spring and summer. They live for one to three years [1].
Owens pupfish were once widespread along the Owens River, occurring in clear
waters of springs, sloughs and marshes along the river from Fish Slough in Mono County south to Lone Pine in Inyo County [1]. The fish were so numerous that the native Paiute tribe captured large numbers of pupfish with basket-like nets and dried them for use as winter food [2]. The species was believed to be extinct by 1942, because of water diversions, until a small population of about 200 individuals was discovered in Fish Slough in 1964. The Owens pupfish was protected as an endangered species in 1967.
Endangered Species Act protection led to the establishment of new populations and aggressive management actions to reduce threats to the fish.
The rediscovered population was nearly lost to predation by introduced fishes. In 1969 Phil Phister captured the remaining individuals, and for a brief time the world’s total population of the species was held in two buckets while Phister and his colleagues worked to build a barrier and remove the invasive fish species that were preying on the pupfish. Phister succeeded in saving the pupfish.
As of 2008 there were four populations of this species: Fish Slough, Mule Springs, Warm Springs and Well 368. Progress is also being made toward establishing two new pupfish populations [2]. The population has increased from around 200 fish at the time of listing to an estimated population of 1,500 to 13,200 fish as of 2008 [2].
The Fish Slough population is made up of three subpopulations: The BLM Springs sub-population, which supported an estimated 1,000 to 10,000 fish in 2008 and is ranked as increasing; the BLM Ponds subpopulation, which supported 100 fish in 2008 and is ranked as stable; and the Marvin’s Marsh subpopulation, which supported 100 to 1,000 fish in 2008 and is ranked as declining.
The Warm Springs population supported fewer than 100 fish in 2008 and is ranked as increasing. The Mule Springs population supported 100 to 1,000 fish in 2008 and is ranked as stable. The Well 368 population contained 100 to 1,000 fish in 2008 and is ranked as stable.
Ongoing threats to the Owens pupfish include habitat encroachment by aquatic vegetation, predation by nonnative species, and stochastic factors such as random weather events and genetic effects from small population size.
CITATIONS
[1]. U.S. Fish and Wildlife Service. 1998. Owens Basin wetland and aquatic species
recovery plan, Inyo and Mono Counties, Calif. Portland, Ore. pp. 18-113.
[2]. U.S. Fish and Wildlife Service. 2009. Owens Pupfish (Cyprinodon radiosus)
5-Year Review: Summary and Evaluation. Ventura, Calif. 21 pp.
Pacific green sea turtle (Chelonia mydas agassizi)
| Status: Threatened/Endangered | Critical habitat: none | Listed: 7/28/1978 | Recovery plan: 1/12/1998 |
Range: AS(b), CA(s), GU(b), HI(b), MP(b), OR(o), WA(o) ---
SUMMARY
Green sea turtles in the Pacific are threatened by habitat loss, egg collection, hunting, beach development, bycatch mortality in commercial fisheries, and sea level rise due to global warming. Since being protected in 1978, the number of females nesting at East Island of French Frigate Shoals, approximately half of the total Hawaii population, increased from 105 in 1978 to 808 in 2011.
RECOVERY TREND
The green sea turtle (Chelonia mydas) occurs throughout the tropical and subtropical waters of the Mediterranean, Atlantic, Pacific and Indian oceans, and as far north as Massachusetts [1, 5]. It migrates long distances between foraging and nesting areas [5]. Typical near-shore habitats are shallow waters inside bays, reefs and inlets. Most nesting occurs on minimally disturbed open beaches. Females generally reproduce every two or more years, with an average of three to four nests during a breeding year.
U.S. populations occur in the Atlantic from Massachusetts to Texas and the Caribbean, and in the Pacific from the mainland coast to Hawaii, Guam and the Mariana Islands [1, 5]. Nesting populations within the United States have increased in size since the species was protected in 1978.
The taxonomic distinctions between Pacific and East Pacific populations of green sea turtle are under review. It remains unresolved whether C. mydas agassizii qualifies as a separate species or a subspecies of green sea turtle.
HAWAII AND THE FAR PACIFIC
In Hawaii, most nesting occurs at East Island of French Frigate Shoals [2, 6]. Nesting females increased there from 75 in 1973 to 808 in 2011 due to cessation of hunting and protection of habitat [6, 8]. The number of nesting females at East Island represents approximately half of the estimated number of nesting females in all of Hawaii [9].
Other U.S.-associated Pacific Islands that support green sea turtle populations include American Samoa (25-35 nesting females), the Federated States of Micronesia (three atolls, more than 100 nesting females) and Guam (little but regular nesting) [2]. In general, the major threat on urbanized Pacific islands is habitat loss and problems associated with rapidly expanding tourism. In particular, human development is having an increasingly serious impact on green sea turtle nesting beaches. On rural and developing islands, including American Samoa and some islands of the Northern Mariana Islands and Micronesia, human consumption of turtles remains a problem. The relatively recent increase in fibropapillomatosis (a tumorous disease) is a concern [2].
U.S. MAINLAND
The population status and migratory habits of East Pacific green turtles frequenting waters off the U.S. West Coast are unknown, and there are no known nesting sites in the United States [3]. Severe population declines in this population over the past 30 years were due largely to massive overharvesting of wintering turtles in the Sea of Cortez from 1950-1970 and intense collection of eggs between 1960 and early 1980 on mainland beaches of Mexico. The population was thought to be declining as of 1998. A small group (30-50) of resident East Pacific green sea turtles is found in San Diego Bay. Although they do not nest in the United States, this group appears to remain in the area for much of the year because of the warm water effluent from a power-generating station [2]. There is a ban on high-speed boat traffic in the south portion of the bay, but it is rarely enforced and boat strikes may pose a threat [2].
CITATIONS
[1] Plotkin, P.T. (editor). 1995. National Marine Fisheries Service and U. S. Fish and Wildlife Service Status Reviews for Sea Turtles Listed under the Endangered Species Act of 1973. National Marine Fisheries Service, Silver Spring, Maryland.
[2] National Marine Fisheries Service and U.S. Fish and Wildlife Service. 1998. Recovery Plan for U.S. Pacific Populations of the Green Turtle (Chelonia mydas). National Marine Fisheries Service, Silver Spring, MD.
[3] National Marine Fisheries Service and U.S. Fish and Wildlife Service. 1998. Recovery Plan for U.S. Pacific Populations of the East Pacific Green Turtle (Chelonia mydas). National Marine Fisheries Service, Silver Spring, MD.
[5] U.S. Fish and Wildlife Service. 1991. Recovery Plan for U.S. Populations of Atlantic Green Turtle. National Marine Fisheries Service, Washington, DC.
[6] Tiwari, M., G.H. Balazs and S. Hargrove. 2010. Estimating carrying capacity at the green turtle nesting beach of East Island, French Frigate Shoals. Mar Ecol Prog Ser. Vol. 419:289–294.
[7] National Marine Fisheries Service and U.S. Fish and Wildlife Service. 2007. Green Sea Turtle (Chelonia mydas) 5-Year Review: Summary and Evaluation. 105 pp.
[8] Maison, K.A., I. Kinan Kelly and K.P. Frutchey. 2010. Green Turtle Nesting Sites and Sea Turtle Legislation throughout Oceania. U.S. Dep. Commerce, NOAA Technical Memorandum. NMFS-F/SPO-110, 52 pp. http://spo.nmfs.noaa.gov/tm/110.pdf
[9] Ishizaki, A. 2012. Personal communication. Protected Species Coordinator, Western Pacific Regional Fishery Management Council. May 19, 2012.
Palos Verdes blue (Glaucopsyche lygdamus palosverdesensis)
| Status: Endangered | Critical habitat: 7/2/1980 | Listed: 7/2/1980 | Recovery plan: 1/19/1984 |
Range: CA(b) ---
SUMMARY
Habitat loss, degradation and fragmentation drove the Palos Verdes blue butterfly to near extinction. It remains threatened by severe weather, climate change, invasive species and fire suppression. This butterfly was protected as endangered in 1980. In 1984 it was believed extinct. It was then rediscovered, and a captive-breeding program was established. As of 2008 there were 219 butterflies.
RECOVERY TREND
The Palos Verdes blue butterfly (Glaucopsyche lygdamus paloverdesensis), a subspecies of the silvery blue, was discovered in the early 1970s [1]. It was originally found on the cool, fog-shrouded seaward side of the Palos Verdes Hills on the Palos Verdes Peninsula in Los Angeles County [2] and was subsequently found on the inland side of the peninsula [3]. The Palos Verdes blue (PVB) is dependent on two known host plants, locoweed (Astragalus trichopodus var. lonchus), also known as Santa Barbara milkvetch, and common deerweed (Lotus scoparius) [2]. An adult flight period occurs from late January through mid-April [2]. Eggs are typically laid in the flower heads of either deerweed or locoweed where the caterpillars then feed [2]. When the larvae mature, they crawl into the leaf litter to pupate. The pupae emerge as the next generation of adult butterflies in spring [2].
The historic PVB population was likely continuous across the 5,000 hectares of coastal scrub habitat that covered the south half of the Palos Verdes peninsula [1]. Intensive development of this area began in the 1950s and by the time of its discovery in the early 1970s, the PVB was already reduced to a few habitat fragments. By 1994 the 500 hectares of habitat remaining was not continuous and consisted of a mosaic of coastal sage scrub assemblages interspersed with disturbed patches [1]. When the Palos Verdes blue was listed in 1980, three localities known to support the species were listed as critical habitat [4]. Host plants on two of these sites were extirpated by 1985 due to the spread of weeds and annual grasses [4]. At the third site, construction by the city of Rancho Palos Verdes at Hesse Park in 1982 (in violation of the federal Endangered Species Act) destroyed what was then probably the second-largest remaining PVB colony [1].
Although population numbers were not estimated in the 1980s, there were probably fewer than 300 adults among all remaining habitat fragments [1]. In 1983, there were sightings of only four to seven adult PVBs [1]. Loss of habitat in combination with extremely harsh winters in 1983 and 1984 was thought to have led to the extinction of the PVB [1]. For 11 years, the PVB was thought to be extinct. Then, in 1994 the butterfly was re-discovered at the Defense Fuel Support Point managed by the Department of Defense at San Pedro, Calif. [1].
The rediscovered population was composed of only a few hundred individuals [5]. Because this single population was in danger of extinction from stochastic factors, a captive propagation effort was started and efforts to restore habitat were initiated [5]. The captive rearing program has maintained a captive population of PVB since 1995 [5]. Breeding results were poor from 1995 to 1998 but saw increased success in 1999 when 627 pupae were produced. In 2000, 968 pupae were produced [5]. In 2004, 231 were produced followed by 93 in 2005 [3]. Since 1994, captive reared butterflies have been used to augment the existing colony and in 2000 pupae were reintroduced to a nearby natural area known as the Chandler preserve, which resulted in the emergence of 306 PVB adults [6]. The reintroduced butterflies mated and eggs were deposited on more than 1,000 food plants on the six-acre natural area [6]. By 2000, 17 acres around the Defense Fuel Support Site had been planted with native vegetation [6].
Estimated PVB populations have fluctuated since 1994 [7]. In 2003 the population dropped from an estimated 215 individuals to 30 but recovered to 282 in 2004 [7] and 204 in 2005 [3]. Large increases and decreases in population are expected since butterfly abundance is known to vary with environmental conditions, especially with weather, and because they may be capable of multi-year diapause [7]. An analysis of occupancy trends at monitoring transects suggests a decline in area occupied by the PVB [7]. Although this could be due to actual declines, it could also indicate a shift in occupancy [6]. Monitoring transects have remained at fixed locations, and it is possible that the butterflies have moved as successional habitat matured [7]. Regardless, recovery efforts should concentrate on providing more habitat for the PVB. Currently weed control efforts, off-road vehicle use, nonnative plant invasion, and fire suppression negatively impact PVB habitat [2]. As of 2008 there were 219 butterflies [8].
CITATIONS
[1] Mattoni, R. 1995. Rediscovery of the endangered Palos Verdes blue butterfly, Glaucopsyche lygdamus palosverdesensis Perkins and Emmel (Lycaenidae). Journal of Research on the Lepidoptera 31(3-4)180-194.
[2] The Butterfly Conservation Initiative. American Zoo and Aquarium Association. The Palos Verdes Blue Butterfly. Website http://www.butterflyrecovery.org/species_profiles/palos_verdes_blue/
[3] Longcore, T. 2005. Personal communication with Travis Longcore, Urban Wildlands Center, University of California.
[4] Arnold, R. A., 1987. Decline of the endangered Palos Verdes Blue Butterfly in California. Biological Conservation 40(3):203-217.
[5] Mattoni, R., T Loncore, Z. Krenova, A. Lipman. 2003. Mass rearing of the endangered Palos Verdes blue butterfly Glaucopsyche lygdamus palosverdesensis (Lycaenidae). Journal of Research on the Lepidoptera. 37:55-67.
[6] Mattoni, R. and N. Powers. 2000. The Palos Verdes Blue; an Update. The Endangered Species Bulletin. 25(6).
[7] Longcore, T., and R. Mattoni. 2005. Final Report for 2005 Palos Verdes Blue Butterfly Adult Surveys on Defense Fuel Support Point, San Pedro, California. Los Angeles: The Urban Wildlands Group (Defense Logistics Agency Agreement # N68711-05-LT-A0012). 11 pp.
[8] U.S. Fish and Wildlife Service. 2008. Palos Verdes Blue Butterfly 5-Year Review: Summary and Evaluation. Carlsbad, CA. 16 pp.
San Clemente Island bush mallow (Malacothamnus clementinus)
| Status: Endangered | Critical habitat: none | Listed: 8/11/1977 | Recovery plan: 1/26/1984 |
Range: CA
SUMMARY
The San Clemente Island bush mallow declined due to overgrazing by introduced sheep, goats and pigs. Removal of the animals has allowed it to rebound, but it remains threatened by military training activities, erosion, invasive plants and fire. At the time of listing in 1977, only one to two plant colonies plant were known to survive. By 2007, 32 were known.
RECOVERY TREND
The San Clemente Island bush mallow (Malacothamnus clementinus) is endemic to California’s San Clemente Island [1]. It is a rounded, evergreen shrub with inflorescences of crowded, pink flowers [1]. It was discovered in 1923 growing on the walls of a single canyon [2]. Later, another eight to 10 clumps of 15 to 20 individuals were discovered on the walls of other canyons [2]. Grazing by feral sheep, goats and pigs introduced to the island in the late 1800s damaged native vegetation [3] and left bush mallow plants only in places inaccessible to the feral animals [2].
In 1962, programs to eradicate feral animals on the island were initiated by the Navy, which in 1934 acquired the island for a military training facility [3]. These efforts were unsuccessful, but renewed efforts in the 1980s led to the extirpation of feral animals on the island in 1992 [3]. Since the Navy’s eradication efforts, native vegetation has begun to recover [1]. Bush mallow habitat in one canyon, however, is in a bombing impact zone [1]. This poses a potential direct threat to the plants and could cause increased threat from erosion [1].
At the time of listing in 1977, there were only two known colonies. The removal of feral goats and pigs has allowed the population to increase, and as of 2007, 30 new occurrences were known. In the 2007 Five-Year Review, the U.S. Fish and Wildlife Service recommended downlisting the plant [4], and in 2011 the Service issued a positive 90-day finding on a petition to downlist the bush mallow [5]. In 2012, however, the Service determined that the plant should not be downlisted because it continues to be threatened by military activities, erosion, nonnatives, fire, climate change, and low genetic diversity [6].
CITATIONS
[1] California Department of Fish and Game. 2004. The Status of Rare, Threatened, and Endangered Animals and Plants of California. Sacramento, CA. Available at <http://www.dfg.ca.gov/hcpb/species/t_e_spp/t_eplants.pdf>.
[2] Where Have All the Wildflowers Gone? A Region-by-Region Guide to Threatened or Endangered U.S. Wildflowers. Macmillan Publishing Co. Inc. NY.
[3] Helenurm, K., R West, and S.J. Burckhalter. 2005. Allozyme Variation in the Endangered Insular Endemic Castilleja grisea. Annals of Botany 95(7):1221-1227.
[4] U.S. Fish and Wildlife Service. 2007. Malacothamnus clementinus (San Clemente Island Bush Mallow) 5-Year Review: Summary and Evaluation. Carlsbad Fish and Wildlife Office. 30 pp.
[5] U.S. Fish and Wildlife Service. 2011. 90-Day Finding on a Petition to Delist or Reclassify From Endangered to Threatened Six California Species. 76 FR 03069.
[6] U.S. Fish and Wildlife Service. 2012. 12-Month finding on a petition to downlist three San Clemente Island plant species. Advance notice. May 15, 2012. Available at:
https://s3.amazonaws.com/public-inspection.federalregister.gov/2012-11339.pdf.
San Clemente Island lotus (Lotus dendroideus var. traskiae )
| Status: Endangered | Critical habitat: none | Listed: 8/11/1977 | Recovery plan: 1/26/1984 |
Range: CA
SUMMARY
The San Clemente Island lotus became endangered due to overgrazing. Following its listing as an endangered species in 1977, feral ungulates were eradicated from the island, but military training and invasive species remain a threat. This plant has increased from 1,340 individuals in nine sites in 1980 to 3,525 individuals in 29 sites in 2011. A proposal to downlist the lotus from "endangered" status to "threatened" status was issued in 2012.
RECOVERY TREND
San Clemente Island lotus (Acmispon dendroideus var. traskiae), formerly called San Clemente Island broom, is endemic to California’s San Clemente Island, where it grows on open, grassy slopes and hillsides.
Populations declined drastically following the introduction of domestic and feral herbivores to the island, leading to listing as an endangered species in 1977. By 1993 feral ungulates had been eradicated, leading to a dramatic rebound and a recommendation by the U.S. Fish and Wildlife Service to downlist the species to "threatened" status in 2007 [1] and a proposal to downlist in 2012 [3]. The plant remains threatened by military training activities, erosion and invasive species [2].
The earliest published information regarding population size for the lotus states that nine occurrences and 1,340 individuals were present on the island in 1980. As of 2011 the total number of plants was estimated at 3,525 in 29 sites [3].
The original range and distribution of the lotus on San Clemente Island is speculative because its decline began before thorough surveys were conducted. Occurrence data now spans the length of the island, with the species range including north-facing slopes over most of the eastern and western sides of the island [1].
CITATIONS
[1] U.S. Fish and Wildlife Service. 2007. Lotus dendroideus var. traskiae (San Clemente Island lotus) 5-Year Review: Summary and Evaluation. Carlsbad Fish and Wildlife Office, Carlsbad, California. 24 pp.
[2] U.S. Fish and Wildlife Service. 2011. 90-Day Finding on a Petition To Delist or Reclassify From Endangered to Threatened Six California Species. January 19, 2011. 76 FR 03069.
[3] U.S. Fish and Wildlife Service. 2012. 12-Month finding on a petition to downlist three San Clemente Island plant species. Advance notice. May 15, 2012. Available at:
https://s3.amazonaws.com/public-inspection.federalregister.gov/2012-11339.pdf.
San Clemente Island paintbrush (Castilleja grisea)
| Status: Endangered | Critical habitat: none | Listed: 8/11/1977 | Recovery plan: 1/26/1984 |
Range: CA(b) ---
SUMMARY
The San Clemente Island paintbrush declined in the middle of the last century, largely due to grazing and trampling by feral goats and pigs. Since being listed as an endangered species in 1979, its population increased from 500 plants to 11,733 in 2011. In 2012, the U.S. Fish and Wildlife Service proposed downlisting the paintbrush from “endangered” to “threatened” status.
RECOVERY TREND
The San Clemente Island paintbrush (Castilleja grisea) is one of 13 plant species endemic to the Island of San Clemente, Calif. [1]. The San Clemente Island paintbrush is a somewhat shrubby plant with yellow blooms [2] associated with the sage scrub community on the island [3]. It is likely partially parasitic on shrubs in the “goldenbrush” family [3].
The decline of the San Clemente Island paintbrush was primarily due to grazing and trampling by feral goats and pigs [1]. Livestock were eliminated from the island prior to the establishment of a military training facility in the 1930s, but some feral goats and pigs remained and their populations increased dramatically [4]. Plants that survived the increase in grazing and trampling tended to be located on steep cliff faces which goats and pigs could not easily access [1].
In 1939, a collector described the San Clemente Island paintbrush as common on the lower slope of bluffs on the southeast coast of the island [2]. By 1963 it had declined to the point of being described as “occasional on the southeast coast and rare on canyon-sides elsewhere” [2]. An effort to remove feral animals from the island was initiated in 1962, but was unsuccessful [4]. By 1978 few paintbrushs could be found [2]. A survey of the entire island conducted in 1979 found a total of 450 plants [2].
Following the paintbrush's listing as an endangered species in 1979, efforts were renewed to remove goats and pigs, resulting in their extirpation in 1992 [4]. Following the elimination of these animals, paintbrush populations began to increase and expand [4]. In 1996 and 1997, 77 populations of San Clemente Island paintbrush were mapped on the island, totaling more than 3,500 plants [5]. In 2003 and 2004, surveyors mapped an additional 42 locations and 1,120 individuals [6]. Occurrences ranged from isolated plants to 200 individuals. These new occurrences were mainly concentrated in steep canyons on the western side of the island, although a few were discovered near previously recorded individuals in the eastern canyons. Taken together, these two surveys suggest that Castilleja grisea can currently be found in approximately 119 locations on San Clemente Island [6]. In 2011 the total number of plants was estimated at 11,733 [7].
In the 2007 Five-Year Review, the U.S. Fish and Wildlife Service recommended downlisting the paintbrush from "endangered" to "threatened" status [6]. The Service issued a proposal to downlist the paintbrush in May 2012 [7].
CITATIONS
[1] Center for Plant Conservation. CPC National Collection Plant Profile: Castilleja grisea. Website <http://www.centerforplantconservation.org/ASP/CPC_ViewProfile.asp?CPCNum=817> accessed January, 2005.
[2] Mohlenbrock, R.H. 1983. Where Have All the Wildflowers Gone? A Region-by-Region Guide to Threatened or Endangered U.S. Wildflowers. Macmillan Publishing Co. Inc. NY.
[3] Endangered Species Information System. 1996. Fish and Wildlife Information Exchange, VA Tech. San Clemente Island Indian Paintbrush. Website <http://fwie.fw.vt.edu/WWW/esis/lists/e701029.htm> accessed January, 2005.
[4] Helenurm, K., R West, and S.J. Burckhalter. 2005. Allozyme Variation in the Endangered Insular Endemic Castilleja grisea. Annals of Botany 95(7):1221-1227.
[5] Junak S.A. and D.H. Wilken. 1998. Sensitive plant status survey, Naval Auxiliary Landing Field, San Clemente Island, California. Santa Barbara, CA: Santa Barbara Botanic Garden.
[6] U.S. Fish and Wildlife Service. 2007. Castilleja grisea (San Clemente Island Indian Paintbrush) 5-Year Review: Summary and Evaluation. Carlsbad Fish and Wildlife Office. 21 pp.
[7] U.S. Fish and Wildlife Service. 2012. 12-Month finding on a petition to downlist three San Clemente Island plant species. Advance notice. May 15, 2012. Available at:
https://s3.amazonaws.com/public-inspection.federalregister.gov/2012-11339.pdf.
San Clemente loggerhead shrike (Lanius ludovicianus mearnsi)
| Status: Endangered | Critical habitat: none | Listed: 8/11/1977 | Recovery plan: 1/26/1984 |
Range: CA(b) ---
SUMMARY
The San Clemente loggerhead shrike's habitat was severely degraded by sheep, pigs, mule deer and goats beginning in the late 1880s. Nonnative grazers have been eliminated, but nonnative predators such as cats and rats are a significant threat. There were about 50 birds in 1977 when the shrike was listed as an endangered species. It declined to just 14 birds in 1998. A captive breeding program was initiated in 1999, steadily increasing the species to a minimum of 185 breeding birds in 2009.
RECOVERY TREND
The San Clemente loggerhead shrike (Lanius ludovicianus mearnsi) is endemic to San Clemente Island off the coast of Southern California. Its habitat has been degraded by sheep, pigs, mule deer and goats since the late 1880s [1]. The U.S. Navy took control of the island in 1934, began removing feral ungulates in 1973, and completed the task in 1993 [2]. Following the removal of goats, fire became a significant habitat destruction factor [1]. Predation by feral cats, island foxes and ravens was responsible for 44 percent of nest failures in the late 1980s [1]. Nonnative grazers have been completely removed from the island, which has allowed native shrubs and trees to begin the process of vegetation recovery that is expected to support nesting by shrikes and increase the invertebrate and vertebrate prey base. Nonnative predators (cats and black rats) are now considered the highest cause of mortality to shrikes on San Clemente Island, despite current efforts to remove the predator pressure [9].
The shrike declined to about 20 birds in the early 1900s [7]. In 1977, when the species was listed, the number of shrikes had increased to about 50 [3], but then declined to 14-19 birds between 1996 and 1999 [6]. Between 1999 and 2005, 255 captive reared shrikes were hacked into the wild [8]. Combined with control of shrike predators and habitat protection, the reintroduction program steadily increasining the population to a minimum of 185 breeding birds in 2009 [6].
CITATIONS
[1] Yosef, R. 1996. Loggerhead Shrike (Lanius ludovicianus). In The Birds of North America, No. 231 (A. Poole and F. Gill, eds.). The Academy of Natural Sciences, Philadelphia, and The American Ornithologists’ Union, Washington, D.C.
[2] U.S. Department of the Navy, Southwest Division. 2002. San Clemente Island Integrated Natural Resources Management Plan Final, May 2002. San Diego, CA. Prepared by Tierra Data Systems, Escondido, CA.
[3] U.S. Fish and Wildlife Service. webpage. San Clemente loggerhead shrike, Lanius ludovicianus mearnsi. http://ecos.fws.gov/docs/life_histories/B05R.html accessed January 7, 2006.
[4] U.S. Navy. 2004. Something to shrike about. Currents, Fall 2004:7-13.
[5] NatureServe. 2005. NatureServe Explorer: An online encyclopedia of life [web application]. Version 4.5. NatureServe, Arlington, Virginia.
[6] Institute for Wildlife Studies. 2012. San Clemente Loggerhead Shrike (Lanius ludovicianus mearnsi) website http://www.iws.org/species_loggerhead_shrike.html. Accessed May 6, 2012
[7] U.S. Navy. 2001. Shrike Back. Currents, Fall 2001.
[8] U.S. Fish and Wildlife Service. 2009. San Clemente Loggerhead Shrike (Lanius ludovicianus mearnsi) 5-Year Review: Summary and Evaluation. Carlsbad Fish and Wildlife Office. 22 pp.
San Clemente sage sparrow (Amphispiza belli clementeae)
| Status: Threatened | Critical habitat: none | Listed: 8/11/1977 | Recovery plan: 1/26/1984 |
Range: CA(b) ---
SUMMARY
The San Clemente sage sparrow declined due to the effects of overgrazing. Nonnative ungulates have been removed from the island, but the sparrow remains threatened by military activities, predation, fire and climate change. In 1976, there were 112 sage sparrows. The species was listed as endangered in 1977 and increased to 1,240 sparrows in 2010; an increase of 1,233 percent.
RECOVERY TREND
The San Clemente sage sparrow (Amphispiza belli clementeae) is endemic to San Clemente Island off the coast of Southern California. It occurs in three discontinuous patches of maritime sage scrub dominated by boxthorn (Lycium californicum): a narrow coastal belt on the western shore extending north from Seal Cove, a smaller area four kilometers to the south, and a degraded site just north of the runway on the north end of the island [4]. Its habitat has been degraded by sheep, pigs, mule deer and goats since the late 1880s [1]. The U.S. Navy took control of the island in 1934, began removing feral ungulates in 1973, and completed the task in 1992 [2].
The primary threat identified at listing, the browsing effect of feral goats and the rooting effect of feral pigs, has been eliminated, although impacts to the habitat from the historic overgrazing remain. Other ongoing threats include habitat modification from military activities, increased fire frequency, and fire suppression activities; predation from introduced and native predators; small population size, low juvenile survivorship, and limited distribution. The species is also threatened by climate change [8].
The sage sparrow was common in the early 1900s [5], but declined to 112 birds in 1976 [7]. It was listed as an endangered species in 1977, increased to 360 in 1981 [6], then declined to 38 in 1984 [6], before increasing to 195-280 in 1986 [7]. Contemporary populations have ranged from a low of 452 individuals in 2000 to a high of 1,519 individuals in 2002 [8]. In 2010, the population was estimated at 1,240 adults [9].
CITATIONS
[1] U.S. Fish and Wildlife Service. 1984. Recovery Plan for the Endangered and Threatened Species of the California Channel Islands. U.S. Fish and Wildlife Service, Portland, OR. 165 pp.
[2] U.S. Navy, Southwest Division. 2002. San Clemente Island Integrated Natural Resources Management Plan Final, May 2002. San Diego, CA. Prepared by Tierra Data Systems, Escondido, CA.
[3] Institute for Widlife Studies. 2005. San Clemente sage sparrow. Website <www.iws.org/san_clemente_sage_sparrow.htm> accessed October 1, 2005.
[4] SERG. 2003. TAR 4 Habitat Monitoring and Restoration Plan. Soil Ecology and Research Group, San Diego State University. Available at <www.serg.sdsu.edu/SERG/restorationproj/channel_islands/TAR4/TAR4.htm>.
[5] Martin, J. W., and B. A. Carlson. 1998. Sage Sparrow (Amphispiza belli). In The Birds of North America, No. 326 (A. Poole and F. Gill, eds.). The Birds of North America, Inc., Philadelphia, PA.
[6] Hyde, K.M. 1985. The status of the San Clemente sage sparrow. Unpublished report on file at: the Natural Resources Office, North Island Naval Air Station, San Diego, CA. 55 pp.
[7] NatureServe. 2005. NatureServe Explorer: An online encyclopedia of life [web application]. Version 4.5. NatureServe, Arlington, Virginia.
[8] U.S. Fish and Wildlife Service. 2009. San Clemente sage sparrow (Amphispiza belli clementeae) 5-Year Review: Summary and Evaluation. Carlsbad Fish and Wildlife Office. 29 pp.
[9] United States Department of Navy. 2012. Draft Environmental Assessment for the Replacement of the Fuel Storage and Distribution System, Naval Auxiliary Landing Field, San Clemente Island, CA. Available at https://www.neco.navy.mil/necoattach/N6247312R14020003Draft_San_Clemente_Island_EA_March_2012[1].pdf.
San Miguel island fox (Urocyon littoralis littoralis)
| Status: Endangered | Critical habitat: 11/9/2005 | Listed: 3/5/2004 | Recovery plan: none |
Range: CA
SUMMARY
The San Miguel Island fox occurs only on San Miguel Island off the Southern California coast. It is threatened by disease from domestic dogs and predation by golden eagles. The population declined catastrophically from 450 in 1994 to 15 in 1999. Following listing in 2004, measures such as captive breeding, relocation of golden eagles and introduction of bald eagles allowed the population to grow to 393 in 2011.
RECOVERY TREND
The San Miguel Island fox (Urocyon littoralis littoralis) is one of six island fox subspecies endemic to each of the six Channel Islands off the coast of Southern California [1]. It declined from around 450 adults in 1994 to 15 in 1999 [2]. The National Park Service initiated emergency measures to save the fox in 1999, and in 2004 the species was listed as endangered [1]. In 2000, all but one of the wild foxes were brought into captivity to initiate a captive-breeding program [2]. By 2003, no wild foxes remained. By 2005, there were 40 wild and 26 captive foxes.
Predation by golden eagles was determined to be the primary cause behind the decline [1]. Prior to the 1990s, golden eagles did not occur on the Channel Islands; possibly because they were kept away by bald eagles native to the islands. Declines in bald eagle populations, however, and the introduction of feral pigs to the islands (providing a prey base for the golden eagle) may have led to colonization by golden eagles. Golden eagle removal efforts and reintroduction of bald eagles to the island have allowed the fox population to increase. The population of San Miguel island foxes reached 393 in 2011 [3].
CITATIONS
[1] National Park Service. Island Fox recovery Program 2004 Annual Report. Channel Islands National Park, Technical Report 05-07.
[2] Coonan, T. 2006. Year-end population data for three island fox subspecies, 1994-2005. Spreadsheet provided by Tim Coonan, Channel Islands National Park, May 8, 2006.
[3] Coonan, T. 2011. Personal Communication, Population of San Miguel and Santa Rosa Island Foxes.
Santa Catalina island fox (Urocyon littoralis catalinae)
| Status: Endangered | Critical habitat: 11/9/2005 | Listed: 3/5/2004 | Recovery plan: none |
Range: CA
SUMMARY
The Santa Catalina island fox is endemic to Santa Catalina Island, where it is threatened by canine distemper, predation by feral cats and car collisions. At the time of listing in 2004, there were around 300 Santa Catalina Island foxes. Captive breeding and other conservation efforts allowed the population to increase to 1,542 as of 2012.
RECOVERY TREND
The Santa Catalina island fox (Urocyon littoralis catalinae) is found only on Santa Catalina Island, off the California coast [1]. It weighs 4 to 6 pounds, and is primarily monogamous, living about 10 years and having litters of two to three pups [2]. As a result of introduced canine distemper virus, the population plummeted in the 1990s, dropping as low as 100 in 1999. Conservation efforts, including distemper vaccinations, captive breeding and release, relocation and wild fox population monitoring were initiated [2]. The fox was listed as endangered in 2004, when its population was around 300 [2]. Captive breeding was discontinued at about that time.
Conservation efforts since listing have been very successful, with the population reaching 1,008 in 2010 [2] and 1,542 in early 2012 [1]. Current management includes trapping, inspection for illnesses, vaccination against distemper and rabies, telemetry collaring and monitoring, and regulating traffic speed [1]. A worrying trend of ear cancer has arisen, and vehicle mortality continues to be a concern [2].
CITATIONS
[1] Sahagun, L. January 19, 2012. Catalina Island fox makes astounding comeback. Los Angeles Times. Available online at http://www.latimes.com/news/local/la-me-fox-20120119,0,6967247.story.
[2] Cataliina Island Conservancy. 2010. Recovery of the Catalina Island Fox. Available online at http://www.catalinaconservancy.org/index.php?s=wildlife&p=recovery_of_the_catalina_island_fox. Accessed January 29, 2012.
Santa Cruz island fox (Urocyon littoralis santacruzae)
| Status: Endangered | Critical habitat: 11/9/2005 | Listed: 3/5/2004 | Recovery plan: none |
Range: CA
SUMMARY
The Santa Cruz island fox occurs only on Santa Cruz Island off the California coast. It is threatened by disease from domestic dogs and predation by golden eagles. The population declined from 1,465 in 1994 to just 60 in 2001, leading to the fox's protection in 2004. Due to captive breeding, relocation of golden eagles and introduction of bald eagles, the population grew to 1,302 in 2011.
RECOVERY TREND
The Santa Cruz fox (Urocyon littoralis santacruzae) is one of six island fox subspecies endemic to each of the six large Channel Islands off the coast of Southern California. It declined catastrophically from 1,465 animals in 1994 to 135 in 1999 and 60 in 2001 [2]. The National Park Service initiated emergency measures to save it in 1999, and in 2004 it was listed as an endangered species [1]. Twenty foxes were brought into captivity in 2002 and a captive-breeding program was initiated. By 2005, there were 150 wild and 62 captive foxes [2].
The primary cause of decline was predation by golden eagles [1]. Prior to the 1990s, golden eagles did not occur on the Channel Islands, possibly because they were kept away by nesting bald eagles. The extirpation of the bald eagle and the introduction of feral pigs to the islands (providing a prey base for the golden eagle) may have led to colonization of the islands by golden eagles. As of 2004, 37 golden eagles had been removed from Santa Cruz Island and efforts to remove them continue. Bald eagles have also been relocated onto the island. Conservation efforts have proven very successful, with the population growing to 1,302 Santa Cruz Island foxes in 2011 [3]. The captive breeding program ended in 2007.
CITATIONS
[1] National Park Service. Island Fox recovery Program 2004 Annual Report. Channel Islands National Park, Technical Report 05-07.
[2] Coonan, T. 2006. Year-end population data for three island fox subspecies, 1994-2005. Spreadsheet provided by Tim Coonan, Channel Islands National Park, May 8, 2006.
[3] Boser, C. 2011. Personal communication, Santa Cruz Island Fox Population Estimate.
Santa Rosa island fox (Urocyon littoralis santarosae)
| Status: Endangered | Critical habitat: 11/9/2005 | Listed: 3/5/2004 | Recovery plan: none |
Range: CA
SUMMARY
The Santa Rosa island fox occurs only on Santa Rosa Island off the Southern California coast. It is threatened by disease from domestic dogs and predation by golden eagles. The population declined dramatically from 1,780 in 1994 to 14 in 1999. Listing in 2004 and ensuing conservation measures allowed the population to increase to 280 as of 2011.
RECOVERY TREND
The Santa Rosa island fox (Urocyon littoralis santarosae) is one of six island fox subspecies endemic to each of the six large Channel Islands off the coast of Southern California. It declined catastrophically from 1,780 animals in 1994 to 14 in 1999 [2]. The National Park Service initiated emergency measures to save it in 1999, and in 2004 it was listed as an endangered species [1]. The 14 remaining wild foxes were brought into captivity in 2000 (leaving none in the wild) and a captive breeding program was initiated. The subspecies was reintroduced to the wild in 2003, and by 2005 there were 32 wild and 34 captive foxes [2].
The primary cause of decline was predation by golden eagles that moved onto the island following the extirpation of bald eagles, which chase away golden eagles [1]. The introduction of feral pigs also provided a prey base that allowed golden eagles to move onto Santa Rosa Island. Golden eagle removal efforts and bald eagle introduction efforts allowed the Santa Rosa Island fox to begin to recover. As of 2011 there were 280 foxes in the population [3].
CITATIONS
[1] National Park Service. Island Fox recovery Program 2004 Annual Report. Channel Islands National Park, Technical Report 05-07.
[2] Coonan, T. 2006. Year-end population data for three island fox subspecies, 1994-2005. Spreadsheet provided by Tim Coonan, Channel Islands National Park, May 8, 2006.
[3] Coonan, T. 2011. Personal Communication, Population of San Miguel and Santa Rosa Island Foxes.
Southern sea otter (Enhydra lutris nereis)
| Status: Threatened | Critical habitat: none | Listed: 1/14/1977 | Recovery plan: 4/3/2003 |
Range: CA(b) ---
SUMMARY
Southern sea otters were nearly hunted to extinction by the fur industry in the 19th and early 20th centuries. Today they are threatened by shark attacks, disease, pollution, oil spills, climate change and possibly ocean acidification. In 1976, just 1,789 sea otters remained. Following its listing as a threatened species in 1977, the sea otter increased to about 2,700 in 2005 and remained around this level through 2010. Its recovery goal is 3,090 otters averaged over three years.
RECOVERY TREND
The southern sea otter (Entydra lutris nereis) is found in shallow waters along the coast of central and southern California from Half Moon Bay to Point Conception [1].
A century ago otters were abundant, but by 1914, hunting by fur traders had reduced the population to 50 animals [1]. Passage of the International Fur Seal Treaty in 1911 protected remaining sea otters from further hunting, but by then, their distribution had become highly fragmented. It was placed on the endangered species list in 1977.
The southern sea otter continued to decline for six years after being listed as an endangered species, then increased relatively steadily from 1984 through 2005 [2]. Between 2005 (2,735 otters) and 2010 (2,719 otters), the population remained relatively stable [2], but about 400 otters below its recovery goal of 3,090 averaged over three years [1, 3].
Recent reproduction rates are similar to those of the past and are sufficient to have kept the otter on an increasing population trend between 2005 and 2010 [3]. The population remained flat because of increased mortality, especially among adults and subadults. The primary causes of mortality are shark attacks [4] and infectious diseases [3], which have been attributed to immune deficiencies, elevated parasite loads, pathogen exposure, and reduction in food resources in parts of the otter's central California range. Persistent organic pollutants and low genetic diversity may be contributing to otter immuno-suppression.
Otter also remain vulnerable to oil spills [3] and may be affected by declines in shell fish due to ocean acidification.
CITATIONS
[1] U.S. Fish and Wildlife Service. 2003. Final Revised Recovery Plan for the Southern Sea Otter (Enhydra lutris nereis). U.S. Fish and Wildlife Service, Portland, Oregon. Xi+pp.
[2] U.S. Geological Survey. 2011. California Sea Otter Survey Data website http://www.werc.usgs.gov/ProjectSubWebPage.aspx?SubWebPageID=4&ProjectID=91
[3] U.S. Fish and Wildlife Service. 2010. Southern Sea Otter Spotlight Species Action Plan 2010-2014. Available at www.fws.gov/ecos/ajax/docs/action_plans/doc3186.pdf
[4] U.S. Geological Survey. 2012. Number of Dead California Sea Otters Recovered in 2011 a Record High: Evidence Builds for White Shark Factor in Otter Mortalty. February 24, 2012 press relsease. http://www.usgs.gov/newsroom/article.asp?ID=3116#.T62tfujE_mc.
Steller sea-lion (eastern DPS) (Eumetopias jubatus (eastern DPS))
| Status: Endangered | Critical habitat: 8/27/1993 | Listed: 4/5/1990 | Recovery plan: 2/29/2008 |
Range: AK, CA, OR, WA
SUMMARY
The Steller sea-lion (eastern DPS) declined due to exploitation, predator control and prey base declines. These threats substantially declined following its listing as an endangered species in 1990 and designation of critical habitat in 1993. Its population increased about 21,000 animals in 1989 to 63,488 in 2009. In 2012 it was proposed for delisting due to high total numbers, but California trends remain weak, and the southernmost portion of its range has not been reoccupied.
RECOVERY TREND
The Steller sea lion (Eumetopias jubatus) is the largest of the eared seal family and occurs across the North Pacific Ocean rim from Japan to California [1]. The entire species was listed as threatened under an emergency rule in 1990 following an 82-percent decrease from 1960 population levels [2]. The factors behind population decline were a reduction in prey biomass and quality due to commercial fishing and oceanographic variability, and killer whale predation [1].
Due to differences in genetics and population trends, the Steller sea lion was separated into eastern and western distinct population segments (DPS) in 1997 for purposes of management by the National Marine Fisheries Service [1]. The eastern DPS of the Steller sea lion is considered to occur east of 144° W. longitude and extends east to British Columbia and south to California [1].
The eastern DPS of Steller sea lion was subject to substantial commercial exploitation and both sanctioned and unsanctioned predator control prior to the enactment of protective legislation in the 1970s in the U.S. and Canada [3]. Endangered Species Act protection in 1990 helped the sea lion move towards recovery, and in 2008 the federal recovery team determined that the eastern DPS appeared to have recovered from factors causing its decline [1]. In April 2012, the Fisheries Service published declaring the eastern Steller sea-lion recovered and removing it from the endangered species list [5].
Within the eastern DPS, 13 rookeries and about 85 major haulout sites are known from Cape Fairweather (58.8°N, 137.9°W ) to Año Nuevo Island (37.1°N, 122.3°W). Populations associated with 12 of these rookeries have either increased or stabilized at relatively high levels in recent years [1]. The population trend of the eastern DPS has been monitored by geographic regions, including southeast Alaska, British Columbia, Oregon and California. Because Steller sea lions range widely, estimates for a geographic area represent the number of animals supported by rookeries and not the exact numbers of animals present in the area. The populations in southeast Alaska, British Columbia and Oregon have more than doubled since the 1970s [1]. In southeast Alaska, counts of non-pups (adults and juveniles) increased from 5,585 in 1979 to 10,527 in 2005. In southeast Alaska, pup counts increased from 5,510 in 2005 to 7,443 in 2009 [4]. In British Columbia, non-pup counts increased from 4,617 in 1971 to 12,121 in 2002. In Oregon, non-pup counts increased from 1,461 in 1977 to 4,169 in 2002.
Overall, the DPS is estimated to have increased from 18,040 individuals in 1979 to 63,488 in 2009 [5].
Recovery in California has lagged behind the rest of the DPS [5]. California has experienced markedly different population trends at various rookeries and haulouts, with most sites at population levels substantially less than those of the early 1900s, yet apparent population stability in the last decade [1]. The sea-lion has not recolonized the southernmost portion of its range at San Miguel Island rookery. Factors impeding full recovery in California likely include a climate induced northward range shift, competition for space on land at haulouts and rookery sites, and possibly competition for prey with other more temperately adapted pinniped species such as California sea lions and northern elephant seals [5].
Factors that may continue to affect the eastern DPS include predation, reduced prey biomass and quality, toxic substances, global climate change and ocean acidification.
CITATIONS
[1] National Marine Fisheries Service. 2008. Revised Recovery Plan for the Steller sea lion (Eumetopias jubatus) Eastern and Western Distinct Population Segments. National Marine Fisheries Service, Silver Spring, MD. 325 pages.
[2] National Marine Fisheries Service. 1990. Listing of Steller Sea-lions as Threatened under the Endangered Species Act with Protective Regulations. April 5, 1990. 55 FR 12645.
[3]Pitcher, K. W., P. F. Olesiuk, R. F. Brown, M. S. Lowry, S. J. Jeffries, J. L. Sease, W. L. Perryman, C. E. Stinchcomb, and L. F. Lowry. 2006. Status and trends in abundance and distribution of the eastern population of Steller sea lion (Eumetopias jubatus). Fisheries Bulletin.
[4] National Marine Fisheries Service. 2010. 90-Day Finding on Petitions To Delist the Eastern Distinct Population Segment of the Steller Sea Lion. Dec. 13, 2010. 75 FR 77602.
[5] National Marine Fisheries Service. 2012. Proposed Delisting of Eastern DPS of Steller Sea Lions. April 18, 2012. 77 FR 23209.
Tidewater goby (Eucyclogobius newberryi)
| Status: Endangered | Critical habitat: 11/20/2000 | Listed: 2/4/1994 | Recovery plan: 12/7/2005 |
Range: CA
SUMMARY
The tidewater goby became endangered due to the widespread loss of California's coastal wetlands, lagoons and estuaries. It remains threatened by drought, water withdrawal, pesticides, pollution, cattle grazing and invasive species. Occupied localities have more than doubled since its listing as an endangered species in 1994, increasing from 48 to 106 in 2007. An initial positive decision to downlist to threatened status was made in 2011.
RECOVERY TREND
The tidewater goby (Eucyclogobius newberryi) is a small fish inhabiting discrete brackish water areas on the California coast. It is found from Tillas Slough (mouth of the Smith River, Del Norte County) near the Oregon border south to Cockleburr Canyon (northern San Diego County).
The goby became endangered due to habitat loss and degradation as California lost from 75 percent to-90 percent of its coastal wetlands. Many lagoons have been channelized or permanently opened with jetties and dredging so they no longer support the seasonally closed habitat of tidewater gobies. The U.S. Fish and Wildlife Service listed the tidewater goby as an endangered species in 1994 due to a decline in the number of tidewater goby populations (i.e., occupied tidewater goby localities) and the threat of coastal development. Habitat loss has slowed since then, but the goby remains threatened by agricultural and sewage effluents, pesticides, cattle grazing and feral pig activity, introduced fish predators, drought combined with human induced water reductions, isolation of populations, and competition with introduced fish species [1]. The northern limit of its historical range has not changed, but the southern limit is now 9.2 miles north of the historically southern location of Agua Hedionda Lagoon (San Diego County) [1].
No range-wide, long-term population data are available for the tidewater goby. Estimates of population size are generally lacking due to the constant variability in local abundance. Seasonal changes in distribution and abundance further hamper efforts to estimate population size for this short-lived species. Tidewater goby populations can also vary with between-year changes in environmental conditions such as drought. Assessments have been made of locality presence and absence [1].
Historically the tidewater gobi occurred in at least 135 locations [1]. When listed as endangered in 1994, only 48 were known to be occupied. By 2007, 106 were occupied.
In the 2007 Five-Year Review, the Fish and Wildlife Service recommended downlisting to "threatened" status, but stated that downlisting should be delayed until further genetic information on sub-populations was available [1]. In 2011, the Service issued a positive 90-day finding on a petition to downlist the species [2].
The range of the goby encompasses most of the 1,000-mile coast of California. There are six tidewater goby recovery units delineated in the 2005 Recovery Plan. From north to south, the units are: North Coast, Greater Bay, Central Coast, Conception, Los Angeles/Ventura, and South Coast. Recovery units are further subdivided into 26 sub-units, which are considered different from each other genetically.
North Coast: The North Coast recovery unit is divided into six sub-units, each containing one to six localities. At the time of listing there were 10 occupied localities in this unit. Subsequently, more localities were discovered to have tidewater gobies bringing the total to 22 overall. Of the 22, three are presumed to be extirpated, eight are considered intermittent, four regular, and seven are unknown.
Greater Bay: The Greater Bay recovery unit is one of the largest recovery units and is composed of 11 sub-units, each containing one to seven localities. At the time of listing there were nine occupied localities in this unit. Subsequently, more localities were discovered to have tidewater gobies, bringing the total to 34 overall. Of the 34 localities, 11 are presumed to be extirpated, 15 are considered intermittent, seven are regular, and one is unknown.
Central Coast: The Central Coast recovery unit is divided into three sub-units, each containing three to 10 localities per sub-unit. At the time of listing, there were nine occupied localities in this unit. Subsequently, more localities were discovered bringing the total to 21 overall. Of the 21 localities, five are presumed to be extirpated, 10 are considered intermittent, five are regular, and one is unknown.
Conception: The Conception recovery unit is one of the two largest and consists of three sub-units. At the time of listing, there were 15 occupied localities in this unit. Subsequently, more localities were discovered bringing the total to 36, most of which are located in the southernmost sub-unit. Of the 36 localities, two are presumed to be extirpated, 17 are considered intermittent, and 17 are regular.
Los Angeles/Ventura: The LA/Ventura recovery unit consists of a single sub-unit. At the time of listing, there were two occupied localities in this unit. Subsequently, more localities were discovered bringing the total to eight overall, all of which have been sampled for the presence of tidewater gobies since the time of listing. Of the eight localities, two are presumed to be extirpated, four are considered intermittent, and the other six are regular.
South Coast: The South Coast recovery unit is divided into two sub-units. At the time of listing, three localities were in this unit. Subsequently, more localities were discovered bringing the total to 14 overall. Of the 14 localities, six are presumed to be extirpated, seven are intermittent, and one is regular.
CITATIONS
[1] U.S. Fish and Wildlife Service. 2007. Tidewater Goby (Eucyclogobius newberryi) 5-Year Review: Summary and Evaluation. Ventura Fish and Wildlife Office. 50 pp.
[2] U.S. Fish and Wildlife Service. 2011. 90-Day Finding on a Petition to Delist or Reclassify from Endangered to Threatened Six California Species. 76 FR 03069.
Western snowy plover (Pacific DPS) (Charadrius nivosus nivosus (Pacific DPS))
| Status: Threatened | Critical habitat: 12/7/1999 | Listed: 3/5/1993 | Recovery plan: 8/13/2007 |
Range: CA(b), OR(b), WA(b) ---
SUMMARY
The snowy plover declined on the Pacific Coast due to habitat loss, disturbance of nest sites, and encroachment of European beach grass. It remains threatened by predation, disturbance and climate change. When listed as an endangered species in 1993, the U.S. population was estimated at about 1,500 adults. Protection efforts have allowed the population to increase to more than 3,600 adults in 2010.
RECOVERY TREND
The Pacific Coast western snowy plover (Charadrius alexandrinus nivosus) inhabits beaches, lagoons and salt-evaporation ponds along the coasts of California, Oregon and Washington in the United States, and in Mexico [1] with the largest number of breeding birds occurring south of San Francisco Bay to southern Baja [2]. Because of a decline in active nesting colonies and breeding and wintering populations the Pacific coast population of snowy plovers was listed as threatened in 1993 [3]. It is estimated that at the time the plover was listed, approximately 1,500 western snowy plovers nested in the United States [4]. The decline of Pacific coast snowy plovers has been attributed to loss of nesting habitat and habitat degradation caused by expanding beach-front development and recreation, human disturbance, encroachment of European beach grass on nesting grounds, and predation [1, 2].
Although the snowy plover still faces the same threats that it did prior to listing, protections have reduced the magnitude of these threats [5]. Since listing, the number of snowy plovers and nesting sites has increased and progress has been made toward bringing the species back to health [5]. Measures taken to benefit plovers since listing include building exclosures to help reduce nest predation, restoring habitat by removing European beachgrass, posting signs and symbolic fencing around breeding sites, distributing information to the public, and increased law enforcement [4]. In addition, 12,145 acres were designated as critical habitat for snowy plovers in 2005, and in 2011 the Service proposed increasing the total critical habitat to 28,261 acres [6, 8]. As of 2010, the total U.S. population was estimated at 3,656 adults, with 3,379 birds in California, 234 in Oregon, and 43 in Washington [9]. The California and Oregon populations have increased since 2005, but the Washington population has been declining since 2005 [10].
California: Statewide surveys conducted in the late 1970s estimated the snowy plover population at 1,566 adults and found that only 20 of 53 historic breeding sites were occupied [4]. Later, an additional 11 locations were identified as sites that had once supported, but subsequently lost, nesting plovers [4]. Plover numbers continued to decline and in 2000 only 976 breeding plovers were observed [4]. Since then, numbers increased to 1,680 adult plovers observed during 2005 survey season and further still to 3,379 birds in 2010 [7, 9].
Oregon: Historically, snowy plovers nested at 29 coastal locations in Oregon [4]. By the time the species was listed in 1993, 23 of these sites had been lost [4]. Since listing, snowy plovers have reoccupied four of these sites bringing the number of breeding sites in the state up to 10 [4]. Since 1994, the number of adult breeding snowy plovers has been slowly increasing [4], and the 2010 population was estimated at 232 to 236 adults, the highest estimate recorded since monitoring began in 1990 [9].
Washington: Plovers once nested at five coastal sites, but only two of these sites are currently active [10]. The mean 2010 Washington breeding adult population was 43 (95 percent confidence interval: 39-46). The Washington population declined by approximately six birds per year from 2005 to 2010 (p < 0.001) [10].
The recovery criteria are outlined in the 2007 recovery plan [11]. The Pacific coast population of the western snowy plover will be considered for delisting when the following criteria have been met: 1. An average of 3,000 breeding adults has been maintained for 10 years, distributed among six recovery units as follows: Washington and Oregon, 250
breeding adults; Del Norte to Mendocino counties, Calif., 150 breeding adults; San Francisco Bay, Calif., 500 breeding adults; Sonoma to Monterey counties, Calif., 400 breeding adults; San Luis Obispo to Ventura Ccounties, Calif., 1,200 breeding adults; and Los Angeles to San Diego counties, Calif., 500 breeding adults.
CITATIONS
[1] U.S. Fish and Wildlife Service. Species Account: Western Snowy Plover. Website <http://ecos.fws.gov/docs/life_histories/B07C.html> accessed May, 2006.
[2] U.S. Fish and Wildlife Service. 2006. Background and Q&A’s about the West Coast Population of Snowy Plovers Website <http://www.fws.gov/sacramento/ea/news_releases/2006%20News%20Releases/Plover_petition-4d_2006_QA.html> accessed May, 2006.
[3] U.S. Fish and Wildlife Service. 1993. Determination of Threatened Status for the Pacific Coast Population of the Western Snowy Plover. Federal Register 58 FR 12864-12874.
[4] U.S. Fish and Wildlife Service. 2006. 12-Month Finding on a Petition to Delist the Pacific Coast Population of the Western Snowy Plover. Federal Register 71 FR 20607-20624.
[5] U.S. Fish and Wildlife Service. 2006. Western Snowy Plover Nesting Success Improves Again in 2005. New Release, November 4th, 2005. Available at <http://news.fws.gov/NewsReleases/showNews.cfm?newsId=5D35B69D-65BF-03E7-207B4B69FD517A95>.
[6] U.S. Fish and Wildlife Service. 2005. Critical Habitat Designated for Pacific Coast Population of the Western Snowy Plover. News Release, September 26, 2005. Available at <http://news.fws.gov/NewsReleases/showNews.cfm?newsId=93B3C371-65BF-03E7-2BFCCD9F7349AD9D>.
[7] U.S. Fish and Wildife Service. 2006. Comparison of the 2005 and 2006 summer Snowy Plover surveys on the Pacific Coast. Arcata, CA. Available at: www.fws.gov/arcata/es/birds/reports/2006%20Pacific%20Coast%20breeding%20survey.v2%20update.pdf
[8] U.S. Fish and Wildlife Service. 2011. Revised Critical Habitat for the Pacific Coast Population of the Western Snowy Plover. 76 FR 16046.
[9] U.S. Fish and Wildlife Service. 2011. Western Snowy Plover Species Profile. http://www.fws.gov/arcata/es/birds/WSP/plover.html
[10] Pearson, S.F., C. Sundstrom, W. Ritchie, and K. Gunther. 2010. Washington State Snowy Plover Population Monitoring, Research, and Management: 2010 Nesting Season Research Progress Report. Washington Department of Fish and Wildlife, Wildlife Science Division, Olympia.
[11] U.S. Fish and Wildlife Service. 2007. Recovery Plan for the Pacific Coast Population of the Western Snowy Plover. 292 pp.
