Bighorn sheep (Peninsular Ranges DPS) (Ovis canadensis pop. 2)
| Status: Endangered | Critical habitat: 2/1/2001 | Listed: 3/18/1998 | Recovery plan: 10/25/2000 |
Range: CA(b) ---
SUMMARY
The Peninsular bighorn sheep declined to near extinction because of housing developments, agriculture, collisions with cars, predation by mountain lions and diseases contracted from domestic sheep. Sheep populations plummeted from 971 in 1971, to 276 in 1996, but since being listed as endangered in 1998, the number of bighorns has increased to 981 as of 2010.
RECOVERY TREND
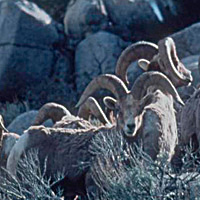
The Peninsular bighorn sheep is a distinct population of bighorn (Ovis canadensis) that is restricted to east-facing, lower elevation slopes (typically below 4,600 feet) of the Peninsular Ranges along the northwest edge of the Sonoran Desert in southern California. Though populations occur in Mexico, the species is only listed as endangered from the San Jacinto Mountains south to the U.S.-Mexico border. It has declined due to loss of habitat to agriculture and housing development, car collisions, predation by mountain lions, diseases contracted from domestic sheep, disturbance by humans and dogs, fire suppression, and spread of exotic plants such as tamarisk [1]. It was listed as an endangered species in 1998. Critical habitat was designated on 844,897 acres in 2001, but was reduced to 376,938 acres in 2009 [3].
The historic population size is unknown, but the species was considered "rare" in 1971 when it was estimated at 971 animals [1]. The highest recent population was 1,171 animals in 1974 and 1979. The population plummeted to 276 in 1996 but following listing, increased to 981 as of 2010 [4]. Approximately 100 peninsular bighorn are captive-bred and used to augment the wild population [2].
CITATIONS
[1] U.S. Fish and Wildlife Service. 2000. Recovery Plan for bighorn sheep in the Peninsular Ranges, California. United States Fish and Wildlife Service, Portland, OR. 251 pp.
[2] Bighorn Institute. 2005. Endangered Peninsular Bighorn Sheep, website (www.bighorninstitute.org/endangered.htm) accessed September 30, 2005.
[3] U.S. Fish and Wildlife Service. 2009. Designation of Critical Habitat for Peninsular Bighorn Sheep and Determination of a Distinct Population Segment of Desert Bighorn Sheep (Ovis canadensis nelsoni), Final Rule. 74 FR 17288.
[4] U.S. Fish and Wildlife Service. 2011. Peninsular bighorn sheep (Ovis canadensis nelsoni) 5 Year Review: Summary and Evaluation. Carlsbad, CA.
Black-footed ferret (Mustela nigripes)
| Status: Endangered | Critical habitat: none | Listed: 3/11/1967 | Recovery plan: 8/8/1988 |
Range: AZ(b), CO(b), MT(b), SD(b), UT(b), WY(b) --- KS(x), NE(x), NM(x), ND(x), OK(x), TX(x)
SUMMARY
The black-footed ferret was nearly driven extinct due to the elimination of prairie dog colonies by habitat destruction, shooting and plague. It was thought extinct until 1964, extirpated from the wild in 1974, thought extinct again in 1979, then rediscovered in 1981. All ferrets were captured in 1987. A reintroduction program increased wild ferrets from 0 in 1991 to about 1,410 in 2010.
RECOVERY TREND
The black-footed ferret (Mustela nigripes), which once occurred throughout the grasslands and basins of interior North America, from southern Canada to Texas, is entirely dependent upon prairie dog colonies [1]. It lives in prairie dog burrows and hunts prairie dogs for food. Its historical range is nearly identical to that of three prairie dog species-- the black-tailed prairie dog, Gunnison's prairie dog and white-tailed prairie dog.
Prairie dogs were formerly abundant and may have supported as many as 5.6 million black-footed ferrets in the late 1800s [2]. They declined precipitously due to conversion of grasslands to agriculture and development, killing for sport, and large-scale poisoning to eliminate reduction in livestock and agriculture industry profits. Prairie dogs are now absent from an estimated 90 to 95 percent of their historically occupied area.
Ferrets declined in parallel to prairie dogs [1]. Of the approximately 130 counties and provinces where ferrets were found since 1880, only 10 were known to have ferrets by the 1960s [1]. In 1971, six ferrets were caught and removed from a declining population in South Dakota in a first effort at captive breeding. The effort was unsuccessful and the last captive ferret died in 1979. Following this loss, the black-footed ferret was thought to be extinct throughout North America.
In 1981 a tiny, relic population was discovered in a prairie dog colony near Meeteetse, Wyoming [1]. The population declined, so to avert the ferret's extinction, all remaining animals were brought into captivity in 1987. These ferrets are the founders of all subsequent reintroductions.
As of 2008, ferrets had been reintroduced to 18 sites [2]. There were 838 wild ferrets and 422 wild adults which is 28 percent of the recovery plan's goal of 1,500 adult ferrets [2]. In early 2010, the Fish and Wildlife Service estimated that it had reached 47 percent of the goal, which would put the adult population at about 705 and the total population at about 1,410 [3].
CITATIONS
[1] U.S. Fish and Wildlife Service. 1988. Black-footed Ferret Recovery plan. Denver, Co. 154pp. http://ecos.fws.gov/docs/recovery_plans/1988/880808.pdf
[2] U.S. Fish and Wildlife Service. 2008. Black-footed ferret 5-Year review, summary and evaluation. Pierre, S.D. 38 pp. https://ecos.fws.gov/docs/five_year_review/doc2364.pdf
[3] U.S. Fish and Wildlife Service. 2012. Black-Footed ferret. Website http://www.fws.gov/mountain-prairie/species/mammals/blackfootedferret. Accessed May 10, 2012.
[4] Matchett, R. 2006. Personal communication with Randy Matchett, U.S. Fish and Wildlife Service Senior Biologist, Charles M. Russell National Wildlife Refuge, April 16, 2006.
Blue whale (Balaenoptera musculus)
| Status: Endangered | Critical habitat: none | Listed: 6/2/1970 | Recovery plan: 10/23/1998 |
Range: AK(s), CA(s), FL(o), HI(s), ME(o), MD(o), MA(o), NH(o), NY(o), NC(o), OR(m), RI(o), SC(o), WA(m) ---
SUMMARY
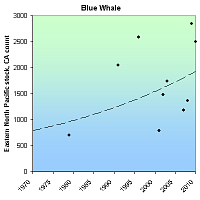
The blue whale population was reduced by as much as 99 percent due to whaling that occurred before the mid-1960s. The number of whales reported off the coast of California, the largest stock in U.S. waters, increased from 704 in 1980 to an estimated 2,497 in 2010.
RECOVERY TREND
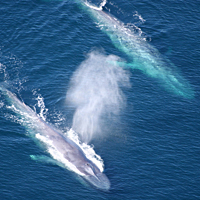
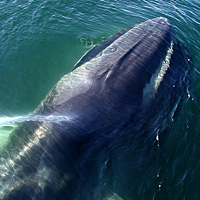
The blue whale (Balaenoptera musculus) is the largest animal ever known to have lived on Earth [1]. Blue whales are found in all oceans worldwide and are separated into populations from the North Atlantic, North Pacific and Southern Hemisphere [1]. Each population is composed of several stocks that typically migrate between higher-latitude summer feeding grounds and lower-latitude wintering areas. The largest numbers of blue whales in U.S. waters are within the eastern North Pacific stock. Other U.S. stocks occur in waters off the coast of Hawaii and the Northeast [1].
Pre-whaling blue whale populations had about 350,000 individuals [3]. In 1868, the invention of the exploding harpoon gun made the hunting of blue whales possible and in 1900, whalers began to focus on blue whales and continued until the mid 1960s [1, 3]. During this time, it is estimated that whalers killed up to 99 percent of blue whale populations [3]. Currently, there are about 5,000-10,000 blue whales in the Southern Hemisphere and about 3,000-4,000 in the Northern Hemisphere [3]. Current threats include collisions with vessels, entanglement in fishing gear, reduced zooplankton production due to habitat degradation, and disturbance from low-frequency noise [1]. The offshore driftnet gillnet fishery is the only fishery likely to take blue whales, but few mortalities or serious injuries have been observed [2].
EASTERN NORTH PACIFIC STOCK
The Eastern North Pacific Stock feeds in waters off the coast of California from June to November and then migrates south to Mexico (sometimes going as far south as Costa Rica) in winter/spring [2]. Recently, blue whales seen off the coast of Alaska were photo-matched to photos from the Southern California area, indicating that California animals now migrate as far north as Alaska [4]. This is probably a reestablishment of a traditional migratory route [4]. The number of whales reported off the coast of California increased from 704 in 1979/80 to 2497 in 2010 [2, 11]. It is not certain if the overall increasing trend indicates a growth in the size of the stock, or just increased use of California waters [2], but in general, the stock is thought to have increased [1]. Because this is the largest stock in U.S. waters, it dominates the trend of the species in U.S. waters.
WESTERN NORTH PACIFIC STOCK
Blue whales feeding along the Aleutian Islands are probably part of a central western North Pacific stock that is thought to migrate to offshore waters north of Hawaii in winter [5]. Sightings of blue whales in Hawaiian waters are infrequent, although acoustic recordings indicate that blue whales occur there. There are no estimates of population size for this stock [5]. No blue whales were sighted during aerial surveys of Hawaiian waters conducted from 1993 to 1998 or during shipboard surveys conducted in the summer/fall of 2002 [5]. In 2004, three blue whales were seen in the western Aleutians, the first U.S. sightings of blue whales from this western North Pacific population in several decades [6]
NORTH ATLANTIC STOCK
The blue whale is an occasional visitor along the Atlantic coast of the Northeast [7]. Sightings of blue whales off Cape Cod, Mass., in summer and fall may represent the southern limit of the feeding range of the western North Atlantic stock that feeds primarily off the Canadian coast [7]. Blue whales have been sighted as far south as Florida, however, and the actual southern limit of this stock’s range is unknown [7]. Because blue whales are not frequently seen in U.S. Atlantic waters, there are insufficient data to determine the stock's population trend [7]. In 1997, the total number of photo-identified individuals for eastern Canada and New England was 352 [1].
CITATIONS
[1] NMFS. 1998. Recovery plan for the blue whale (Balaenoptera musculus). Prepared by Reeves R.R., P.J. Clapham, R.L. Brownell, Jr., and G.K. Silber for the National Marine Fisheries Service, Silver Spring, MD. 42 pp.
[2] NOAA Fisheries. 2004. Stock Assessment Report. Blue Whale (Balaenoptera musculus): Eastern North Pacific Stock. Revised 3/15/05. National Oceanic and Atmospheric Administration, Washington, D.C.
[3] American Cetacean Society. 2005 American Cetacean Society Fact Sheet: Blue Whale (Balaenoptera musculus). Website http://www.acsonline.org/factpack/bluewhl.htm (accessed on 11/30/05).
[4] NOAA. Fisheries. 2004. NOAA Scientists Sight Blue Whales in Alaska. Press Release 7/27/2004.
[5] NOAA Fisheries. 2004. Stock Assessment Report. Blue Whale (Balaenoptera musculus): Western North Pacific Stock. Revised 3/15/05. National Oceanic and Atmospheric Administration, Washington, D.C.
[6] Rankin, Barlow and Stafford. (in press) Marine Mammal Science.
[7] NOAA Fisheries. 2002. Stock Assessment Report. Blue Whale (Balaenoptera musculus): Western North Atlantic Stock. Revised Jan. 2002. National Oceanic and Atmospheric Administration, Washington, D.C
[8] NOAA Fisheries. 2007. Stock Assessment Report. Blue Whale (Balaenoptera musculus): Eastern North Pacific Stock. National Oceanic and Atmospheric Administration, Washington, D.C.
[9] NOAA Fisheries. 2008. Stock Assessment Report. Blue Whale (Balaenoptera musculus): Eastern North Pacific Stock. National Oceanic and Atmospheric Administration, Washington, D.C.
[10] NOAA Fisheries. 2009. Stock Assessment Report. Blue Whale (Balaenoptera musculus): Eastern North Pacific Stock. National Oceanic and Atmospheric Administration, Washington, D.C.
[11] NOAA Fisheries. 2010. Stock Assessment Report. Blue Whale (Balaenoptera musculus): Eastern North Pacific Stock. National Oceanic and Atmospheric Administration, Washington, D.C.
Bowhead whale (Balaena mysticetus)
| Status: Endangered | Critical habitat: none | Listed: 6/2/1970 | Recovery plan: none |
Range: AK(s) ---
SUMMARY
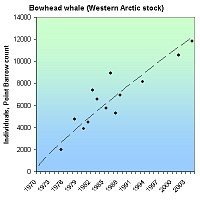
Bowhead whales in the Western Arctic were severely depleted by commercial whaling which reached a peak between 1898-1919. Whaling was banned in 1946. They are currently threatened by increased oil and gas drilling and global warming. Approximately 3,000 bowheads remained when commercial whaling ceased. Following Endangered Species Act listing in 1970, the Western Arctic population increased from 5,189 in 1978 to 11,836 in 2004. The population is likely larger today.
RECOVERY TREND
The bowhead whale (Balaena mysticetus) is found only in Arctic and sub-Arctic waters [1] and is the only baleen whale to spend its entire life near sea ice without migrating to temperate or tropical waters to calve [2].
For management purposes, five stocks of bowhead whales are recognized [3]. Four small stocks (made up of only a few tens to a few hundred individuals) occur in 1) the Sea of Okhotsk, 2) Davis Strait, 3) Hudson Bay, and 4) the offshore waters of Spitsbergen [3]. The fifth and largest stock, and the only one found within U.S. waters, is the Western Arctic stock, also know as the Bering-Chukchi-Beaufort stock or Bering Sea stock [3]. However, recent evidence suggests that the Davis Strait and Hudson Bay stocks (also known as Western Greenland and Eastern Canada stocks) form a single genetic group and may be comprised of over 1,000 whales [8].
All stocks were severely depleted during intense commercial whaling prior to the 20th century [3].
WESTERN ARCTIC STOCK
The majority of whales in the Western Arctic stock migrate annually from wintering areas in the northern Bering Sea, through the Chukchi Sea in the spring, to the Beaufort Sea where they spend much of the summer before returning again to the Bering Sea in the fall to overwinter [3].
This stock contains over 90 percent of remaining bowhead whales [4] and is making significant progress toward recovery [5].
In the Bering Sea, commercial bowhead whaling occurred primarily from 1898-1919 [3]. It is estimated that whalers killed 18,684 bowheads there, reducing the population from 10,400-23,000 to just 3,000 before whaling was banned in 1946 [1, 3]. They may have driven a distinct, non-migratory stock extinct [5].
Migrating whale counts off Point Barrow indicate the population grew at an annual rate of 3.4% between 1978 and 2001, increasing from 5,189 to 10,545 whales [7]. These counts exclude a much smaller, unknown number of non-migrating whales. The most recent estimate, using a different method, shows a 2004 population of 11,836 whales.
Native subsistence hunts have been permitted since 1977, with annual take ranging from 14-72 whales [3]. The recent harvest rate has been 40 whales per year with another ten or more struck and lost.
The bowhead whale is currently threatened by Western Arctic oil and gas development which brings increased ship traffic, water pollution, and noise pollution from offshore drilling rigs and seismic surveys [3]. Compared to the Gulf of Mexico, the Western Actic has not had a large amount of offshore oil and gas drilling. However, the Bush and Obama administrations issued regional policy and specific drillling decisions which if effected, will substantially increase oil and gas operations in the future.
Bowheads are also threatened by loss of sea ice and other ecosystem changes caused by global warming.
CITATIONS
[1] American Cetacean Society. 2004. Bowhead Whale (Balaena mysticetus) Fact Sheet. Available at <http://www.acsonline.org/factpack/bowhead.htm> Revised 3/2004.
[2] Caroll, G. 1994. Bowhead Whale. Alaska Department of Fish and Game. Website <http://www.adfg.state.ak.us/pubs/notebook/marine/bowhead.php> accessed March, 2006.
[3] NOAA Fisheries. 2003. Stock Assessment Report. Bowhead Whale (Balaena mysticetus): Western Arctic stock. National Oceanic and Atmospheric Administration, Washington, DC.
[4] National Audubon Society. 1992. Bowhead Whales in Beringia Natural History Notebook Series. Anchorage, AK. Available at <http://www.nps.gov/bela/html/bowhead.htm>.
[5] Shelden, K. E. W. and D. J. Rugh, 1995. The Bowhead Whale, Balaena mysticetus: Its Historic and Current Status. Marine Fisheries Review 57(3-4):1-20.
[7] Alaska Fisheries Science Center. 2010. Bowhead Whale (Balaena mysticetus): Western Arctic Stock. In Alaska Marine Mammal Stock Assessments, 2010. NOAA Technical Memorandum NMFS-AFSC-223. Available at http://www.nmfs.noaa.gov/pr/pdfs/sars/ak2010.pdf
[8] Alaska Fisheries Science Center. 2011. Bowhead Whale (Balaena mysticetus): Western Arctic Stock (July 2011 draft). In Alaska Marine Mammal Stock Assessments, 2011 (July 2011 draft). Available at http://www.nmfs.noaa.gov/pr/pdfs/sars/ak2011_draft.pdf
California bighorn sheep (Sierra Nevada DPS) (Ovis canadensis sierrae)
| Status: Endangered | Critical habitat: 8/5/2008 | Listed: 4/20/1999 | Recovery plan: 9/24/2007 |
Range: CA(b) ---
SUMMARY
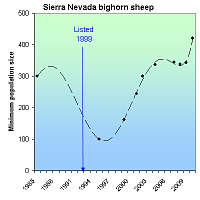
The Sierra Nevada big horn sheep declined due to hunting, disease, introduction of domestic sheep, habitat loss and disturbance. It's historic population of more than 1,000 sheep declined to 300 in 1985 and 100 in 1995 prior to its emergency listing as an endangered species in 1999. Since then its population increased to at least 420 in 2010.
RECOVERY TREND
The Sierra Nevada bighorn sheep (Ovis canadensis sierrae) formerly included 20 subpopulations on the eastern slope of California's Sierra Nevada, and at least one subpopulation on the western slope [1]. The historic population size is not well known, but has been estimated at 1,000 or more individuals [5]. It began declining in the mid-1800s due to hunting, disease and the introduction of domestic sheep. About half the subpopulations were gone by the early 1900s. The species continued dwindling to five populations in the 1950s and two in the 1970s [2].
The population was estimated at 250 in 1978 on Mount Williamson, Mount Baxter, and Sawmill Canyon, and 300 in 1985 (mostly In Mount Baxter and Sawmill Canyon) [1, 3, 4]. Thereafter it plunged to a historic low of 100 in 1995. After being listed as endangered in 1999 on an emergency basis, the bighorn's population increased to a minimum of about 350 in 2004, remained at this level through 2009, then increased to 420 in 2010 [5, 6, 7].
CITATIONS
[1] U.S. Fish and Wildlife Service. 2003. Draft Recovery Plan for the Sierra Nevada Bighorn Sheep. U.S. Fish and Wildlife Service, Portland, Oregon. xiii + 147 pp.
[2] U.S. Fish and Wildlife Service. 2000. Final rule to list the Sierra Nevada Distinct Population Segment of the California Bighorn Sheep as Endangered. U.S. Fish and Wildlife Service, January 3, 2000 (65 FR 20).
[3] Sierra Nevada Bighorn Sheep Foundation. 2000. Sierra Nevada Bighorn Population Status, Census Work 1995 On. www.sierrabighorn.org/endanger/population_status.htm
[4] Sierra Nevada Bighorn Sheep Foundation. 2002. Sierra Nevada Bighorn Sheep 2002 Update, Herds Continue to grow. www.sierrabighorn.org/endanger/2002%20update.htm
[5] U.S. Fish and Wildlife Service. 2007. Recovery Plan for Sierra Nevada Bighorn Sheep. Portland, OR. xiv + 199 pp.
[6] U.S. Fish and Wildlife Service. 2008. Sierra Nevada Bighorn Sheep Ovis canadensis californiana (=Ovis canadensis sierrae) 5-Year Review: Summary and Evaluation. Portland, OR. 41 pp.
[7] Stephenson, T. R., et al. 2012. 2010-2011 Annual Report of the Sierra Nevada Bighorn Sheep Recovery Program: A Decade in Review. California Department of Fish and Game.
Columbian white-tailed deer (Douglas County DPS) (Odocoileus virginianus leucurus (Douglas County DPS))
| Status: Delisted | Critical habitat: none | Listed: 3/11/1967 | Recovery plan: 6/14/1983 |
Range: OR(b) ---
SUMMARY
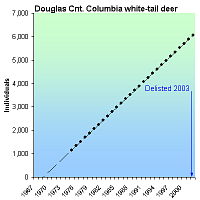
The Columbian white-tailed deer was reduced from tens of thousands of deer to two small, populations totaling 200-300 deer in central Oregon and at the mouth of the Columbia River, due to unrestricted hunting and the loss of riparian and woodland forests. It was listed as endangered in 1967. Due to habitat protection and prohibition on killing, the Douglas County population in central Oregon grew from an estimate 1,200 deer in 1975 to over 6,000 at the time of its delisting in 2003.
RECOVERY TREND
The Columbian white-tailed deer (Odocoileus virginianus leucuruswas) was once considered abundant in the Willamette, Columbia and Umpqua river valleys [1]. Populations of this subspecies once numbered in the tens of thousands, but by the early 1900s the clearing of riparian lands for agriculture and unrestricted hunting drastically reduced populations [1]. By 1940, only two small disjunct populations remained: a population of 200 to 300 in Douglas County, Ore. and a population of 500 to 700 animals along the lower Columbia River in Oregon and Washington [2].
These two populations were listed as separate distinct population segments under the Endangered Species Act: the Columbia River population, and the Douglas County population [2].
In the 1930s, the Douglas County Columbian white-tailed deer population was estimated at 200 to 300 individuals occupying a range of only about 31 square miles [2]. Following its listing as an endangered species in 1967, it grew from from an estimate 1,200 deer in 1975 to over 6,000 at the time of its delisting in 2003 [2]. During this period its range expanded northward and westward, covering approximately 309 square miles by 2003 [2].
CITATIONS
[1] Pacific Biodiversity Institute. 2001. Columbian white-tailed deer. Website <http://www.pacificbio.org/ESIN/Mammals/ColumbiaWhiteTailedDeer/columbiawhitetaileddeerpg.html> accessed May, 2006.
[2] U.S. Fish and Wildlife Service. 2003. Endangered and Threatened Wildlife and Plants; Final Rule to Remove the Columbian White-Tailed Deer From the Federal List of Endangered and Threatened Wildlife. 68 FR 43647 43659.
Delmarva Peninsula fox squirrel (Sciurus niger cinereus)
| Status: Endangered | Critical habitat: none | Listed: 3/11/1967 | Recovery plan: 6/8/1993 |
Range: DE(b), MD(b), PA(b), VA(b) --- NJ(x)
SUMMARY
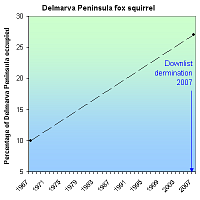
Logging and conversion of forests to farms and developments destroyed much of the Delmarva Peninsula fox squirrel's habitat. The squirrel remains threatened by ongoing habitat loss, car strikes and rising sea levels due to global climate change. At the time of listing in 1967, the squirrel occupied only 10 percent of the Delmarva Peninsula. As of 2007, its likely occupied range had expanded to 27 percent of the peninsula. In addition, 11 of 16 translocations have been successful.
RECOVERY TREND
The Delmarva Peninsula fox squirrel (Sciurus niger cinereusis) is a large, heavy-bodied tree squirrel with an unusually full, fluffy tail [1]. Historically, it occurred in southeastern Pennsylvania, Delaware, south-central New Jersey, eastern Maryland, and the Virginia portion of the Delmarva Peninsula [2]. Because the species' habitat requirements are somewhat specific, requiring mature park-like forests, it is likely that populations were scattered and discontinuous. As forests were logged or converted to farms, they became unsuitable for the fox squirrel. As forests regrew, they were cut again before the mature forest required by fox squirrels could develop. By the turn of the century, the Delmarva fox squirrel had disappeared from New Jersey, Pennsylvania and Virginia, and by 1936, it disappeared from Delaware as well.
At the time of its listing as endangered in 1967, the Delmarva fox squirrel occurred in about 10 percent of its former range in four eastern Maryland counties (Kent, Queen Anne’s, Talbot and Dorchester) [1]. As of 2007, the known range of the squirrel covered 27 percent of the Delmarva Peninsula [3]. This represents the total acreage where the squirrels are likely to occur, delineated as the area within three miles of all occupied habitat. The known area of occupied habitat is now more than 25,000 acres larger than it was in 1998, and some of the newly discovered populations significantly extend the periphery of the range known at the time of listing. Using a total area of occupied habitat of 128,434 acres and density estimates, it is estimated that the total population size is now 20,000 to 38,000 squirrels.
Starting in 1968, efforts were made to translocate fox squirrels into unoccupied habitat. As of 2007, 11 of 16 translocations were considered to be successful based on recovery plan criteria [3]. After approximately 25 years, almost 70 percent of the original release sites have persisting populations of Delmarva fox squirrels, with expansion indicated at the majority of sites. Of the unsuccessful translocation efforts, three were thought to have failed by 1993 (Nassawango, Fairhill and Chester). A fourth (Brownsville, Va.) began with a substantial number of animals, but although a few persisted at this site for an extended period, there was no evidence of reproduction. The most recent loss was the population at Assawoman, which was started with 13 animals and monitored as a benchmark site. Despite comparatively low numbers, reproduction was occurring and the
population persisted for about 15 years; however, Assawoman was not supplemented with additional animals, and this reintroduction is now considered unsuccessful
according to the recovery plan criteria. The population on Eastern Neck National Wildlife Refuge was not counted as one of the 16 translocations; however, it started from an historic translocation conducted in the 1920s by the hunt club that owned the property at the time. The population thrived on this relatively small island for many years and was a source of animals used to establish and supplement the translocated population at Chincoteague National Wildlife Refuge. Recent trapping evidence and observations by refuge staff indicate that this population has diminished to a few individuals at most, and it remains to be seen whether this population will blink out or bounce back [3].
The 1993 recovery plan specified a series of benchmark sites where squirrels were to be monitored for a minimum of seven years, using winter nest box checks and some trapping, in order to better understand the subspecies’ population dynamics. The seven sites included Blackwater, Chincoteague, and Prime Hook national wildlife refuges; Hayes Farm; Lecompte and Wye Island wildlife management areas, , and Assawoman Wildlife Area. Only four of the sites, Blackwater, Hayes Farm, Lecompte, and Wye Island, are part of the remnant distribution of this species; the others are translocation sites. Monitoring results showed the squirrels to be present and breeding at all benchmark locations during the seven-year study period; however, since the conclusion of the benchmark evaluation, the Assawoman translocation has been deemed a failure [3]. Despite this, the 2007 Five-Year Review recommended downlisting [3].
Current threats to the Delmarva fox squirrel include development, timber harvest, short-rotation pine forestry, forest conversion to agriculture, and rising sea levels due to global climate change [1,3]. Because much of the squirrel’s occupied habitat is on privately owned lands, the success of conservation efforts will be largely dependent on management practices on these lands. Small populations are also very susceptible to extirpation.
In the 2007 Five-Year Review, the Service recommended downlisting the squirrel from “endangered” to “threatened” [3]. However, due to ongoing threats to the species and lack of reliable quantitative long-term population data, it would be premature to downlist the squirrel.
CITATIONS
[1] U.S. Fish and Wildlife Service. 1993. Delmarva Fox Squirrel (Sciurus niger cinereus) Recovery Plan, Second Revision. Hadley, Massachusetts. 104 pp.
[2] U.S. Fish and Wildlife Service. 1984: Proposed Determination of Experimental Population Status for Introduced Population of Delmarva Fox Squirrel; Federal Register (49:13556-13558).
[3] U.S. Fish and Wildlife Service. 2007. Delmarva Peninsula Fox Squirrel (Sciurus niger cinereus) 5-Year Review: Summary and Evaluation. Chesapeake Bay Field Office, Annapolis, Maryland. 56 pp.
Fin whale (Balaenoptera physalus)
| Status: Endangered | Critical habitat: none | Listed: 6/2/1970 | Recovery plan: 7/30/2010 |
Range: AL(o), AK(s), CA(s), CT(s), DE(s), FL(s), GA(s), HI(s), LA(o), ME(s), MD(s), MA(s), MS(o), NH(s), NY(s), NJ(s), NC(s), OR(s), PA(s), RI(s), SC(s), TX(o), VA(s), WA(s) ---
SUMMARY
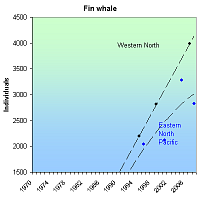
Fin whales were hunted in all the world's oceans for the first three-quarters of the 20th century, causing population decline. Ongoing threats include illegal and legal whaling, vessel collisions, fishing gear entanglement, reduced prey and noise. Total population size is unknown, but both the North Atlantic and North Pacific populations increased between 1995 and 2009.
RECOVERY TREND
Fin whale (Balaenoptera physalus) populations in the North Atlantic, North Pacific and southern oceans mix rarely, if at all. For management purposes, the North Pacific is divided into three stocks: 1) the California/Oregon/Washington stock, 2) the Hawaii stock and 3) the Alaska stock [2]. A western North Atlantic stock inhabits U.S. waters along northeastern coasts [3]. Most groups are thought to migrate seasonally, in some cases over large distances [1]. They feed at high latitudes in summer and move to low latitudes in winter. Some groups move over shorter distances and may be resident to areas with a year-round supply of adequate prey.
Fin whales were hunted, often intensively, in all the world's oceans for the first three-quarters of the 20th century [1]. From 1947 to 1987, approximately 46,000 fin whales were taken from the North Pacific [2]. Commercial whaling did not end until 1976 in the North Pacific and 1987 in the North Atlantic. The current status of fin whale populations relative to pre-whaling levels is uncertain.
In the North Pacific, pre-whaling populations were estimated to be between 42,000 and 45,000 [2]. By 1973, the North Pacific population is thought to have been reduced to 13,620-18,680 — less than 38 percent of historic carrying capacity [2].
California/Oregon/Washington Stock
The California/Oregon/Washington stock of the North Pacific is thought to be increasing [5]. Fin whale acoustic signals are detected year-round off Northern California, Oregon and Washington, with a concentration of vocal activity between September and February [2]. Fin whales increased in abundance along the California coast between 1979 and 1996, and based on ship surveys in 2001, they continued to increase. Populations appeared to be increasing monotonically from 1991 to 2001 [5]. In 2001, 3,279 (CV= 0.31) were estimated in California, Oregon and Washington coastal waters [2]. The 2008 population was estimated at 2,825 whales [9].
Alaskan Stock
Since 1999, information on abundance of fin whales in Alaskan waters has improved and although the full range has not yet been surveyed, a rough estimate of the size of the population west of the Kenai Peninsula is 5,703 [6]. Surveys conducted in 1999 and 2000 in the central-eastern Bering Sea and southeastern Bering Sea provided provisional estimates of 3,368 (CV = 0.29) and 683 (CV = 0.32), respectively [6]. One aggregation of fin whales spotted in 1999 involved more than 100 animals [6]. Because historical abundance information is lacking, population trends are difficult to determine [6].
Hawaiian Stock
Fin whales are rare in Hawaiian waters and the stock is thought to be quite small [7]. Over the course of 12 aerial surveys conducted within about 25 nautical miles of the main Hawaiian Islands in 1993-98, only one fin whale was sighted [7]. More recent acoustic data suggest that fin whales migrate into Hawaiian waters mainly in fall and winter [7]. In 2002, a ship survey of the entire Hawaiian Islands resulted in an abundance estimate of 174 (CV=0.72) fin whales [7].
Western North Atlantic Population
Western North Atlantic fin whales off the eastern U.S. coast north to Nova Scotia and the southeastern coast of Newfoundland are considered a single stock [3]. New England waters represent a major feeding ground, and calving is thought to take place along mid-Atlantic U.S. latitudes from October to January. The locations used for calving, mating and wintering for most of the population remains unknown. It is likely that fin whales occurring in the U.S. Atlantic undergo migrations into Canadian waters, open-ocean areas, and perhaps even subtropical or tropical regions. An abundance of 2,200 (CV=0.24) fin whales was estimated from a 1995 line-transect sighting survey that covered waters from Virginia to the mouth of the Gulf of St. Lawrence. A 1999 estimate of 2,814 (CV=0.21) fin whales, currently considered the best estimate for the western North Atlantic stock, was derived from a line-transect sighting covering waters from Georges Bank to the mouth of the Gulf of St. Lawrence [3]. The best estimate of population for this stock in 2007 is 3,985 whales [8]. Although there is little data on population trends, the minimum population estimate reported in NOAA Fisheries Stock Assessment Reports has steadily increased since 1992.
The main direct threat to fin whales today is the possibility of illegal whaling or a resumption of legal whaling [1]. In 2006, Japan announced that it would expand hunts to include fin whales [4]. It expected to harvest 10 fin whales from Antarctic waters [4]. Collisions with vessels, entanglement in fishing gear, reduced prey abundance due to overfishing and habitat degradation, as well as disturbance from low frequency noise, are also potential threats [1]. The offshore drift gillnet fishery is the main fishery likely to take fin whales [2].
CITATIONS
[1] National Marine Fisheries Service. 1998. Draft Recovery Plan for the Fin Whale (Balaenoptera physalus) and Sei Whale (Balaenoptera Borealis). Silver Spring, MD.
[2] NOAA Fisheries. 2005. Stock Assessment Report. North Atlantic Right Whale (Eubalaena glacialis): Western Stock revised Dec., 2004. National Oceanic and Atmospheric Administration, Washington, D.C.
[3] NOAA Fisheries. 2004. Stock Assessment Report. Fin Whale (Balaenoptera physalus): Western North Atlantic stock. Revised Dec. 2004. National Oceanic and Atmospheric Administration, Washington, D.C.
[4] Hans Greimel, Associated Press. 2005. Japan To Double Usual Whale Kill in New Antarctic Hunt, Expanded To Include Fin Whales. Nov. 9, 2005.
[5] Barlow, J. 2003. Preliminary Estimates of the Abundance of Cetaceans along the U.S. West Coast: 1991-2001 Southwest Fisheries Science Center Administrative Report LJ-03-03. Available at <http://swfsc.nmfs.noaa.gov/prd/PROGRAMS/CMMP/default.htm>.
[6] NOAA Fisheries. 2004. Stock Assessment Report. Fin Whale (Balaenoptera physalus): Northeast Pacific stock. Revised 10/21/2004.
[7] NOAA Fisheries. 2005. Draft Stock Assessment Report. Fin Whale (Balaenoptera physalus): Hawaiian stock. Revised 3/15/2005.
[8] NOAA Fisheries. 2010. Stock Assessment Report. Fin Whale (Balaenoptera physalus): Western North Atlantic Stock. Revised 11/2010.
[9] NOAA Fisheries. 2011. 2010 Stock Assessment Report. Fin Whale (Balaenoptera physalus): California/Oregon/Washington stock. Revised 1/15/2011.
Florida manatee (Trichechus manatus latirostris)
| Status: Endangered | Critical habitat: 9/24/1976 | Listed: 3/11/1967 | Recovery plan: 10/3/2001 |
Range: AL(o), CT(o), DE(o), FL(b), GA(b), LA(o), MD(o), MS(o), NY(o), NJ(o), NC(o), RI(o), SC(o), TX(o), VA(o) ---
SUMMARY
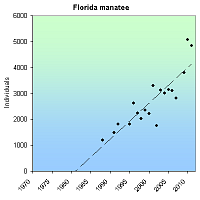
The Florida manatee is imperiled by habitat loss, coastal development, and motor boat collisions. It was listed as endangered in 1967, but range-wide systematic surveys were not instituted until 1991. The manatee increased 227% between 1991 and 2011 (1,478 to 4,834 manatees). Local surveys indicate the manatee has been increasing since the 1970s.
RECOVERY TREND
The Florida manatee (Trichechus manatuslatirotris latirostris) lives in freshwater, brackish and marine environments and inhabits shallow coastal waters, estuaries, bays, rivers and lakes [1]. Florida manatees occur in waters of the southeastern United States, primarily in Florida and southeastern Georgia, but individuals can range as far north as Rhode Island and probably as far west as Texas [2]. During winter, cold water temperatures keep the population concentrated at warm water sites in peninsular Florida [2].
Collisions with boats represent the greatest current threat to Florida manatees but water-control structures also account for significant mortality. Habitat loss caused by residential and commercial development also remains a problem and the loss of warm water refuges could pose a significant threat [2].
Historical data for Florida manatee numbers are poor [2]. Early aerial survey studies conducted in the late 1980s concluded that there were at least 1,200 animals [4]. Beginning in 1991, the state initiated synoptic aerial surveys to count manatees in potential winter habitat during periods of extreme cold weather. Aerial survey results are highly variable however, and results depend on weather conditions [2]. The number of manatees counted increased from 1,478 in 1991 to 4,834 in 2007 [6]. Warm water refuge counts, which are more accurate, also show an increase since the 1970s [2]. An analysis of trends at winter aggregation sites suggests a mean annual increase of 7 percent to-12 percent occurred at sites on the East Coast from 1978 to 1992 [3]. More detailed demographic data is needed, and more widespread accurate surveys must be conducted before population trends can be determined with certainty.
Over the past 25 years, there has been an increase in Florida manatee deaths. It is unclear whether this represents a proportional increase relative to overall population size [2]. This needs further investigation because Florida manatee recovery likely depends on controlling human-caused mortality of adult manatees [2]. "Red tides" caused by the dinoflagellate (Gymnodinium breve) have also resulted in three incidents (1982, 1991 and 1996) of high mortality [2]. Observed declines in the percentage and number of calves seen at power plant aggregation sites is also cause for concern [4].
CITATIONS
[1] Lefebvre, L. W., et al. 1989. Distribution, status, and biogeography of the West Indian manatee. Pages 567-610 in C. A. Woods (editor). Biogeography of the West Indies. Sandhill Crane Press, Gainesville, Florida
[2] U.S. Fish and Wildlife Service. 2001. Florida Manatee Recovery Plan, (Trichechus manatus latirostris), Third Revision. U.S. Fish and Wildlife Service. Atlanta, Georgia.
[3] U.S. Fish and Wildlife Service. West Indian Manatee (Trichechus manatus latirotris) Florida Stock Assessment. U.S. Fish and Wildlife Service Jacksonville Florida. Revised 1995
[4] Reynolds, J.E., III and J.R. Wilcox. 1994. Observations of Florida manatees (Trichechus manatus latirostris ) around selected power plants in winter. Marine Mammal Science 10(2): 143-177
[5] Associated Press. 2007. Report: U.S. may take manatees off endangered list. April 9, 2007.
[6] Florida Fish & Wildlife Conservation Commission. 2012. Synoptic aerial surveys (1991-2011). http://myfwc.com/research/manatee/projects/population-monitoring/synoptic-surveys/.
Florida panther (Puma concolor coryi)
| Status: Endangered | Critical habitat: none | Listed: 3/11/1967 | Recovery plan: 11/1/2008 |
Range: FL(b) --- AL(x), AR(x), GA(x), LA(x), MS(x), SC(x), TN(x)
SUMMARY
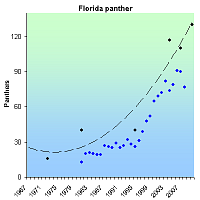
The Florida panther was reduced to near extinction by habitat loss, hunting, persecution, and vehicle collisions. Vehicle collisions, habitat loss and fragmentation, lack of sufficient wildland areas, and in-breeding depression remain current threats. Its population size when listed as endangered in 1967 is unknown, but may have been a little larger than the 30-50 animals recorded throughout the 1980s. The population began to grow after a genetic intervention in 1990s, reaching 130 panthers in 2010.
RECOVERY TREND
The Florida panther (Felis concolor coryi) formerly ranged from eastern Texas and western Louisiana into the lower Mississippi River Valley and eastward through Arkansas, Louisiana, Mississippi, Alabama, Florida, Georgia and parts of Tennessee and South Carolina [1].
Hunting and habitat loss reduced the subspecies to a single population of 30 to 50 adults in south Florida by the late 1980s [2]. This population generally occurs within the Big Cypress Swamp physiographic region and is centered in Collier and Hendry counties [1].
In 1981, two panthers were captured and radio-collared, initiating an extensive monitoring program. More than 116 panthers have been collared since the program’s inception [5]. By 1990, all extensive panther habitats had been explored and few panthers remained uncollared [5].
Between 1981 and 1990, the panther population was static at 30 to 50 adults [5] and showing signs of inbreeding depression expressed through increased genetic defects in the heart and sperm [4]. To increase genetic diversity, eight reproductive females from a closely related subspecies were translocated from Texas in 1995. The population increased 200 percent between the 1995 translocation population and 2003 when it reached 87 individuals [3, 4]. It has continued to grow since then, reaching 97 in 2006 [6], 118 in 2007 [8], and 130 in 2010 [7].
CITATIONS
[1] U.S. Fish and wildlife Service. 1993. Florida Panther (Felis Concolor Coryi) Species Account. Website < http://www.fws.gov/endangered/i/a/saa05.html> accessed May, 2006.
[2] Lotz, M., D. Land, M. Cunningham and B. Ferree. 2005. Florida Fish and Wildlife Conservation Commission Florida Panther Annual Report 2—4-2005. Available at <http://www.panther.state.fl.us/news/pdf/FWC2004-2005PantherAnnualReport.pdf>.
[3] Gross, L.J. and Comiskey. 2002. ATLSS PanTrack Telemtry Visualization Tool. U.S. Geological Survey Greater Everglades Science Program 2002 Biennial Report. Available at <http://sofia.usgs.gov/projects/atlss/panthers/telvistool_03geerab.html>.
[4] Pimm, S.L., L. Dollar, and O.L. Bass Jr. 2006. The genetic rescue of the Florida panther. Animal Conservation 9(2):115-122.
[5] McBride, R.T. 2001. Current panther distribution, population trends, and habitat use: report of field work: fall 2000 – winter 2001. Report to Florida Panther SubTeam of MERIT, U.S. Fish and Wildlife Service, South Florida Ecosystem Office, Vero Beach, Florida. www.panther.state.fl.us/news/pdf/rtm2001.pdf.
[6] U.S. Fish and Wildlife Service. 2007. Draft 5-Year Review Summary and Evaluation for the Florida Panther (Puma concolor coryi). Vero Beach, FL.
[7] Florida Fish and Wildlife Commission. 2010 . Statement on Estimating Panther Population Size. Available online at http://myfwc.com/news/resources/fact-sheets/panther-population/. Accessed September 19, 2011.
[8] Florida Fish and Wildlife Commission. 2009. Annual Report on the Research and Management of Florida Panthers: 2008-2009. Available online at http://www.floridapanther.org/images/FWC_Panther_AR_2008_2009.pdf. Accessed September 19, 2011.
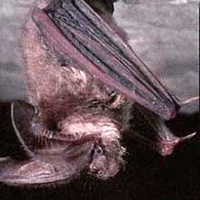
| Status: Endangered | Critical habitat: none | Listed: 4/28/1976 | Recovery plan: 7/1/1982 |
Range: AL(b), AR(b), FL(o), GA(o), IL(o), IN(o), KS(o), KY(b), MS(o), MO(b), NC(o), OK(o), TN(b), VA(o), WV(s) ---
SUMMARY
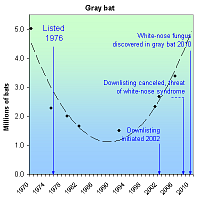
Gray bats declined due to mining, cave disturbance, vandalism, persecution, flooding, deforestation and possibly pesticides. In 2010, they were found with white-nose syndrome, but it is not known if the fungus is lethal to them or not. There were likely at least 5 million gray bats in 1970. At listing in 1976, the gray bat was declining, to a low of 1.5 million bats in 1992. Numbers reached 3.4 million in 2006, the most recent rangewide estimate.
RECOVERY TREND
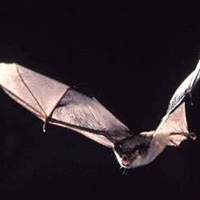
The gray bat (Myotis grisescens) is one the few North American bats to inhabit caves year-round, and may be the most cave-dependent mammal in the United States [5]. The specificity of these bats' needs, the rarity of caves that can satisfy them, and a growing human population that increasingly seeks out those very same caves thrust the gray bat into a century-long extinction trajectory from which it only recently escaped.
The discovery of white-nose syndrome in gray bats in 2010, however, threatens to reverse the dramatic population gains of the past two decades.
NATURAL HISTORY
Gray bats require exceptionally cold caves during winter hibernation [1]. The temperature must be between 42 degrees and 52 degrees. One or more vertical shafts must descend below the level of the entrance so that as cold air flows in, it becomes trapped, keeping the cave a steady temperature. Hibernacula often have multiple entrances to facilitate air flow.
As fewer than 5 percent of caves in the bat's range have these properties, large numbers of wintering bats crowd into a very small number of caves, some of them traveling hundreds of miles from their summer roosts to find them [1]. Since at least the 1960s, 95 percent of all gray bats winter in just nine caves. Historically, large hibernacula consisted of more than a million bats; in recent years, they support hundreds of thousands.
Females enter hibernation immediately after copulating (usually September or October) but do not become pregnant until emerging from hibernation in the spring. Males, which are generally more plastic in their roosting needs, remain active until entering hibernation in November.
In the spring, pregnant females disperse to very specific maternity caves where they simultaneously give birth to and raise one pup each. (Males and yearling females disperse to smaller, nearby caves.) Pup survival is closely related to the temperature of the maternity site within the maternity cave. The warmer the site, the better: If it is not between 57 degrees and 77 degrees, pup mortality is elevated. Gray bats help maintain the proper temperature by seeking out caves with domed, heat-trapping ceilings and heating them with their own bodies. If the species is healthy enough to have tens of thousands or hundreds of thousands of bats in a single maternity colony, their bodies will produce a substantial amount of heat; and if the cave is structured to retain that heat, the maternity site will remain a steady, warm temperature.
Gray bats forage over rivers, streams, lakes and reservoirs, primarily capturing aquatic insects such as mayflies, caddisflies and stoneflies, but also eating beetles and moths when they cross paths. Most summer caves are within 2.5 miles of a river or lake, further limiting the bats' availability, though some bats travel as far as 22 miles to forage if needed.
THREATS
The gray bat is something of wilderness species, not tolerating human disturbance very well [1]. If humans disturb a maternity roost, it can cause mass mortality of pups, which fall to the cave floor as the startled females withdraw or take flight. Both maternity roosts and hibernacula may be abandoned in response to disturbance.
Caves may be rendered unusable or less able to support gray bat needs if protective vegetation around the entrance is removed, airflow is disturbed by barriers, ingress and egress routes are altered, or the cave's structure or temperature is altered.
In addition to these common, often catastrophic — but not necessarily malicious — impacts, humans have killed large numbers of gray bats for sport, vandalism, or in the mistaken belief that bats are harmful to humans and their crops and pets.
The gray bat's evolved foraging, maternity and roosting strategies intersect with the region's small number of suitable caves to cause a very large portion of the species to inhabit a very small number of roosts. If those roosts are disturbed, even by relatively minor actions, significant portions of the population can be quickly lost. Thus one of the first monographs on the gray bat's decline declared that the "concentration of such a large proportion of the known population into so few caves constitutes the real threat to their survival" [10].
As the human population within the gray bat's range has grown, it has increasingly come into contact with formerly remote bat caves, causing gray bats to withdraw to more remove caves. Today, however, there are few caves left to withdraw to, so it is imperative that all occupied and important caves be protected from disturbance.
If gray bats decline to very low numbers, there will not be enough bats to maintain high maternity roost temperature, which, in a positive feedback loop, will increase pup mortality, further suppressing the population.
In 2010, white-nose syndrome was found in a gray bat hibernaculum in Shannon County, Mo. [14]. This is an enormous threat because it could spread very quickly to the great majority of the species. The bats, however, were not obviously distressed and it is not yet known if white-nose is lethal to them.
RANGE
Gray bats are primarily found in Alabama, Arkansas, Kentucky, Missouri and Tennessee, with smaller populations found in adjacent states, including a growing population in Indiana [1]. Ninety-five percent of bats hibernate in 17 caves in Tennessee (5), Missouri (4), Arkansas (5), Kentucky (3) and Alabama (1).
POPULATION TRENDS
The historic gray bat population size is unknown. Based on reported regional declines of 70 percent to 76 percent from maximum historic levels by 1976-1980 [4, 8], and an estimated range-wide population size of about 2 million in 1979 [8], we estimate the historic population to have been at least 9.5 million bats. It may have been much larger.
Though the scale has not been quantified, the gray bat's decline is believed to have begun in the 19th century with the advent of commercial mining of saltpeter, onyx and other cave minerals [5]. By the beginning of the 1960s, its status was of enough concern for scientists to warn that gray bats were especially vulnerable to human disturbance [7]. By the end of the decade, scientists were predicting the animal's extinction: "in the last few years human disturbance has threatened the very existence of the species…M. grisescens is destined to continue a rapid decline in numbers and probably faces extinction" [6].
The extinction trajectory continued during the 1970s. Using a "conservative" method he suggested would produce "a gross underestimate of true population losses," Merlin Tuttle documented a 54 percent decline of the 22 "healthiest" maternity caves in Alabama and Tennessee between 1970 and 1976 [8]. As the caves had declined 47 percent before his study started, the total decline from historic levels was 76 percent. A similar level of decline (70 percent from historical levels) was documented in nine major maternity roosts in Missouri by 1980 [4].
Only seven of the 22 caves studied by Tuttle were at their maximum historic level in 1970. This was reduced to four by 1976. The largest maternity colony — which was also the species' largest remaining maternity colony — numbered 111,400 bats in 1970. By 1976, it had declined by 95 percent to 6,000 bats.
Where others viewed the gray bat as a near lost cause, Tuttle found hope in the upswell of conservation actions since the bats listing as an endangered species in 1976:
"Since the gray bat was listed as endangered, encouraging progress has been made. The U. S. Fish and Wildlife Service is purchasing the major gray bat hibernating cave reported by Hall and Wilson (1966) in Kentucky as well as the most important known summer cave (no. 11 in this paper), and is considering other important acquisitions. It also has fenced and posted cave 15 of this study on the Wheeler National Wildlife Refuge…Following only 2 years of strict protection from human disturbance, this colony has now returned to maternity status and has increased to more than 19,000 bats….Although recent decline of gray bats has been precipitous there is no reason to believe that this trend cannot be reversed if adequate measures are taken to prevent human disturbance and vandalism." [8].
The gray bat continued to decline, however, leading the federal gray bat recovery team to warn in 1984 that if current trends continued, the species would be reduced to 100,000 individuals by 2000, triggering an irreversible extinction spiral because maternity roosts would be too small to successfully raise young [5].
The declines continued through 1992, when the gray bats reached a low point of 1.5 million individuals [13]. Thereafter the population rapidly increased to 3.4 million in 2006 [11, 12, 1]
DOWNLISTING CONSIDERATION
The U.S. Fish and Wildlife Service announced in 2002 that it intended to downlist the gray bat from endangered to threatened status [15]. Downlisting was widely supported by scientists due to the large upswing in bat numbers, the many protections that had been instituted to purchase, protect and manage many important caves, a commitment to continued monitoring, and the sense that these efforts have become sufficiently institutionalized within federal and state agencies to continue indefinitely.
While the Fish and Wildlife Service was examining the bat's population and management status in consideration of downlisting, white-nose syndrome appeared in the New York and spread rapidly north, south and east, killing some 7 million bats by 2011. In its 2009 “Five-Year Review,” the agency responded by putting the downlisting process on hold:
"Despite the achievements in recovery for this species, the potential threat of white-nose syndrome to populations of Myotis grisescens is of such a magnitude that any possible recommended changes in the future on the classification of this species should be withheld until more can be learned about WNS and its possible adverse impact on gray bat. If WNS spreads to populations of gray bats and results in mortality rates reported elsewhere in the northeastern U.S., the vulnerability of the species to extinction would be high..."
The following year, white-nose would be found in a gray bat hibernaculum and on five of the bats themselves [14]. While the potential for catastrophe is great — likely much greater for the gray bat than any other species — it is not yet known if white-nose is lethal or significantly harmful to it. If the fungus is lethal at levels it has been to some other bats, it could quickly drive the gray bat extinct.
CITATIONS
[1] U.S. Fish and Wildlife Service. 2009. Five Year Review of the Gray Bat (Myotis grisescens). Columbia, MO. http://ecos.fws.gov/docs/five_year_review/doc2625.pdf
[2] Ellison, L.E., T. J. O’Shea, M.A. Bogan, A.L. Everette and D.M. Schneider. 2003. Existing data on colonies of bats in the United States: Summary and analysis of the U.S. Geological Survey’s bat population database. Pages 127-237 in T.J. O’Shea and M.A. Bogan, eds.: Monitoring trends in bat populations of the United States and territories: problems and prospects. U.S. Geological Survey, Biological Resources Division, Information and Technology Report, USGS/BRD/ITR-2003-0003. 274 pp.
[3] Sasse, D.B., R.L. Clawson, M.J. Harvey, and S.L. Hensley. 2007. Status of populations of the endangered gray bat in the western portion of its range. Southeast. Naturalist 6(1):165-172.
[4] Elliott, W.R. 2008. Gray and Indiana bat population trends in Missouri. Pages 46-61 in Proceedings of the 18th National Cave & Karst Management Symposium, W.R. Elliott, ed; Oct. 8-12, 2007. National Cave and Karst Management Symposium Steering Committee. 320 pp. www.utexas.edu/tmm/sponsored_sites/biospeleology/pdf/2008%20elliott%20bats.pdf
[5] U.S. Fish and Wildlife Service. 1982. Gray bat recovery plan. Minneapolis, MN. http://ecos.fws.gov/docs/recovery_plan/820701.pdf
[6] Barbour, R.W., and W.H. Davis. 1969. Bats of America. University of Kentucky Press, Lexington, 286 pp.
[7] Manville, R.H. 1962. A plea for bat conservation. Journal of Mammalogy. 43:571.
[8] Tuttle, M. 1979. Status, causes of decline, and management of endangered gray bats. Journal of Wildlife Management 43:1-17.
[9] Harvey, M.J. 1992. Bats of the eastern United States. Arkansas Game and Fish Commission, Little Rock.
[10] Mohr, C.E. 1972. The status of threatened species of cave-dwelling bats. Bull. Natl. Spe1eo1. Soc. 34:33-47.
[11] Martin, C.O. 2007. Assessment of the population status of the gray bat (Myotis grisescens). Status review, DoD initiatives, and results of a multi-agency effort to survey wintering populations at major hibernacula, 2005-2007. Environmental Laboratory, U.S. Army Corps of Engineers, Engineer Research and Development Center Final Report ERDC/EL TR-07-22. Vicksburg, Mississippi. 97 pp. http://www.dtic.mil/cgi-bin/GetTRDoc?AD=ADA473199
[12] Harvey, M.J., and R.R. Currie. 2007. Gray bat (Myotis grisescens) status review. Unpublished working paper, U.S. Fish and Wildlife Service, Asheville, NC. March 2007.
[13] Harvey, M.J. 1992. Bats of the eastern United States. Arkansas Game and Fish Commission, Little Rock.
[14] Traylor-Holzer, K., Tawes, R., Bayless, M., Valenta, A., Rayman, N., and Songsasen, N. (eds.). 2010. Insectivorous Bat Captive Population Feasibility Workshop Report. IUCN/SSC Conservation Breeding Specialist Group: Apple Valley, MN.
[15] Department of Interior. 2002. Semiannual Regulatory Agenda. December 9, 2002 (67 FR 74583).
Gray whale (Eastern North Pacific DPS) (Eschrichtius robustus pop. 3)
| Status: Delisted | Critical habitat: none | Listed: 6/2/1970 | Recovery plan: none |
Range: AK(b), CA(b), OR(b), WA(b) ---
SUMMARY
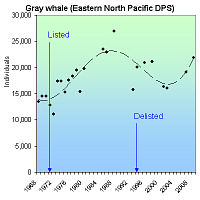
Gray whales declined precipitously due to whaling, becoming extinct in the Atlantic, endangered in the Eastern North Pacific and extremely endangered in the Western North Pacific. They are threatened by oil and gas drilling and coastal development. In 1968, there were 13,426 Eastern North Pacific gray whales. The species was was listed as endangered in 1970 and removed from the list in 1994 when the population reached 20,103 whales. The 2009 population was estimated to be 21,911.
RECOVERY TREND
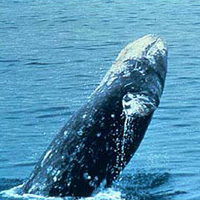
The Eastern North Pacific gray whale (Eschrichtius robustus) migrates along the West Coast from summer feeding grounds in the Bering and Chukchi seas to nearly landlocked lagoons and bays along the west coast of Baja California where calves are born from early January to mid-February [2].
It historic population size has been estimated at about 19,500 [1] based on log books and historical accounts [4]. However, recent genetic analysis indicates a historic population on the order of 96,000 whales (76,000–118,000) [3].
Early indigenous whaling impacts were likely substantial to this near-shore species, especially to resident populations [4], but have not been quantified. The added pressure of commercial whaling however, drove the species to near extinction in the 19th and 20th centuries. Between 1846 and 1900, commercial whalers killed nearly 9,000 gray whales and indigenous hunters about 6,000 [1]. After 1900, the two groups killed another 11,500 whales, for a total of 27,000 between 1846 and 1946.
Commercial whaling was prohibited in 1946 and indigenous whaling was greatly reduced. At the time of its listing as an endangered species in 1970, the gray whale was extinct in the Atlantic, at low levels in the Eastern North Pacific, and at extremely low levels in the Western North Pacific [2].
Between 1968 and 1988, the Eastern North Pacific gray whale grew from 13,426 whales to a post-exploitation peak of 26,916 [1]. It declined to 20,103 whales by 1994 when it was delisted, remained stable for a few years, and then declined again to about 16,000 whales in 2001 and 2002. These declines were preceded by an unprecedented number of whale strandings in 1999 (273) and 2000 (355), greatly exceeding the previous average (38). The stranding were also unusual in being dominated by adults and subadults (>60%) rather than calves. The whales were visibly emaciated, possibly due to poor feeding conditions (i.e. extensive ice cover) in their wintering grounds.
Recent population estimate are in dispute. The 2010 reanalysis cited for all population numbers in this account [1], indicates the stock grew to 21,911 whales in 2009.
The Western North Pacific gray whale remains listed as an endangered foreign species. It has not recovered since listing and today is comprised of less than 100 whales which are highly endangered by oil and gas drilling proposals in Asia and Russia.
CITATIONS
[1] Punt, A.E. and P.R. Wade. 2010. Population Status of the Eastern North Pacific Stock of Gray Whales in 2009. U.S. Dep. Commer., NOAA Tech. Memo. NMFS-AFSC-207, 43 p.
[2] National Marine Fisheries Service. 1994 Final Rule to Remove the Eastern North Pacific Population of the Gray Whale From the List of Endangered Wildlife. 59 Fed. Reg. 31094.
[3] Alter, S.E., E. Rynes and S.R. Palumbi. 2007. DNA evidence for historical population size and past ecological impacts of gray whales. Proceedings of the National Academy of Sciences 104:15162–15167.
[4] Pyenson, N.D. and D.R. Lindberg. 2011. What Happened to Gray Whales during the Pleistocene? The Ecological Impact of Sea-Level Change on Benthic Feeding Areas in the North Pacific Ocean. PLoS ONE 6(7): e21295. doi:10.1371/journal.pone.0021295.
Gray wolf (Northern Rockies DPS) (Canis lupus (Northern Rockies DPS))
| Status: Endangered | Critical habitat: none | Listed: 3/11/1967 | Recovery plan: 8/3/1987 |
Range: ID(b), MT(b), eastern OR(b), eastern WA(b), WY(b), northern UT(o)
SUMMARY
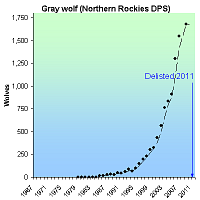
Gray wolves were purposefully hunted, trapped and poisoned to near extinction in the western United States, often by the federal government or with the encouragement of private and state bounties. By 1973, no wild wolves remained in the region. They were listed as endangered in 1967 and began recolonizing the Northern Rocky Mountains from Canada in the early 1980s. Due to prohibition of killing, habitat protection, and reintroductions, the population grew rapidly, was downlisted in 2003, reached 1,679 wolves by 2009, and was delisted in 2011.
RECOVERY TREND
The Northern Rocky Mountains gray wolf (Canis lupus pop.) historically occurred throughout Idaho, the eastern third of Washington and Oregon, all but the northeastern third of Montana, the northern two-thirds of Wyoming, and the Black Hills of South Dakota [1]. As early American settlers began moving west, populations of the gray wolf’s important prey species were over-hunted, causing the wolves to resort to hunting sheep and cattle. As a result, bounty hunting of wolves began in the 19th century and continued through as late as 1965. Around the turn of the century some population control measures were attempted in Yellowstone National Park that led to increased numbers of gray wolves in the area. In response, however, people began killing large numbers of wolves [1]. Beginning in 1912 a minimum of 136 wolves and 80 pups were killed each year and by 1920, only 30 to 40 wolves persisted in this area [1]. By 1973, gray wolves were exterminated from the western lower 48 states and existed only in northeastern Minnesota and Isle Royal, Mich. [2].
Protection of gray wolves was not initiated until the enactment of the Endangered Species Act. By this time gray wolves no longer occurred in the western United States except for the occasional dispersion of Canadian animals into Montana and Idaho that failed to survive long enough to reproduce [3]. Successful recolonization of gray wolves into the Rocky Mountain region did not occur until the early 1980s. Around this time, the Rocky Mountain Gray Wolf Recovery Team was organized with the intent of developing standard observation methods for studying and monitoring the wolves. In 1987, a recovery plan was published. Around this time, the status of the Rocky Mountain Gray wolf was still quite precarious. In Montana, from 1985 to 1986 roughly 15 to 20 wolves were believed to occur near Glacier National Park. In Wyoming from 1982 to 1985, 15 wolves were reported at Yellowstone National Park, and the same number were believed to occur in Idaho in 1986 [1].
Regular monitoring of the Rocky Mountain gray wolf population did not occur until 1995, at which time there were an estimated 14 wolves in Montana and 15 in greater Yellowstone. By 2000, there were an estimated 65 wolves in Montana, 118 in Yellowstone, and 141 in central Idaho [4]. In 2004, a recovery update of the Rocky Mountain gray wolf was released, providing information regarding the status of the gray wolf at three designated recovery areas: the Northwestern Montana Recovery Area (NWMT) in Montana and the Northern Idaho panhandle; the Greater Yellowstone Area (GYA), which includes Wyoming and adjacent parts of Idaho and Montana; and the Central Idaho (CID) area covering central Idaho and adjacent parts of southwest Montana. As of 2004, 16 packs containing 59 wolves were documented at NWMT [3]. In the GYA, 171 wolves in 16 packs inhabited the Wyoming portion and 17 packs occurred in the Montana region. In the CID 64 wolves in 40 groups and as individuals were monitored [3]. The total population of free ranging Rocky Mountain Gray wolves for 2004 was estimated at 59 in Montana, 324 in Greater Yellowstone, and 422 in Central Idaho. In 2005 population estimates were 93, 294, and 525 respectively [4]. In 2009 the population of wolves in the Northern Rockies was about 1,679, up from 1,545 in 2007 and 1,300 in 2006 [4].
The U.S. Fish and Wildife Service delisted the Northern Rockies gray wolf in 2008, but the decision was objected to by conservationists who argued that the recovery plan goal was outdated, and insufficient to remove the threat of extinction because it did not require a large enough or well-connected enough wolf meta-population. In 2011, with encouragement from the Department of Interior, Congress for the first time in the history of the Endangered Species Act, overruled the courts and order the delisting of the Northern Rockies gray wolf without biological or legal review [7].
CITATIONS
[1] U. S. Fish and Wildlife Service. 1987. Northern Rocky Mountain Wolf Recovery Plan. U.S. Fish and Wildlife Service. Denver, CO. 119pp
[2] U. S. Fish and Wildlife Service. 2004. Gray Wolf. U.S. Fish and Wildlife Service. Revised May, 2004.
[3] U.S. Fish and Wildlife Service, Nez Perce Tribe, National Park Service, Montana Fish, Wildlife and Parks, Idaho Fish and Game, and USDA Wildlife Services. 2005. Rocky Mountain Wolf Recovery 2004 Annual Report. U.S. Fish and Wildlife Service, Helena, MT. 72pp. Available at <http://westerngraywolf.fws.gov/annualreports.htm>
[4] International Wolf Center. 2011. Gray Wolf Population Trends in the Contiguous United States. Website <http://www.wolf.org/wolves/learn/wow/regions/United_States_Subpages/Biology1.asp> Accessed October 6, 2011..
[5] U.S. Fish and Wildlife Service. 2006. Designating the Northern Rocky Mountain Population of Gray Wolf as a Distinct Population Segment; Removing the Northern Rocky Mountain Distinct Population Segment of Gray Wolf From the Federal List of Endangered and Threatened Wildlife. Federal Register, February 8, 2006 (71 FR 6634-6660).
[6] U.S. Fish and Wildlife Service. 2007. U.S. Fish and Wildlife Service data cited by Brad Knickerbocker, Gray wolves may lose US protected status, Christian Science Monitor, Febraury 1, 2007.
[7] U.S. Fish and Wildlife Service. 2011. Endangered and Threatened Wildlife and Plants; Reissuance of Final Rule To Identify the Northern Rocky Mountain Population of Gray Wolf as a Distinct Population Segment and To Revise the List of Endangered and Threatened Wildlife. 76 Fed. Reg. 26086.
Gray wolf (Southwest DPS) (Canis lupus (Southwest DPS))
| Status: Endangered | Critical habitat: none | Listed: 4/28/1976 | Recovery plan: 9/15/1982 |
Range: AZ(b), NM(b) --- CO(x), OK(x), TX(x), UT(x)
SUMMARY
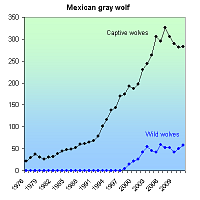
Hunting and trapping resulted in the extirpation of Mexican gray wolves from the United States by 1970. Wolves captured in Mexico were used to establish a captive-breeding program and as of 2010, there were about 50 Mexican gray wolves in the wild.
RECOVERY TREND
The southwestern gray wolf's (Canis lupus) range includes the entire range of the Mexican gray wolf (C. l. baileyi; southern New Mexico, southern Arizona, western Texas and northern Mexico) as well as northern Arizona, northern New Mexico, southern Utah and southern Colorado -- areas historically occupied by other gray wolf subspecies [1]. The wolf was purposefully hunted to near extinction in the Southwest in order to eliminate livestock depredation. In 1970, the last Mexican gray wolf was shot in Texas and the subspecies was extirpated from the United States. At that time, no wolves were present in what is now delineated as the range of the southwestern population.
The Mexican gray wolf was placed on the endangered species list in 1976 and the last five wild wolves from Mexico were captured and moved to captive breeding facilities in the United States and Mexico between 1977 and 1980 [2]. A federal recovery plan was developed in 1982 [3]. By the late 1980s captive breeding facilities were successfully rearing Mexican gray wolves, but none had been reintroduced to the wild. Conservationists filed suit in 1990, obtaining a settlement requiring reintroduction [4]. On March 29, 1998 the first 11 captive Mexican gray wolves were released into the Blue Range of the Apache-Sitgreaves National Forest in Arizona near the New Mexico border. By Dec. 31, 2005, there were 35 to49 wild wolves in eight packs on the Apache-Sitgreaves National Forest and White Mountain Apache Reservation in Arizona, and in the adjacent Gila National Forest in New Mexico [5]. The total population of wild and captive wolves grew from 22 in 1976 to 309 in 2004 [6, 7]. In 2010, the total number of captive and wild wolves was 333 [8,9]. Captive breeding is actively curtailed because of constraints on pen space and the failure of FWS to continue efforts to release new wolves into the wild [9].
CITATIONS
[1] U.S. Fish and Wildlife Service. 2003. Final Rule To Reclassify and Remove the Gray Wolf From the List of Endangered and Threatened Wildlife in Portions of the Conterminous United States; Establishment of Two Special Regulations for Threatened Gray Wolves. April 1, 2003 (68 FR 15804).
[2] U.S. Fish and Wildlife Service.1998. Establishment of a Nonessential Experimental Population of the Mexican Gray Wolf in Arizona and New Mexico. U.S. Fish and Wildlife Service. January 12, 1998 (63 FR 1752).
[3] U.S. Fish and Wildlife Service. 1982. Mexican Wolf Recovery Plan. Albuquerque, NM.
[4] Wolf Action Group v. Lujan, No. 90-0390 HB (DNM filed Apr. 3, 1990) [5] U.S. Fish and Wildlife Service. 2005. Gray Wolf Populations in the United States. U.S. Fish and Wildlife Service, Midwest Region. Accessed 1/18/06.
[6] Siminski, P. 2005. Census Report as of 31/12/2004. Email from Peter Siminski, Director of Collections, Arizona-Sonora Desert Museum, August 10, 2005
[7] Robinson, M. 2005. Wild Mexican gray wolves in the U.S. and Mexico, 1920-2005. Email from Michael Robinson, Center for Biological Diversity, August 1, 2005.
[8] U.S. Fish and Wildife Service. 2011. Mexican Wolf Blue Range Reintroduction Project Statistics. www.fws.gov/southwest/es/mexicanwolf/pdf/MW_popestimate.pdf
[9] Michael Robinson. 2011. Personal Communication, Captive Mexican Wolves in the United States.
Gray wolf (Western Great Lakes DPS) (Canis lupus (Western Great Lakes DPS))
| Status: Delisted | Critical habitat: 3/9/1978 | Listed: 1/4/1974 | Recovery plan: 1/31/1992 |
Range: MN(b), WI (b), MI(b), IA (o), IL (o), IN (o), ND (o), OH (o), SD (o)
SUMMARY
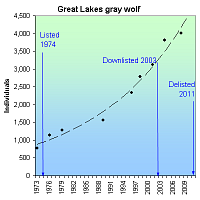
Hunting and persecution drove the gray wolf to near extinction, with only a small number of wolves remaining in Minnesota and Michigan when the species was listed in 1974. The total Great Lakes wolf population increased from fewer than 1,000 at the time of listing to approximately 4,013 in 2008.
RECOVERY TREND
The Western Great Lakes population of the gray wolf (Canis lupus) occurs in Michigan, Wisconsin and Minnesota, where it was hunted and targeted by predator eradication programs through the early 20th century [2]. Bounty programs initiated in the 19th century continued through as late as 1965 [2]. As a result, the gray wolf was driven to near extinction. In 1974, when the gray wolf became one of the first species protected under the 1973 Endangered Species Act, it was found in the wild only in extreme northeastern Minnesota where several hundred wolves remained, and on Isle Royale [2].
Minnesota: Just prior to listing, gray wolf numbers in Minnesota were estimated at between 500 and 1,000 individuals [4]. By 1978, numbers appeared to have increased slightly and the U.S. Fish and Wildlife Service proposed downlisting the Minnesota gray wolf to “threatened” so that “problem” wolves could be killed [5]. A 1988-89 winter survey produced an estimate of 1,500 to 1,750 wolves and in 1998, surveys estimated that there were more than 2,400 individual wolves in Minnesota [4]. As of late winter 2004-05, there were roughly 3,020 gray wolves (485 packs) in Minnesota [6]. In addition, over the last three decades, wolves have increased their range in the north-central and central parts of Minnesota [4].
Wisconsin: From 1960 to 1975, there were no breeding wolves in Wisconsin [4]. As populations in Minnesota expanded after listing however, wolves apparently dispersed into the state. In 1980, 25 wolves inhabited Wisconsin; by 1995 the number had increased to 83 wolves comprising 18 packs, and by 2004 there were 373 wolves comprising 109 packs [4]. As of early 2005, there were about 425 gray wolves in Wisconsin [6].
Michigan: In 1995, 80 wolves were counted in Michigan, up from a small number of individuals found on Isle Royale and none on the mainland at the time of listing [4]. By 2000, this number had increased to 216 [4], and as of late winter 2004-05, there were roughly 435 gray wolves in the state: 405 (87 packs) on the Upper Peninsula and 30 (3 packs) on the Isle Royale [6].
The Western Great Lakes wolf was downlisted to "threatened" status in 2003 and removed from the endangered species list in 2011 [8].
CITATIONS
1] U.S. Fish and Wildlife Service. 2005. Oregon District Court Rules Against Gray Wolf Reclassification. Website <http://www.fws.gov/midwest/wolf/esa-status/or-court-rule.htm> accessed 3/2006.
[2] U.S. Fish and Wildlife Service. 2004. Gray Wolf (Canis lupis) Biologue, updated May, 2004. Available at <http://www.fws.gov/midwest/wolf/biology/biologue.htm>.
[3] International Wolf Center. 2005. Gray Wolf Population Trends in the Contiguous United States. Updated September, 2005. (www.wolf.org)
[4] U.S. Fish and Wildlife Service. 2004. Gray Wolf Recovery in Minnesota, Wisconsin and Michigan. Available at <http://www.fws.gov/midwest/wolf/recovery/r3wolfct.htm>.
[5] U.S. Fish and Wildlife Service. 1978. Reclassification of the Gray Wolf in the United States and Mexico, with Determination of Critical Habitat in Michigan and Minnesota. Federal Register (43:9607-9615).
[6] U.S. Fish and Wildlife Service. 2005. Questions and Answers about gray wolf recovery in North America. Website <http://www.fws.gov/midwest/wolf/recovery/namerica.htm> accessed 3/2006.
[7] International Wolf Center. 2011. Gray Wolf Population Trends in the Contiguous United States. Website http://www.wolf.org/wolves/learn/wow/regions/United_States_Subpages/Biology1.asp> Accessed October 6, 2011.
[8] U.S. Fish and Wildlife Service. 2011. Revising the Listing of the Gray Wolf (Canis lupus) in the Western Great Lakes. 76 Fed. Reg. 81666.
Grizzly bear (Yellowstone DPS) (Ursus arctos (Yellowstone DPS))
| Status: Threatened | Critical habitat: none | Listed: 7/28/1975 | Recovery plan: 3/13/2007 |
Range: MT(b), WY(b)
SUMMARY
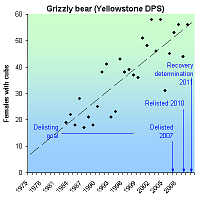
Grizzly bears were extirpated from most of the Lower 48 states by killing, habitat destruction, food chain disruption, and the loss of large wildland areas. By 1975, only six populations remained. Due to Endangered Species Act protections, the Yellowstone grizzly bear population increased from ~224 bears in 1975 to ~582 in 2010. It was delisted in 2007, relisted in 2010 due to concerns about habitat loss and global warming, and declared recovered in 2011 by a federal status report.
RECOVERY TREND
The grizzly bear (Ursus horribilis) formerly ranged over much of North America from the mid-plains westward to California and from central Mexico north to Canada and Alaska [1]. During the early 1880s there were approximately 50,000 grizzlies in the lower 48 states [1]. Between 1850 and 1920, the species was extirpated from 95 percent of its continental U.S. range [2]. In 1922, 37 populations remained [3], declining to six by 1975 when the grizzly bear was listed as “threatened” under the federal Endangered Species Act in the conterminous U.S. [3]. At the time of listing, fewer than 1,000 grizzlies remained in about 2 percent of the species' historic range [1].
Early declines in grizzly populations were largely a result of persecution by European settlers; grizzly bears were shot, poisoned, and trapped wherever they were found [11]. Despite protection under the Endangered Species Act, human-caused mortality, largely resulting from human bear conflicts, has remained the biggest threat to grizzlies [1]. Approximately 88 percent of U.S. grizzly bear deaths documented during studies over the past 20 years were caused by humans, both legally and illegally [2]. Habitat degradation associated with rural or recreational development, road building, and energy and mineral exploration is also a major threat to grizzly bear survival [5]. Habitat destruction in valley bottoms and riparian areas is particularly harmful [5].
The 2005 population was between 1,200 and 1,400 grizzly bears in Wyoming, Montana, Idaho and Washington state [1, 3]. Grizzly bears have also been reported in the San Juan Mountains of Colorado in recent years, but have not been confirmed since a grizzly was killed in 1979 [3]. Only two populations (Yellowstone and Northern Continental Divide) contain more than 350 individuals [6]. There are six grizzly bear recovery areas in the conterminous U.S. including Yellowstone National Park and surrounding areas.
The Yellowstone recovery area consists of 9,200 square miles of northwest Wyoming, eastern Idaho and southwest Montana [3]. When the grizzly bear was listed in 1975, the population was variously estimated at 136, 229, 234 and 312 bears [11]. Prior to the mid-1980s, low adult female survival was thought to be driving the decline of this population [11]. In the early 1980s, with the development of the first Grizzly Bear Recovery Plan, agencies began work to control mortality and to increase adult female survivorship [11]. In 1999, the population was estimated to have increased to between 400 and 600 [7]. Some research suggests that population trends seen through the mid-1990s were largely tied to the success/failure of the whitebark pine (an important food source) crop [8]. Starting in 1993, counts of female bears with cubs-of-the-year were used to calculate minimum grizzly bear population estimates [6]. These estimates suggest that the grizzly population increased at a rate of 4 percent to 7 percent per year starting in the early 1990s [9]. The 2005 population was estimated at "over 580" bears [9] then re-estimated at "over 500" bears [11]. The Yellowstone population has expanded by 48 percent since 1970, [9] and 68 percent of suitable habitat outside of the recovery zone is now thought to be occupied by grizzly bears [11]. In 2006, the minimum population was 405 [13], and by 2010, Fish and Wildlife Service estimated 582 bears in this population [12].
The 1993 grizzly bear recovery plan outlined three demographic recovery criteria to be met in order to consider delisting of the Yellowstone grizzly: 1) A minimum of 15 females with cubs-of-the-year be maintained over a running six-year average both inside the recovery zone and within a 10-square-mile area immediately surrounding the recovery zone 2) 16 of 18 bear management units within the recovery zone must be occupied by females with young, with no two adjacent bear management units unoccupied, during a six-year sum of observations 3) The running six-year average for total known, human-caused mortality should not exceed 4 percent of the minimum population estimate in any two consecutive years; and human-caused female grizzly bear mortality should not exceed 30 percent of the above total in any two consecutive years [11]. The U.S. Fish and Wildlife Service believes these criteria have been met [11].
On March 29, 2007 the Fish and Wildlife Service declared the Yellowstone grizzly bear is a distinct population segment which is fully recovered and removed it from the endangered species list [11]. The decision has been opposed by many conservation groups and scientists who assert that the population is too small to be viable in the long-term, habitat and hunting/persecution threats will not be adequately addressed without Endangered Species Act protection, and global warming is devastating white-bark pine habitat [10, 11]. In response to a lawsuit, on Sept. 21, 2009, the U.S. District Court in Montana ordered the Yellowstone grizzly bear to be reinstated to the list of threatened species, which occurred on March 26, 2010 [15]. The 2011 Five-Year Review recommends delisting the Yellowsone DPS of the grizzly bear [12].
CITATIONS
[1] U.S. Fish and Wildlife Service. 2005. Grizzly Bear Fact Sheet. Accessed at <http://mountain-prairie.fws.gov/species/mammals/grizzly/factsheetGrizzlybear111405.pdf>.
[2] Mattson, D.J., R.G. Wright, K.C. Kendall, and C.J. Martinka. 1995. Grizzly Bear In LaRoe, E.T., G.S. Farris, C.E. Puckett, P.D. Doran, and M.J. Mac, (eds). Our living resources: a report to the nation on the distribution, abundance, and health of U.S. plants, animals, and ecosystems. U.S. Department of the Interior, National Biological Service, Washington, DC. 530 pp. Accessed at <http://biology.usgs.gov/s+t/noframe/c032.htm>.
[3] U.S. Fish and Wildlife Service. 2005. Grizzly Bear Recovery. Mountain-Prairie Region, Endangered Species Program. Website <http://mountain-prairie.fws.gov/species/mammals/grizzly/> accessed 3/2006.
[4]. Honnold, D.L. and L. Lucas. 2007. Notice of Violations of the Endangered Species Act in Designating and Delisting the Yellowstone Grizzly Bear Distinct Population Segment. 60-day notice of intent to sue filed on behalf of the Sierra Club, Natural Resources Defense Council, Alliance for the Wild Rockies, Humane Society of the United States, Center for Biological Diversity, Western Watersheds Project, Great Bear Foundation, and Jackson Hole Conservation Alliance, April 2,2007.
[5] U.S. Fish and Wildlife Service. 2005. Grizzly Bear (Ursus Horriblis). Website <http://ecos.fws.gov/docs/life_histories/A001.html> Updated 9/2005, accessed 3/2006
[6] Schartz, C.C., M.A. Haroldson, K.A. Gunther, and D Moody. 2002. Distribution of Grizzly Bears in the Greater Yellowstone Ecosystem, 1990–2000. Ursus 13:203-212.
[7] U.S. Fish and Wildlife Service. 2000. News Release: Public to Review Strategy for Managing a Recovered Population of Grizzly Bears in the Yellowstone Ecosystem. Accessed at <http://mountain-prairie.fws.gov/PRESSREl/00-05.htm>.
[8] Pease, C. and D.J. Mattson. 1999. Demography of the Yellowstone grizzly bears. Ecology 80(3):957-975.
[9] U.S. Fish and Wildlife Service. 2005. Grizzly Bear Recovery: Yellowstone. Mountain-Prairie Region, Endangered Species Program. Website <http://mountain-prairie.fws.gov/species/mammals/grizzly/yellowstone.htm> accessed 3/2005.
[10] NRDC. 2005. Grizzly Bears in Peril: Plan to remove protections for Yellowstone grizzlies threatens their long-term survival. Website <http://www.nrdc.org/wildlife/animals/bears.asp> updated 8/24/2005, accessed 3/2006.
[11] U.S. Fish and Wildlife Service. 2007. Final Rule Designating the Greater Yellowstone Area Population of Grizzly Bears as a Distinct Population Segment; Removing the Yellowstone Distinct Population Segment of Grizzly Bears From the Federal List of Endangered and Threatened Wildlife; 90-Day Finding on a Petition To List as Endangered the Yellowstone Distinct Population Segment of Grizzly Bears. March 29, 2007 (72 FR 14866).
[12] U.S. Fish and Wildlife Service. 2011. Grizzly Bear (Ursus arctos horribilis) 5-Year Review: Summary and Evaluation. Missoula, MT.
[13] Haroldson, M.A. and Frey, K. 2007. Grizzly Bear Mortalities. Table 13, Page 18 in C,C, Schwartz, M.A. Haroldson and K. West, editors. Yellowstone grizzly bear Investigations: Annual Report of the Interagency Grizzly Bear Study Team, 2006. U.S. Geological Survey, Bozeman, MT, USA.
[14] Haroldson, M.A. Assessing Trend and Estimating Population Size from Counts of Unduplicated Females. Pages 10-15 in C.C. Schwartz. M.A. Haroldson and K. West, editors. Yellowstone grizzly bear invesrtigations: annual report of the Interagency Grizzly Bear Study Team, 2010. U.S. Geological Survey, Bozeman, MT, USA.
[15] U.S. Fish and Wildlife Service. March 26, 2010. Reinstatement of Protections for the Grizzly Bear in the Greater Yellowstone Ecosystem in Compliance With Court Order. 75 Fed. Reg. 14496.
Guadalupe fur seal (Arctocephalus townsendi)
| Status: Threatened | Critical habitat: none | Listed: 12/16/1985 | Recovery plan: none |
Range: CA(b) ---
SUMMARY
The Guadalupe fur seal was largely extirpated from California in the 1800's due to hunting; it was thought extinct until a bull was seen on San Nicholas Island, California in 1949, and 14 seals were found on Guadalupe in 1954. Since listing, seals have recolonized the U.S. and have been seen in the Channel and Farallon Islands with increasing regularity since the 1980s. The population on Guadalupe Island increased from 1,600 in 1984 to 12,000 in 2003.
RECOVERY TREND
The precise historic range of the Guadalupe fur seal (Arctocephalus townsendi) is not known because early fur traders did not distinguish it from the northern fur seal. It may have extended from the Revillagigedo Islands of Mexico north to Monterey Bay, California and possibly the Farallon Islands. Historic breeding colonies likely existed on California’s San Miguel and San Nicolas Islands.
The historic population was between 20,000 and 100,000 [1], but collapsed rapidly under European hunting pressure. In the three years between 1808-1810, 130,000 seals were killed [3]. By the end of the nineteenth century, populations were so depleted that just 5,575 seals were killed in a 16-year hunting period (1876-1892) [3]. The species was extirpated from California by 1825 and from Isla Benito del Este, Mexico sometime in the 19th century [4]. Only seven seals were found on its Guadalupe Island, Mexico stronghold in 1892. All known seals (15) were killed there in 1894; 35-60 were rediscovered in 1926, but virtually all were killed in 1928. The species was believed extinct until a bull was seen on San Nicholas Island, California in 1949, and 14 seals were found on Guadalupe in 1954 [3].
The Guadalupe Island population has grown steadily since 1954, reaching approximately 12,000 in 2003 [2].
Isla Benito del Este was recolonized by the Guadalupe population sometime between 1984 and 1988 when several bulls were observed hauling out but not breeding [2]. Breeding was first recorded in 1997 when nine pups and 247 non-pups were observed [4]. By 2004, the Isla Benito del Este popuation reached 648 [2].
Seals have also recolonized the United States, being seen in the Channel and Farallon Islands with increasing regularity since the 1980s. In 1997, a pup was born on San Miguel Island.
Individuals are now occasionally sighted as far south as Tapachula near the Mexico/Guatemala border, and as far north as the Point Reyes National Seashore in California, and in the Gulf of California.
CITATIONS
[1] NOAA Fisheries. 2000. Stock Assessment Report: Guadalupe Fur Seal (Arctocephalus townsendi), revised December 15, 2000. National Oceanic and Atmospheric Administration, Washington, D.C.
[2] Gallo-Reynoso J.P., M.O. Maravilla Chávez and A.L. Figueroa Carranza. 2004. La población del lobo fino de Guadalupe, Arctocephalus townsendi, en México. VII Congreso Nacional de Mastozoología, 8-12 de Noviembre de 2004. San Cristóbal de Las Casas, Chiapas. México.
[3] Gilbert, L.R. and R. Hilborn. 2001. Catastrophic events and recovery from low densities in populations of otarriids: implications for risk of extinction. Mammal Review 31(2):131-150.
[4] Gallo-Reynoso, J.P. 2005. Personal communication with Juan Pablo Gallo-Reynoso, Laboratorio de Ecofisiologí, CIAD, Unidad Guaymas.
Humpback whale (Megaptera novaeangliae)
| Status: Endangered | Critical habitat: none | Listed: 6/2/1970 | Recovery plan: 11/15/1991 |
Range: AL(o), AK(s), CA(s), CT(s), DE(s), FL(s), GA(s), HI(s), LA(o), ME(s), MD(s), MA(s), MS(o), NH(s), NY(s), NJ(s), NC(s), OR(s), RI(s), SC(s), TX(o), VA(s), WA(s) ---
SUMMARY
Humpback whale populations were greatly depleted by commercial whaling by the early 1900s. In 1966, the entire North Pacific humpback population was thought to number only around 1,200 animals. As of 2010, the total population of North Pacific humpback was estimated at 21,808.
RECOVERY TREND
Humpback whales (Megaptera novaeangliae) occur in all oceans of the world, generally inhabiting waters over continental shelves, along continental edges and around some oceanic islands [1]. They winter in warm waters in a few specific locations and mate and give birth on wintering grounds where little feeding is thought to take place [1]. For the summer season, they migrate to high-latitude areas where they tend to stay relatively close to shore (although some groups inhabit deeper water) and spend the majority of their time feeding [1].
Humpback whale populations were greatly depleted by commercial whaling [1]. Prior to whaling, humpback whale numbers are thought to have exceeded 125,000 [1]. American whalers alone killed between 14,164 and 18,212 humpback whales between 1805 and 1909 [1]. Humpback whales first received protection in the North Atlantic in 1955 when the International Whaling Commission placed a prohibition on non-subsistence whaling by member nations [1]. Protection was extended to the North Pacific and southern hemisphere populations following the 1965 hunting season [1]. Although hunting has largely been stopped (some exceptions exist that allow the take of a limited number of whales), and populations appear to be increasing, human impacts such as vessel collisions and entanglements are factors that may be slowing the recovery of the humpback whale population [3].
The total level of human-caused mortality and serious injury is unknown, but data indicate that it is significant [3]. Humpback whales are also vulnerable to marine pollution [2]. The increasing levels of anthropogenic noise in the world’s oceans, such as that produced by certain types of sonar, may also be problematic for whales, particularly for baleen whales that communicate using low-frequency sound [4].
GULF OF MAINE, WESTERN NORTH ATLANTIC STOCK
There are likely six stocks within the western North Atlantic humpback population [3]. A feeding aggregation in the Gulf of Maine (considered a single stock) is the only one U.S. waters [3]. Within New England waters, humpbacks are present in spring, summer and autumn [3]. They spend much of their time feeding and their distribution in this region has been largely correlated to prey species and abundance [3]. In winter, humpbacks from the different western Northern Atlantic feeding areas mate and calve primarily in the West Indies, where spatial and genetic mixing among subpopulations occurs [3]. From late December to early April most of the population is found at Silver and Navidad Banks at the end of the Bahamian archipelago, and along the coast of the Dominican Republic [1]. They are also found at much lower densities throughout the remainder of the Antillean arc, from Puerto Rico to the coast of Venezuela [3]. The only U.S.-controlled portions of the breeding range include waters along the Northwest coast of Puerto Rico and the U.S. Virgin Islands [1]. Not all of the stock migrates to the West Indies every winter, however, and significant numbers of animals are found in mid- and high-latitude regions during the winter months [3]. There have recently been a number of wintertime humpback sightings in coastal waters of the southeastern U.S. [3].
North Atlantic humpback numbers are thought to be slowly increasing. An average increase of 1 percent (SE=0.005) was estimated for the period 1979 to 1993 [3]. The best estimate of the number of North Atlantic humpbacks in 1992 and 1993 was 11,570 (CV=0.069) [3]. Data suggest that the Gulf of Maine humpback whale stock is also steadily increasing in size at a rate consistent with the larger population [3]. The Gulf of Maine minimum population was estimated to be 501 in 1992 and 647 in 1999 [3]. Both of these estimates are likely low due to sampling technique [3]. The best estimate of the actual number of animals is thought to be 902 [3].
NORTH PACIFIC
Historic summering range for the North Pacific humpback whales encompassed coastal and inland waters around the Pacific rim from Point Conception, Calif. north to the Gulf of Alaska and the Bering Sea, and west along the Aleutian Islands, Kamchatka Peninsula and into the Sea of Okhotsk [1]. Rough estimates of the pre-whaling population speculate that there were around 15,000 humpbacks in the North Pacific [1]. In 1966, the entire North Pacific humpback population was thought to number only around 1,200 animals [4]. This estimate increased to between 6,000 and 8,000 by 1992 [4]. Although these estimates are uncertain and are based on different methods, the 6 percent to 7 percent growth rate implied is consistent with the observed growth rate of the better-studied eastern North Pacific subpopulation [4].
Although the International Whaling Commission only considered North Pacific humpbacks to be one stock, there is now good evidence for multiple stocks in the North Pacific [4]. There are at least three relatively separate populations that migrate between their respective summer/fall feeding areas and winter/spring calving and mating areas; the eastern North Pacific stock, the central North Pacific stock and the western North Pacific stock [4]. These divisions are a simplification, however, and are not perfect. In general, interchange occurs (at low levels) between breeding areas, although fidelity is extremely high among the feeding areas [4].
The eastern North Pacific stock spend much of their lives within U.S. waters [1]. They winter in coastal Central America and Mexico, migate along the U.S. West Coast, and summer in British Columbia [4]. Mark-recapture population estimates increased steadily from 1988/90 to 1997/98 at about 8 percent per year [4]. Surveys of humpback whale abundance in feeding areas in California, Oregon and Washington conducted from 1991 to 2002 show a steady upward trend with the exception of a large decline in 2000 [5]. The 2002 to 2003 population estimate (1,391, CV=0.22) was higher than any previous estimate and may indicate that the lower numbers in 1999 to 2001 exaggerated any real decline that might have occurred [5]. It could also indicate that a real decline was followed by an influx of new whales from another area [4]. This latter view was substantiated by a greater fraction of new whales seen for the first time in 2003 [4].
The central North Pacific stock, in general, winters around the Hawaiian Islands (some go to Mexico) and migrates to northern British Columbia/Southeast Alaska and Prince William Sound west to Kodiak [6]. Three feeding areas for the Central North Pacific stock have been studied using photo-identification techniques; these include southeastern Alaska, Prince William Sound and Kodiak Island [6]. There has been some exchange of individual whales between these locations, although the aggregation in southeastern Alaska seems to remain relatively isolated from other groups [6]. The current total estimated abundance for this stock is 4,005 individuals [7]. The abundance of the Prince William Sound feeding aggregation is thought to be fewer than 200 whales [6]. In the Kodiak region, 127 individual whales were identified between 1991 and 1994 and abundance was estimated to be 651 (95 percent CI: 356-1,523) [6]. The number of animals in the Southeast Alaska aggregation is thought to have increased [6]. The 2000 estimate of 961 is substantially higher than estimates from the 1980s, which put numbers in the high 300s [6]. In a 2004 report, an annual population rate of increase was calculated to be 10 percent [6]. Another study, based on aerial surveys conducted across the main Hawaiian Islands, and designed specifically to estimate trends in the Central Pacific Stock, found an annual increase of 7 percent from 1993 to 2000 [8]. In 2006, the Southeast Alaska population reached 1,115 [10].
The western North Pacific stock is the least studied of the Northern Pacific populations [9]. This aggregation winters off Japan and probably migrates to waters west of the Kodiak Archipelago (the Bering Sea and Aleutian Islands) in summer/fall [9]. Recent surveys in the central-eastern and southeastern Bering Sea in 1999 and 2000 resulted in humpback whale sightings suggesting that the Bering Sea is an important feeding area [9]. New information indicates that humpback whales from the western and Central North Pacific stocks mix on summer feeding grounds in the central Gulf of Alaska and perhaps the Bering Sea [9]. A major research effort (the SPLASH project) was initiated in 2004 in order to better delineate stock structure of humpback whales in the North Pacific [9]. There are no reliable estimates for the abundance of humpback whales in the western Pacific stock because surveys of the known feeding areas are incomplete, and not all feeding areas are known [9].
The 2010 estimate of abundance of humpback whales in the entire North Pacific Basin based on a Chapman-Petersen estimate is 21,808 (CV=0.04) [10].
CITATIONS
[1] National Marine Fisheries Service. 1991. Recovery Plan for the Humpback Whale (Megaptera novaeangliae). Prepared by the Humpback Whale Recovery Team for the Silver Spring, Maryland. 105pp.
[2] NatureServe. 2005. NatureServe’s Central Databases. Arlington, VA. U.S.A.
[3] NOAA Fisheries. 2005. Stock Assessment Report. Humpback Whale (Megaptera novaeangliae): Gulf of Maine Stock, revised Dec. 2004. National Oceanic and Atmospheric Administration, Washington, D.C.
[4] NOAA Fisheries. 2005. Stock Assessment Report. Humpback Whale (Megaptera novaeangliae): Eastern North Pacific Stock, revised May 15, 2005. National Oceanic and Atmospheric Administration, Washington, D.C.
[5] Calambokidis J., T. Chandler, L. Schlender, G.H. Steiger, and A. Douglas. 1995-2000. Final reports to Monterey Bay, Channel Islands, and Olympic Coast National Marine Sanctuaries, Southwest Fisheries Science Center, and University of California at Santa Cruz. Cascadia Research, 218 1/2; W Fourth Ave., Olympia, WA 9850. Accessed at http://www.cascadiaresearch.org/abstracts/abstract.htm.
[6] NOAA Fisheries. 2005. Stock Assessment Report. Humpback Whale (Megaptera novaeangliae): Central North Pacific Stock, revised Feb 12, 2005. National Oceanic and Atmospheric Administration, Washington, D.C.
[7] NOAA Fisheries, Office of Protected Resources. Cetaceans: Whales, Dolphins, and Porpoises. Humpback Whale. Website <http://www.nmfs.noaa.gov/pr/species/mammals/cetaceans/humpback_whale.doc> accessed January, 2005.
[8] Mobley J. Jr., S. Spitz, and R. Grotefendt. 2001. Abundance of Humpback Whales in Hawaiian Waters: Results of 1993-2000 aerial surveys. Hawaiian Islands Humpback Whale National Marine Sanctuary Office of National Marine Sanctuaries. National Oceanic and Atmospheric Administration U.S. Dept of Commerce. Available at <http://hawaiihumpbackwhale.noaa.gov/research/HIHWNMS_Research_Mobley.pdf>.
[9] NOAA Fisheries. 2005. Stock Assessment Report. Humpback Whale (Megaptera novaeangliae): Western North Pacific Stock, revised Feb 5, 2005. National Oceanic and Atmospheric Administration, Washington, D.C.
[10] NOAA Fisheries. 2010. Draft Stock Assessment Report. Humpback Whale (Megaptera novaeangliae): Central North Pacific Stock, revised Jan 28, 2010. National Oceanic and Atmospheric Administration, Washington, D.C.
Key deer (Odocoileus virginianus clavium)
| Status: Endangered | Critical habitat: none | Listed: 3/11/1967 | Recovery plan: 5/18/1999 |
Range: FL(b) ---
SUMMARY
Hunting and habitat loss caused the Key deer to decline to about 50 animals by the 1920s. It is currently threatened by car collisions, habitat loss and sea-level rise. After being listed as endangered species in 1967, the Key deer's population decreased from about 400 to about 200 by 1971. It increased relatively steadily since then to 646 in 2001. The 2011 population likely exceeds 800.
RECOVERY TREND
The Key deer (Odocoileus virginianus clavium) was saved from extinction by an editorial cartoon, a tommy gun-toting, former funeral home director, and an 11-year old boy scout from Miami, Fla. The establishment of two national wildlife refuges, a federal recovery program, and four decades ofwork under the Endangered Species Act listing increased the deer's population size from about 200 in 1971 to 646 in 2001, and probably more than 800 today.
BIOGEOGRAPHY AND EVOLUTION
The Key deer is the smallest subspecies of white-tailed deer — about the size of a German shepherd. A predecessor of the Key deer is believed to have migrated to the Florida Keys from the mainland over a land bridge exposed during the Wisconsin Glaciation (the last major advance of the North American Laurentide ice sheet). The expansion began some 110,000 years ago and lasted for about 100,000 years. At or near its maximum impact on southern Florida 15,000 years ago, the sea level was 300-350 feet below its current level, connecting the Keys to the mainland and vastly increasing the region's above-water land mass.
The sea level rose as the climate warmed during the Holocene, once again disconnecting the Keys from the mainland, trapping the recently arrived, mainland-evolved deer on a series of small islands from about Key Vaca to Key West [1]. The subspecies slowly diminished in size as smaller deer survived and reproduced, while larger deer starved and reproduced at lower levels due to reduced food availability.
Key deer became strong swimmers, moving seasonally between the islands in response to fresh-water availability. During the wet season, they occupy many islands; during the dry season, they retreat to the 14 islands with fresh surface water, especially Big Pine and No Name Keys, which offer the greatest extent of freshwater [1].
The Key deer evolved in an environment with few predators or competitors, with physical and vegetative structures was shaped by frequent hurricanes, fire and drought [1]. All of those changed with the arrival and eventual dominance of humans in Florida.
POPULATION STATUS AND TREND
Key deer were an important food source to the Calusa Indians who also carved elaborate deer masks and wore deer skins [9, 10], but their impact on the species' population size and distribution is unknown. It was still common when European colonists arrived in the 16th century.
The first written description of the Key deer comes from the diary of Hernando d’Escalante Fontaneada, who in 1549, at the age of 13, shipwrecked in the Keys and was taken captive by the Calusa for 17 years [10]. He did not complain of his treatment, but spoke highly of raccoons, “fat and good to eat…infinite quantities of eels, very savory…nearly the size of a man, thick as the thigh…[and]…enormous trout.” He was less pleased with the eating of “snakes, and animals like rats, which live in the lake, fresh-water tortoises, and many more disgusting reptiles which, if we were to continue enumerating, we should never be through.” He reserved highest praise for the numerous Key deer: “But what was a great wonder to the captives who were there, and to those of us in other places, was the existence of deer on the Islands of Cuchiyaga.”
The tiny Key deer were subsequently hunted by waves of European explorers, slavers, raiders and settlers over the next 400 years. It is not known when the deer became endangered, but by the 1920s it was approaching extinction.
In the 1930s, Pulitzer prizing-winning cartoonist “Ding” Darling witnessed a gruesome hunt in which the forests of a small key were set afire, driving the deer onto the beach where they were shot from foot and boat [17]. He sketched the scene on the spot and in 1934 syndicated it across the country in a political cartoon entitled: “The smallest species of deer in North America, alone, unguarded and on the way out!” [11]. Subtitled “The Last of the ‘Toy’ Deer of the Florida Keys.”
Earlier that year, President Franklin D. Roosevelt had appointed Darling chief of the U.S. Bureau of Biological Survey, though the latter was a Republican, a bitter critic of the New Deal, and completely lacking in management experience. This perhaps seemed fitting for an agency Darling described as an “orphan child, without asylum, that has subsisted on crumbs the neighbors sent in.” He changed all that in his brief, 20-month tenure. Stepping on toes of all denominations and robbing other agencies’ budgets (using, he said, “a straw to suck funds from the other fellow’s barrel”), Darling solidified the national wildlife refuge system with 3 million acres of new additions and created the Federal Duck Stamp program (drawing the first stamp himself), which has since raised $700 million for wetlands protection. Darling resigned in 1935 over a gun-tax dispute, and in 1936 founded the National Wildlife Federation (then called the General Wildlife Federation). In 1940, the much-strengthened and enriched BBS became the U.S. Fish and Wildlife Service that today has jurisdiction over the Key deer.
Darling was a household name in 1930s America, and the syndication of “Alone, unguarded and on the way out!” drew an enormous public outcry, leading to a state ban on Key deer hunting in 1939. The cartoonist-cum-bureaucrat saved the Key deer from extinction, but not without the help of a former funeral home director and ambulance driver known as “the John Wayne of the Florida Keys” as well as an 11-year-old boy scout.
Big Pine and No Name keys were remote and wild in the 1940s. Lacking a warden to enforce the hunting ban, poachers continued to shoot enough deer to keep the Key deer at extinction's edge. Thus in late 1940s or early 1950s, the U.S. Fish and Wildlife Service, with help from the Boone & Crockett Club, hired Jack C. Watson to patrol a million acres by boat, car, motorcycle and foot in search of deer poachers [12, 16].
Watson was a big, imposing man, rarely seen without a pistol on his hip. He packed a Thompson submachine gun in the trunk of the white Cadillac [15]. Finding a poacher’s car, Watson would leave a polite note explaining that hunting of Key deer is illegal and pump a few rounds into the gas tank or the engine [14]. He once set fire to a poacher's boat, stranding the men overnight on a mosquito-infested key [13]. The next day he offered them a ride out, but only on the promise never to hunt key deer again. Bitten by a rattlesnake while in hot pursuit, he cut a hunk of flesh from his derriere, caught the poachers and turned them in before going to a doctor [12].
Taking a different approach, 11-year-old Glenn Allen, a Boy Scout in Miami, Fla., wrote a letter to President Truman in 1947 asking him to establish a national wildlife refuge to save the Key deer [8]. Letters followed to Congress and President Eisenhower. Boy Scout troops across the country took up the cause; environmental groups and the Fish and Wildlife Service joined in [18]. Soon the Key deer was a national concern again.
In response to the intense pressure, Congress passed the Key Deer Refuge Bill in 1957 over the objections of Florida congressmen who asserted that the Key deer did not exist [19], creating the National Key Deer Refuge on Big Pine Key [8]. The refuge protects about 8,600 acres of deer habitat, including 2,280 acres of federally designated wilderness.
Though lacking a college degree, the gun-toting Watson became its first director and remained so until 1975 [16]. Due to the refuge and Watson’s relentless enforcement of the hunting ban, the Key deer population increased from about 50 in the 1930s and 40s, to 400 by the late 1960s. It was listed as an endangered species in 1967.
The Key deer declined again to about 200 by 1971, then increased to 646 in 2001 [20, 21, 23]. More recent population estimates are not available, but as transects show a steady increase in deer on Big Pine Key and No Name Key (which contain 75 percent of the subspecies) between 1982 and the last available data in 2006, and deer have been reintroduced to or recolonized other keys, we estimate the 2011 population to exceed 800.
CURRENT DISTRIBUTION
As of 2010, the Key deer occurred on approximately 26 islands within 11 island complexes, from Johnson to Sugarloaf keys [20]
Big Pine and No Name keys constitute the core Key deer populations as defined by the U.S. Fish and Wildlife Service [20]. They support about 75 percent of the total population (Big Pine 60 percent, No Name 15 percent) [21]. Deer on these islands appear to have adapted well to human population increase. The deer population increased 240 percent between 1971 and 2001 (200 to 453–517), while the human population on Big Pine increased from 500 to 5,000 [21]. Compared to 1971, deer in 2001 appeared in developed areas more often, included more developed areas in home ranges, selectively foraged to a greater degree in developed area, had smaller ranges, and weighed more.
Non-core populations, as defined by the Fish and Wildlife Service, occur on four keys close to Big Pine and No Name and five outer keys [20]. The populations on at least two of the keys (Cudjoe and Sugarloaf) were recently introduced by the Service.
Torches/Ramrod Keys 2001-2005 population: 94
Cudjoe Key 2001-2005 population: 6
Sugarloaf Key 2001-2005 population: 6
Knockemdown/Summerland Key 2001-2005 population: 8
Annette Key 2001-2005 population: 6
Howe Key 2001-2005 population: 16
Big Johnson Key 2001-2005 population: 0
Little Pine Key 2001-2005 population: 16
Newfound Harbor 2001-2005 population: 10
THREATS
The single-greatest cause of Key deer mortality is car collisions: 50 percent of identified deaths between 1968-1972 and 1998-2000 were car accidents [20]. Car collisions are concentrated along U.S. Highway 1 on Big Pine, Little Torch and Ramrod keys; on Key Deer Boulevard and Watson Boulevard leading to No Name Key; and on residential roads on Big Pine Key. Collision deaths are most common in southern Big Pine Key due to its lower quality and quantity of habitat, greater habitat fragmentation and greater “urbanization” as measured by highway length, road length, fenced areas, developed land and traffic density on U.S. Highway 1 [20, 22].
Other causes of death included disease, dogs, entanglement, poaching and combat with other deer [22]. Entanglement deaths (predominately on fences) increased from 0-7.9 percent and disease from 0-5.3 percent between 1971 and 2000. Drowning decreased from 9.6-2.6 percent.
Overall mortality rates are highest on southern Big Pine Key (which is currently a deer sink), intermediate on northern Big Pine Key (currently a source), and lowest on No Name Key [22].
To reduce car collisions, in 2002 the Florida Department of Transportation constructed a 1.6-mile system of fencing, two underpasses and four experimental deer guards on a section of U.S. Highway 1 [22]. In the following four years, Key deer mortality declined 83-92 percent in the project area: from 12-24 per year pre-construction to two in 2003, one in 2004, zero in 2005 and three in 2006. However, mortality increased on the highway outside the project area, raising concern that the overall effect was not necessarily positive.
Global warming, however, is an escalating threat. Being relatively flat, the Florida Keys are very vulnerable to sea-level rise. The Key deer's pine rockland community has already been reduced by rising ocean levels and recent models predict that 59,000 to 154,000 acres of the Keys may be inundated by 2100, including 11-96 percent of the Big Pine Key’s pine forest and hardwood hammocks [20]. Sea-level rise will also eliminate many Key deer watering holes and redistribute those that survive.
CITATIONS
[1] U.S. Fish and Wildlife Service. 1999. South Florida Multi-Species Recovery Plan. United States Fish and Wildlife Service, Atlanta, GA.
[2] Lopez, R.R. 2001. Population ecology of the Florida Key deer. Ph.D. Dissertation. Texas A&M University, College Station. 202 pp.
[3] U.S. Fish and Wildlife Service. 1990. Key deer (Odocoileus virginianus clavium) in Endangered and Threatened Species of the Southeastern United States. U.S. Fish and Wildlife Service website (http://www.fws.gov/endangered/i/a/saa09.html).
[4] NatureServe. 2005. NatureServe Explorer: An online encyclopedia of life [web application]. Version 4.5. NatureServe, Arlington, Virginia. Available http://www.natureserve.org/explorer. (Accessed: September 16, 2005 ).
[5] Lopez, R.R. 2004. Population density of the endangered Florida Key deer. Journal of Wildlife Management 68(3):570-575.
[6] U.S. Fish and Wildlife Service. 2008. Key Deer Fact Sheet. Available online at http://www.fws.gov/home/dhoilspill/pdfs/DHR_U.S. Fish and Wildlife Service_NationalKeyDeer_NWR_fs.pdf, accessed September 26 2011.
[7] Dickson, J.D. III. 1955. An ecological study of the Key deer. Florida Game and Fresh Water Fish Commission, Technical Bulletin 3, Tallahassee, Florida, USA.
[8] Frank, P.A., B.W. Stieglitz, J. Slack, and R.R. Lopez. 2003. The Key deer: Back from the brink. Endangered Species Bulletin, January/February 2003 XXVIII(1):20-21.
[9] Pickett, M.F. and D.W. Pickett. 2011. The European struggle to settle North America: Colonizing attempts by England, France and Spain, 1521-1608. McFarland & Co. (Jefferson, N.C.). See also Nicholls, S. 2009. Paradise Found: Nature in America at the Time of Discovery. University of Chicago Press (Chicago).
[10] D'Escalante Fontaneda, H. 1575. Memoir. Available at http://www.keyshistory.org/Fontenada.html
[11] Darling, D.J. 1934. The smallest species of deer in North America, alone, unguarded, and on the way out! Editorial cartoon available at http://digital.lib.uiowa.edu/u?/ding,11342
[12] Clark, C. Federal lawman saved the Key deer. Miami Herald available at
http://www.machinegunboards.com/forums/index.php?showtopic=8875
[13] Sanders, K. 2007. Oh deer! MSNBC News, November 26, 2007. Available at http://dailynightly.msnbc.msn.com/_news/2007/11/26/4372454-oh-deer?lite
[14] Associated Press. 2007. Key deer bounce back from the brink: A refuge manager is remembered 50 years after the dog-sized deer almost disappeared. November 18, 2007. Available at http://www.sptimes.com/2007/11/18/news_pf/State/Key_deer_bound_back_f.shtml
[15] Ocala Star-Banner. 1988. Hope dwindling for survival of Key deer. November 20, 1988. http://news.google.com/newspapers?nid=1356&dat=19881120&id=kcBPAAAAIBAJ&sjid=yQYEAAAAIBAJ&pg=6718,1751598
[16] U.S. Fish and Wildlife Service. 2011. A Look Back ... Jack Watson. Refuge Update September/October 2011. Available at http://www.fws.gov/refuges/RefugeUpdate/SeptemberOctober_2011/alookback.html
[17] Lendt, D.L. 1989. Ding: The Life of Jay Norwood Darling. Iowa State University Press, Heritage Collection. Iowa Heritage Edition, Original edition, Iowa State University Press, 1979.
[18] Clark, M.G. 1979. Save the Florida Key Deer.
[19] Associated Press. 1975. Committee Ok's bill for key deer. August 1, 1957. Available at http://news.google.com/newspapers?nid=2206&dat=19570801&id=iJRkAAAAIBAJ&sjid=0GcNAAAAIBAJ&pg=3097,301245
[20] U.S. Fish and Wildlife Service. 2010. Key deer (Odocoileus virginianus clavium) 5-Year Review: Summary and Evaluation.
[21] Harveson P.M., R.R. Lopez, B.A. Collier, and N.J. Silvy. 2007. Impacts of urbanization on Florida Key deer behavior and population dynamics. Biological Conservation 134:321-331.
[22] Kimley-Horn and Associates. 2011. National Key Deer Refuge Transportation Study: Traffic Needs and Safety Report. Contract No: DTFH71-09-D-00001. U.S. Department of Transportation, Federal Highway Administration Eastern Federal Lands Highway Division in cooperation with the U.S. Fish and Wildlife Service. Available at http://www.efl.fhwa.dot.gov/files/projects/environment/National-Key-Deer/NKDR_Final_Transportation_Study_Report.pdf
[23] Lopez, R.R. 2007. Key Deer and Pine Rocklands: A Historical Perspective.
Ozark big-eared bat (Corynorhinus townsendii ingens)
| Status: Endangered | Critical habitat: none | Listed: 11/30/1979 | Recovery plan: 3/28/1995 |
Range: AR(b), OK(b) --- MO(x)
SUMMARY
Ozark big-eared bats are threatened by human population growth, development and potentially by the spread of white-nose syndrome. At the time of listing in 1979, 100-200 bats were known. The population increased dramatically and was stable at 1,600-2,000 between 1987 and 2008. Populations at four of 20 essential sites are known to be increasing; others are stable or unknown.
RECOVERY TREND
The Ozark big-eared bat (Corynorhinus townsendii ingens) inhabits caves and cliffs in Ozark forests [1]. Maternity caves and hibernacula occur in diverse areas, from large blocks of forest to small forest tracts interspersed with open areas. Maternity colonies are in cooler portions of caves from mid-April to late July. Solitary males usually occur in caves, talus cracks and cliff overhangs during summer. Both sexes hibernate at cold locations in cold caves during winter months. The species currently occurs in eastern Oklahoma and northwest and north-central Arkansas. It is extirpated from southwest Missouri.
When listed as an endangered species in 1979, the population was estimated at 100-200 bats [1]. Since then, additional maternity colonies and hibernacula have been located, and occupied caves have been given greater protection. The Oklahoma Bat Cave National Wildlife Refuge was established in 1985 and the Ozark Plateau National Wildlife Refuge in 1986. Other important caves have been protected by The Nature Conservancy, the National Speleological Society and state agencies in Oklahoma and Arkansas. The population appears to have grown by an unknown degree between 1979 and 1987, then remained relatively stable between 1987 and 2004, with estimates from eight of 11 years censused during this period showing between 1,600 and 2,000 bats [1, 2, 3]. In 2008 the population was estimated at 1,900 bats, 1,300 in Oklahoma and 600 in Arkansas.
The 1995 recovery plan identified 14 caves considered to be essential (i.e., used as a maternity site and/or hibernacula) to the continuing existence of the species. Six additional sites have been located since then, for a current total of 20 known essential sites. For the 2008 Five-Year Review, Mann-Kendall tests were used to determine if populations at each essential site showed a significant trend over the past 10 years. A significant increasing population trend was found at only four of 15 essential sites. Due to variability in the data from all other sites, no significant trends could be determined.
The Ozark big-eared bat was probably never very common. The species is intolerant of human disturbance, which causes it to abandon favorite roosts. Disturbance of hibernating bats causes them to use valuable fat stores and increases the probability of starvation during the winter. Disturbance of maternity colonies can cause significant mortality of the young. Emergent counts for the OBEB reveal a disparity between summer and winter population estimates. This indicates there are likely major hibernacula that have not yet been located. Evidently, Ozark big-eared bats are using caves that have not been found. Thus, threats to unknown caves remain a concern.
White-nose syndrome is a recent and potentially devastating threat to the Ozark big-eared bat. The primary agent of concern is a white fungus (Geomyces destructans) that thrives in the cold and humid conditions characteristic of caves. Affected bats have the fungus growing around their nose and other parts of their body. It was first observed in four caves in New York during the winter of 2006-2007 and has since spread rapidly throughout the eastern states, reaching reached Oklahoma in 2010 where it was found on cave myotis bats. As of 2011, the fungus has killed approximately 6,000,000 bats in the United States. It is not yet know whether the Ozark big-eared bat is susceptible to it.
In its 2008 Five-Year Review, the U.S. Fish and Wildlife Service determined that the Ozark big-eared bat continues to meet the definition of endangered, even though significant recovery accomplishments have occurred since listing. Recovery criteria to downlist the species to threatened status have not yet been fully met. Based on population and distribution information and known geological formations, there are evidently essential sites that have not been discovered. Moreover, the human population in the Ozarks is rapidly increasing. As more people occur in the area and cave sites become less remote due to development, human entry and disturbance at essential sites likely will increase. Fragmentation and loss of foraging habitat due to development also remains a major threat. Therefore, the vulnerability of the species to extinction remains high because of its small population size, reduced and limited distribution, and susceptibility to human disturbance.
CITATIONS
[1] U.S. Fish and Wildlife Service. 1995. Ozark Big-Eared Bat Corynorhinus townsendii ingens (Handley) Revised Recovery Plan. Tulsa, OK.
[2] Harvey, M.J., R.K. Redman and C.S. Chaney. Endangered Bats of Arkansas: Distribution, Status and Ecology (2003-2004). Annual Report to Arkansas Game and Fish Commission, Project Number W-56-R.
[3] Currie, R. 2000. Federally listed threatened and edangered species of concern to mining. Paper presented at Bat Conservation and Mining: A Technical and Interactive Forum, November 14-16, St. Louis, MO.
[4] Arkansas Game and Fish Commission Strategic Non-game Management Plan. 2001. Prepared by the Nongame Mammal Team, Wildlife Management Division, and Arkansas Game and Fish Commission. See http://www.agfc.state.ar.us/pdf/critters/nongame_mammal_2001.pdf
[5] U.S. Fish and Wildlife Service. 2008. Ozark Big-Eared Bat (Corynorhinus townsendii ingens) 5-Year Review: Summary and Evaluation. Oklahoma Ecological Services Field Office, Tulsa. 44 pp.
[6] Graening, G.O., M.J. Harvey, W.L. Puckette, R.C. Stark, D.B. Sasse, S.L Hensley and R.K. Redman. 2011. Conservation status of the endangered Ozark big-eared bat (Corynorhinus townsendii igens) – A 34-year assessment. Publications of the Oklahoma Biological Survey 2(11):1-16. Available at http://digital.library.okstate.edu/obs/obsv11p001.pdf.
| Status: Endangered | Critical habitat: none |
| Listed: 3/11/1967 | Recovery plan: 10/26/1990 |
Range: FL(b), MS(b), NC(b), SC(b), TN(b) --- AL(x), AR(x), DE(x), DC(x), GA(x), IL(x), IN(x), KY(x), LA(x), MD(x), MO(x), OH(x), OK(x), PA(x), TX(x), VA(x), WV(x)
SUMMARY
Red wolves were decimated by habitat loss and shooting. From a population of only 17 red wolves in 1980, captive breeding and release to the wild have resulted in a total population of 300 in 2011.
RECOVERY TREND
The red wolf (Canis rufus) was once found throughout forested regions from southern New England to the Gulf Coast [1]. By 1920, it was extirpated from the southern Atlantic states [1]. By 1970 the population had declined to fewer than 100 wolves and was confined to a small area of coastal Texas and Louisiana [1]. These declines were the result of aggressive predator-control programs and the loss of forest habitat [1].
Early recovery attempts were largely unsuccessful, and as the last red wolf population continued to decline, remaining individuals began mating with coyotes [2]. The number of genetically pure red wolves decreased, further contributing to the species’ decline [2]. In a final attempt to save the species, 17 genetically pure red wolves were captured for captive-breeding efforts [1]. The red wolf captive-breeding program established at the Point Defiance Zoo and Aquarium in Tacoma, Wash., was able to successfully breed 14 of the original wolves, and the first reintroduction occurred in 1978 on Bulls Island off the coast of South Carolina [1].
In 1980, the last remaining wild red wolves were brought into captivity and the species was declared extinct in the wild [2]. The captive-breeding program continued, however, and has now expanded to include 38 zoos and nature centers in 23 states [1]. In 1988 the first wild-born litter since reintroductions began was found at Alligator River National Wildlife Refuge, North Carolina [1]. In 2011 the total population, including wild and captive wolves, was estimated at 300 [3].
Red wolves have now been reintroduced into areas in North and South Carolina, Great Smoky Mountains National Park, and on three islands off the Atlantic and Gulf Coasts [2]. Introductions to the coastal islands have acted as a stepping stone between captivity and the wild; although the islands are too small to support wolf populations, they provide an opportunity for the wolves to breed and exist in the wild and to produce animals for future mainland reintroductions [1]. In 2003, approximately 100 red wolves existed in the wild, with another 157 held in captive-breeding facilities (this includes two island propagation programs). In 2004, 11 of 22 packs had created dens [2].
CITATIONS
[1] U.S. Fish and Wildlife Service. 2004. Alligator River National WIldlife Refuge: Red Wolf Re-establishment Program. Website <http://www.outer-banks.com/alligator-river/redwolf.asp>.
[2] International Wolf Center. 2006. Timeline: The Red Wolf in the Southeastern United States. Website <http://www.wolf.org/wolves/learn/basic/history/red_timeline.asp>.
[3] U.S. Fish and Wildlife Service. 2011. Red Wolf Recovery Program. Available online at http://www.fws.gov/redwolf/index.html. Accessed September 28, 2011.
San Miguel island fox (Urocyon littoralis littoralis)
| Status: Endangered | Critical habitat: 11/9/2005 | Listed: 3/5/2004 | Recovery plan: none |
Range: CA
SUMMARY
The San Miguel Island fox occurs only on San Miguel Island off the Southern California coast. It is threatened by disease from domestic dogs and predation by golden eagles. The population declined catastrophically from 450 in 1994 to 15 in 1999. Following listing in 2004, measures such as captive breeding, relocation of golden eagles and introduction of bald eagles allowed the population to grow to 393 in 2011.
RECOVERY TREND
The San Miguel Island fox (Urocyon littoralis littoralis) is one of six island fox subspecies endemic to each of the six Channel Islands off the coast of Southern California [1]. It declined from around 450 adults in 1994 to 15 in 1999 [2]. The National Park Service initiated emergency measures to save the fox in 1999, and in 2004 the species was listed as endangered [1]. In 2000, all but one of the wild foxes were brought into captivity to initiate a captive-breeding program [2]. By 2003, no wild foxes remained. By 2005, there were 40 wild and 26 captive foxes.
Predation by golden eagles was determined to be the primary cause behind the decline [1]. Prior to the 1990s, golden eagles did not occur on the Channel Islands; possibly because they were kept away by bald eagles native to the islands. Declines in bald eagle populations, however, and the introduction of feral pigs to the islands (providing a prey base for the golden eagle) may have led to colonization by golden eagles. Golden eagle removal efforts and reintroduction of bald eagles to the island have allowed the fox population to increase. The population of San Miguel island foxes reached 393 in 2011 [3].
CITATIONS
[1] National Park Service. Island Fox recovery Program 2004 Annual Report. Channel Islands National Park, Technical Report 05-07.
[2] Coonan, T. 2006. Year-end population data for three island fox subspecies, 1994-2005. Spreadsheet provided by Tim Coonan, Channel Islands National Park, May 8, 2006.
[3] Coonan, T. 2011. Personal Communication, Population of San Miguel and Santa Rosa Island Foxes.
Santa Catalina island fox (Urocyon littoralis catalinae)
| Status: Endangered | Critical habitat: 11/9/2005 | Listed: 3/5/2004 | Recovery plan: none |
Range: CA
SUMMARY
The Santa Catalina island fox is endemic to Santa Catalina Island, where it is threatened by canine distemper, predation by feral cats and car collisions. At the time of listing in 2004, there were around 300 Santa Catalina Island foxes. Captive breeding and other conservation efforts allowed the population to increase to 1,542 as of 2012.
RECOVERY TREND
The Santa Catalina island fox (Urocyon littoralis catalinae) is found only on Santa Catalina Island, off the California coast [1]. It weighs 4 to 6 pounds, and is primarily monogamous, living about 10 years and having litters of two to three pups [2]. As a result of introduced canine distemper virus, the population plummeted in the 1990s, dropping as low as 100 in 1999. Conservation efforts, including distemper vaccinations, captive breeding and release, relocation and wild fox population monitoring were initiated [2]. The fox was listed as endangered in 2004, when its population was around 300 [2]. Captive breeding was discontinued at about that time.
Conservation efforts since listing have been very successful, with the population reaching 1,008 in 2010 [2] and 1,542 in early 2012 [1]. Current management includes trapping, inspection for illnesses, vaccination against distemper and rabies, telemetry collaring and monitoring, and regulating traffic speed [1]. A worrying trend of ear cancer has arisen, and vehicle mortality continues to be a concern [2].
CITATIONS
[1] Sahagun, L. January 19, 2012. Catalina Island fox makes astounding comeback. Los Angeles Times. Available online at http://www.latimes.com/news/local/la-me-fox-20120119,0,6967247.story.
[2] Cataliina Island Conservancy. 2010. Recovery of the Catalina Island Fox. Available online at http://www.catalinaconservancy.org/index.php?s=wildlife&p=recovery_of_the_catalina_island_fox. Accessed January 29, 2012.
Santa Cruz island fox (Urocyon littoralis santacruzae)
| Status: Endangered | Critical habitat: 11/9/2005 | Listed: 3/5/2004 | Recovery plan: none |
Range: CA
SUMMARY
The Santa Cruz island fox occurs only on Santa Cruz Island off the California coast. It is threatened by disease from domestic dogs and predation by golden eagles. The population declined from 1,465 in 1994 to just 60 in 2001, leading to the fox's protection in 2004. Due to captive breeding, relocation of golden eagles and introduction of bald eagles, the population grew to 1,302 in 2011.
RECOVERY TREND
The Santa Cruz fox (Urocyon littoralis santacruzae) is one of six island fox subspecies endemic to each of the six large Channel Islands off the coast of Southern California. It declined catastrophically from 1,465 animals in 1994 to 135 in 1999 and 60 in 2001 [2]. The National Park Service initiated emergency measures to save it in 1999, and in 2004 it was listed as an endangered species [1]. Twenty foxes were brought into captivity in 2002 and a captive-breeding program was initiated. By 2005, there were 150 wild and 62 captive foxes [2].
The primary cause of decline was predation by golden eagles [1]. Prior to the 1990s, golden eagles did not occur on the Channel Islands, possibly because they were kept away by nesting bald eagles. The extirpation of the bald eagle and the introduction of feral pigs to the islands (providing a prey base for the golden eagle) may have led to colonization of the islands by golden eagles. As of 2004, 37 golden eagles had been removed from Santa Cruz Island and efforts to remove them continue. Bald eagles have also been relocated onto the island. Conservation efforts have proven very successful, with the population growing to 1,302 Santa Cruz Island foxes in 2011 [3]. The captive breeding program ended in 2007.
CITATIONS
[1] National Park Service. Island Fox recovery Program 2004 Annual Report. Channel Islands National Park, Technical Report 05-07.
[2] Coonan, T. 2006. Year-end population data for three island fox subspecies, 1994-2005. Spreadsheet provided by Tim Coonan, Channel Islands National Park, May 8, 2006.
[3] Boser, C. 2011. Personal communication, Santa Cruz Island Fox Population Estimate.
Santa Rosa island fox (Urocyon littoralis santarosae)
| Status: Endangered | Critical habitat: 11/9/2005 | Listed: 3/5/2004 | Recovery plan: none |
Range: CA
SUMMARY
The Santa Rosa island fox occurs only on Santa Rosa Island off the Southern California coast. It is threatened by disease from domestic dogs and predation by golden eagles. The population declined dramatically from 1,780 in 1994 to 14 in 1999. Listing in 2004 and ensuing conservation measures allowed the population to increase to 280 as of 2011.
RECOVERY TREND
The Santa Rosa island fox (Urocyon littoralis santarosae) is one of six island fox subspecies endemic to each of the six large Channel Islands off the coast of Southern California. It declined catastrophically from 1,780 animals in 1994 to 14 in 1999 [2]. The National Park Service initiated emergency measures to save it in 1999, and in 2004 it was listed as an endangered species [1]. The 14 remaining wild foxes were brought into captivity in 2000 (leaving none in the wild) and a captive breeding program was initiated. The subspecies was reintroduced to the wild in 2003, and by 2005 there were 32 wild and 34 captive foxes [2].
The primary cause of decline was predation by golden eagles that moved onto the island following the extirpation of bald eagles, which chase away golden eagles [1]. The introduction of feral pigs also provided a prey base that allowed golden eagles to move onto Santa Rosa Island. Golden eagle removal efforts and bald eagle introduction efforts allowed the Santa Rosa Island fox to begin to recover. As of 2011 there were 280 foxes in the population [3].
CITATIONS
[1] National Park Service. Island Fox recovery Program 2004 Annual Report. Channel Islands National Park, Technical Report 05-07.
[2] Coonan, T. 2006. Year-end population data for three island fox subspecies, 1994-2005. Spreadsheet provided by Tim Coonan, Channel Islands National Park, May 8, 2006.
[3] Coonan, T. 2011. Personal Communication, Population of San Miguel and Santa Rosa Island Foxes.
Southern sea otter (Enhydra lutris nereis)
| Status: Threatened | Critical habitat: none | Listed: 1/14/1977 | Recovery plan: 4/3/2003 |
Range: CA(b) ---
SUMMARY
Southern sea otters were nearly hunted to extinction by the fur industry in the 19th and early 20th centuries. Today they are threatened by shark attacks, disease, pollution, oil spills, climate change and possibly ocean acidification. In 1976, just 1,789 sea otters remained. Following its listing as a threatened species in 1977, the sea otter increased to about 2,700 in 2005 and remained around this level through 2010. Its recovery goal is 3,090 otters averaged over three years.
RECOVERY TREND
The southern sea otter (Entydra lutris nereis) is found in shallow waters along the coast of central and southern California from Half Moon Bay to Point Conception [1].
A century ago otters were abundant, but by 1914, hunting by fur traders had reduced the population to 50 animals [1]. Passage of the International Fur Seal Treaty in 1911 protected remaining sea otters from further hunting, but by then, their distribution had become highly fragmented. It was placed on the endangered species list in 1977.
The southern sea otter continued to decline for six years after being listed as an endangered species, then increased relatively steadily from 1984 through 2005 [2]. Between 2005 (2,735 otters) and 2010 (2,719 otters), the population remained relatively stable [2], but about 400 otters below its recovery goal of 3,090 averaged over three years [1, 3].
Recent reproduction rates are similar to those of the past and are sufficient to have kept the otter on an increasing population trend between 2005 and 2010 [3]. The population remained flat because of increased mortality, especially among adults and subadults. The primary causes of mortality are shark attacks [4] and infectious diseases [3], which have been attributed to immune deficiencies, elevated parasite loads, pathogen exposure, and reduction in food resources in parts of the otter's central California range. Persistent organic pollutants and low genetic diversity may be contributing to otter immuno-suppression.
Otter also remain vulnerable to oil spills [3] and may be affected by declines in shell fish due to ocean acidification.
CITATIONS
[1] U.S. Fish and Wildlife Service. 2003. Final Revised Recovery Plan for the Southern Sea Otter (Enhydra lutris nereis). U.S. Fish and Wildlife Service, Portland, Oregon. Xi+pp.
[2] U.S. Geological Survey. 2011. California Sea Otter Survey Data website http://www.werc.usgs.gov/ProjectSubWebPage.aspx?SubWebPageID=4&ProjectID=91
[3] U.S. Fish and Wildlife Service. 2010. Southern Sea Otter Spotlight Species Action Plan 2010-2014. Available at www.fws.gov/ecos/ajax/docs/action_plans/doc3186.pdf
[4] U.S. Geological Survey. 2012. Number of Dead California Sea Otters Recovered in 2011 a Record High: Evidence Builds for White Shark Factor in Otter Mortalty. February 24, 2012 press relsease. http://www.usgs.gov/newsroom/article.asp?ID=3116#.T62tfujE_mc.
Steller sea-lion (eastern DPS) (Eumetopias jubatus (eastern DPS))
| Status: Endangered | Critical habitat: 8/27/1993 | Listed: 4/5/1990 | Recovery plan: 2/29/2008 |
Range: AK, CA, OR, WA
SUMMARY
The Steller sea-lion (eastern DPS) declined due to exploitation, predator control and prey base declines. These threats substantially declined following its listing as an endangered species in 1990 and designation of critical habitat in 1993. Its population increased about 21,000 animals in 1989 to 63,488 in 2009. In 2012 it was proposed for delisting due to high total numbers, but California trends remain weak, and the southernmost portion of its range has not been reoccupied.
RECOVERY TREND
The Steller sea lion (Eumetopias jubatus) is the largest of the eared seal family and occurs across the North Pacific Ocean rim from Japan to California [1]. The entire species was listed as threatened under an emergency rule in 1990 following an 82-percent decrease from 1960 population levels [2]. The factors behind population decline were a reduction in prey biomass and quality due to commercial fishing and oceanographic variability, and killer whale predation [1].
Due to differences in genetics and population trends, the Steller sea lion was separated into eastern and western distinct population segments (DPS) in 1997 for purposes of management by the National Marine Fisheries Service [1]. The eastern DPS of the Steller sea lion is considered to occur east of 144° W. longitude and extends east to British Columbia and south to California [1].
The eastern DPS of Steller sea lion was subject to substantial commercial exploitation and both sanctioned and unsanctioned predator control prior to the enactment of protective legislation in the 1970s in the U.S. and Canada [3]. Endangered Species Act protection in 1990 helped the sea lion move towards recovery, and in 2008 the federal recovery team determined that the eastern DPS appeared to have recovered from factors causing its decline [1]. In April 2012, the Fisheries Service published declaring the eastern Steller sea-lion recovered and removing it from the endangered species list [5].
Within the eastern DPS, 13 rookeries and about 85 major haulout sites are known from Cape Fairweather (58.8°N, 137.9°W ) to Año Nuevo Island (37.1°N, 122.3°W). Populations associated with 12 of these rookeries have either increased or stabilized at relatively high levels in recent years [1]. The population trend of the eastern DPS has been monitored by geographic regions, including southeast Alaska, British Columbia, Oregon and California. Because Steller sea lions range widely, estimates for a geographic area represent the number of animals supported by rookeries and not the exact numbers of animals present in the area. The populations in southeast Alaska, British Columbia and Oregon have more than doubled since the 1970s [1]. In southeast Alaska, counts of non-pups (adults and juveniles) increased from 5,585 in 1979 to 10,527 in 2005. In southeast Alaska, pup counts increased from 5,510 in 2005 to 7,443 in 2009 [4]. In British Columbia, non-pup counts increased from 4,617 in 1971 to 12,121 in 2002. In Oregon, non-pup counts increased from 1,461 in 1977 to 4,169 in 2002.
Overall, the DPS is estimated to have increased from 18,040 individuals in 1979 to 63,488 in 2009 [5].
Recovery in California has lagged behind the rest of the DPS [5]. California has experienced markedly different population trends at various rookeries and haulouts, with most sites at population levels substantially less than those of the early 1900s, yet apparent population stability in the last decade [1]. The sea-lion has not recolonized the southernmost portion of its range at San Miguel Island rookery. Factors impeding full recovery in California likely include a climate induced northward range shift, competition for space on land at haulouts and rookery sites, and possibly competition for prey with other more temperately adapted pinniped species such as California sea lions and northern elephant seals [5].
Factors that may continue to affect the eastern DPS include predation, reduced prey biomass and quality, toxic substances, global climate change and ocean acidification.
CITATIONS
[1] National Marine Fisheries Service. 2008. Revised Recovery Plan for the Steller sea lion (Eumetopias jubatus) Eastern and Western Distinct Population Segments. National Marine Fisheries Service, Silver Spring, MD. 325 pages.
[2] National Marine Fisheries Service. 1990. Listing of Steller Sea-lions as Threatened under the Endangered Species Act with Protective Regulations. April 5, 1990. 55 FR 12645.
[3]Pitcher, K. W., P. F. Olesiuk, R. F. Brown, M. S. Lowry, S. J. Jeffries, J. L. Sease, W. L. Perryman, C. E. Stinchcomb, and L. F. Lowry. 2006. Status and trends in abundance and distribution of the eastern population of Steller sea lion (Eumetopias jubatus). Fisheries Bulletin.
[4] National Marine Fisheries Service. 2010. 90-Day Finding on Petitions To Delist the Eastern Distinct Population Segment of the Steller Sea Lion. Dec. 13, 2010. 75 FR 77602.
[5] National Marine Fisheries Service. 2012. Proposed Delisting of Eastern DPS of Steller Sea Lions. April 18, 2012. 77 FR 23209.
Steller sea-lion (western DPS) (Eumetopias jubatus (western DPS))
| Status: Endangered | Critical habitat: 8/27/1993 | Listed: 4/5/1990 | Recovery plan: 2/29/2008 |
Range: AK(b) ---
SUMMARY
The Steller sea lion is threatened by loss of its prey base to unsustainable commercial fisheries, predation, toxins and global climate change. It declined in every count from 1970-2000 but increased in 2002-2004 as fishing restrictions took effect. As of 2008 the Alaska population was estimated at 45,000, which is 15,000 more animals than at the time of listing in 1990.
RECOVERY TREND
The western population of the Steller sea lion (Eumetopias jubatus) occurs in Alaska and Russia where it is threatened by unsustainable commercial fisheries that compete for its food source [1]. It was listed as a threatened species in 1990 under an emergency rule [3], a recovery plan was prepared in 1992 [1], critical habitat was designated in 1993 [4], and it was uplisted to "endangered" in 1997 due to continued declines [5].
The western distinct population segment of Steller sea lions decreased from 220,000 to 265,000 animals in the late 1970s to fewer than 50,000 in 2000 [7]. In Alaska, its population declined steadily from 32,000 animals in 1989 to 18,325 in 2000, and in every count from 1970s and 2000 [2, 6]. Due to conservationist lawsuits, however, a series of extensive fishing restrictions were put in place between 1998 and 2000 to protect the sea lion's designated critical habitat [2]. The population subsequently increased for the first time since the 1970s to 19,340 in 2002, 20,600 in 2004, and 45,000 in 2008 [2, 6].
At the time of listing in 1990, there were 30,525 animals in the Alaska population. As of 2008, the total population size of western Steller sea lions in Alaska was estimated to be 45,000 animals. As of 2005, the Russian Steller sea lion population (part of the western DPS) was about 16,000 [7].
CITATIONS
[1] National Marine Fisheries Service. 1992. Recovery Plan for the Steller Sea Lion (Eumetopias jubatus). Silver Springs, MD.
[2] National Marine Fisheries Service. 2003. Supplement to the Endangered Species Act Section 7 Consultation Biological Opinion and Incidental Take Statement of October 2001 (concerning effect of Gulf of Alaska, Bering Sea/Aleutian Island fishing on Steller sea lions). Seattle, WA, June 19, 2003.
[3] National Marine Fisheries Service. 1990. Emergency Listing of the Steller Sea Lion. Federal Register, April 10, 1990 (55 FR 13488).
[4] National Marine Fisheries Service. 1993. Designated Critical Habitat; Steller Sea Lion. Federal Register, August 27, 1993 (58 FR 45269).
[5] National Marine Fisheries Service. 1997. Change in listing status of Steller sea lions under the Endangered Species Act. Federal Register, May 5, 1997 (62 FR 24345).
[6] Fritz, L. 2004. Western Steller Sea Lion Aerial Survey Results, June 2004. National Marine Fisheries Service, Seattle, WA, September 22, 2004. Availabe at <http://nmml.afsc.noaa.gov/AlaskaEcosystems/sslhome/survey2004.htm>.
[7] National Marine Fisheries Service. 2008. Revised Recovery Plan for the Steller sea lion (Eumetopias jubatus) Eastern and Western Distinct Population Segments. National Marine Fisheries Service, Silver Spring, MD. 325 pages.
Utah prairie dog (Cynomys parvidens)
| Status: Threatened | Critical habitat: none | Listed: 6/4/1973 | Recovery plan: 3/1/2012 |
Range: UT(b) ---
SUMMARY
The Utah prairie dog declined due to habitat loss to livestock and agriculture, a deliberate poisoning campaign, sylvatic plague and drought. Prairie dog population size increased from 3,300 individuals in 1972 to approximately 11,296 in 2010.
RECOVERY TREND
The Utah prairie dog (Cynomys parvidens) has the smallest and westernmost range of the five North American prairie dog species. It formerly occurred on 448,000 acres in southwest Utah [1]. Its range and numbers declined in response to habitat loss caused by livestock and agriculture, a deliberate poisoning campaign by and on behalf of the livestock industry, sylvatic plague, and drought. By 1995, it had been reduced to just 6,977 acres [1].
Poisoning of Utah prairie dogs by ranchers and the federal government began in the 1880s. A full-scale eradication program was launched in the 1920s [2]. Throughout the 1920s and 1930s, tens of thousands of acres were treated with poison each year. By the time sylvatic plague was first recorded in the population in 1937, it was already significantly depleted [2]. Poisoning programs continued into the 1950s and 1960s [1]. By 1972 the species had been reduced to just 3,300 individuals and was predicted to become extinct by 2000 [2]. It was placed on the federal endangered species list in 1973 and began improving almost immediately. The population was estimated at 9,332 individuals by 1981 [3]. The species was downlisted to threatened in 1984 [7]. Since then the population has experienced short-term upward and downward trends, but has increased overall.
By 2010 the estimated population had risen to 11,296 [6]. Sixty-eight percent of the populations occur on private lands where they are perceived to conflict with livestock grazing, agriculture and development [4].The primary management strategy before and after the 1991 federal recovery plan has been to relocate animals from conflicting private lands to locations on federal land that are at least one mile from the nearest private land border. An inter-agency recovery team declared in 1997 that the strategy was not working and was unlikely to ever result in the recovery of the species [4]. The team concluded that relocations often violated recovery plan habitat requirements, were not sufficiently monitored and had a poor success rate. The team called for intensive restoration efforts on public lands to better support relocated prairie dogs, a systematic research program, a management strategy based on meta-population dynamics, and improved management of private grazing lands.
CITATIONS
[1] Forest Guardians, Center for Native Ecosystems, Southern Utah Wilderness Alliance, Escalante Wilderness Project, Boulder Regional Group, and Terry Tempest Williams. 2005. Petition to the U.S. Fish and Wildlife Service to Reclassify The Utah Prairie Dog as an Endangered Species Under the Endangered Species Act, 16 U.S.C. § 1531 et Seq. (1973 as amended). Forest Guardians, Santa Fe, NM.
[2] U.S. Fish and Wildlife Service. 1991. Utah Prairie Dog Recovery Plan. U.S. Fish and Wildlife Service, Denver, CO
[3] Rosmarino, N. 2005. Utah prairie dog census data, 1976-2005. Forest Guardians, Santa Fe, NM.
[4] Utah Prairie Dog Implementation Team. 1997. Utah Prairie Dog Interim Conservation Strategy. National Park Service, U.S. Bureau of Land Management, USDA APHIS Wildlife Services, USDA Forest Service, U.S. Fish and Wildlife Service, Utah Division of Wildlife Resources, and Utah State University.
[5] U.S. Fish and Wildlife Service. 2010. Utah Prairie Dog (Cynomys parvidens) Draft Revised Recovery Plan. Denver, CO. 122 pp.
[6] U.S. Fish and Wildlife Service. 2011. Revised 90-Day Finding on a Petition To Reclassify the Utah Prairie Dog From Threatened to Endangered. 76 Fed. Reg. 36053.
[7] U.S. Fish and Wildlife Service. 1984. Final Rule to Reclassify Utah Prairie Dog as Threatened. 49 Fed. Reg. 22330.
Virginia big-eared bat (Corynorhinus townsendii virginianus)
| Status: Endangered | Critical habitat: 11/30/1979 | Listed: 11/30/1979 | Recovery plan: 5/8/1984 |
Range: KY(s), NC(s), VA(b), WV(b) ---
SUMMARY
The Virginia big-eared bat is threatened by destruction and disturbance of its maternity and hibernation caves. White-nose syndrome also poses a major threat to this and many other hibernating bat species. At the time of listing in 1979, this big-eared bat’s population was estimated at 3,500 bats. By 2000, it had grown to 18,442. Most of its essential caves have been protected by private and government agencies.
RECOVERY TREND
The Virginia big-eared bat (Corynorhinus townsendii virginianus) had a population of about 3,500 bats when it was listed as an endangered species in 1979 [9]. It increased to about 10,000 during the 1980s [2], 15,000 during the 1990s [3, 4], and was estimated at 18,442 bats after the last count in 2000 [4].
VIRGINIA
Virginia has two important big-eared bat caves, both in Tazewell County [1]. Tazewell County #1 is a maternity cave accessed by a 10-foot deep hole in the earth. The known population has increased from 100 in 1978 and 80 in 1985 to an average of about 400 between 1991 and 2002. It was not surveyed in 2003-2005. It is unclear whether the increase is due to better survey techniques or population growth.
Tazewell Count #2 is both a maternity and hibernaculum cave. The maternity population grew from the 200s in 1991 and 1992 to an average of about 550 from 1993 to 1999. Equipment failure precluded a 2002 count, but the surveyors believed the population size to be similar to previous years. The hibernaculum was estimated at 2,000 bats between 1985 and 1990 based on subjective reports by cavers. Systematic surveys began in 1993. Prior to construction of a protective gate, the population was 476 in 1993 and 525 in 1995. The post-gate population was 1,600 in 1996 and 1,160 in 1999, with the latter year considered low due to unusual warmth. Surveys were discontinued in 2001 due to safety concerns over the unstable 100+ foot drop entrance.
The overall Virginia trend suggests a increase in the observed maternity population to about 950 females in the 1990s, and an increase in the hibernacula population to about 1,600 observed bats. Based these observed numbers, the state population has been estimated at about 2,200 bats [2, 3, 4].
NORTH CAROLINA
The population grew from 160 bats in 1992 [3] to 260 in 2000 [4].
KENTUCKY
Kentucky supports one major hibernaculum (Stillhouse Cave), which is surveyed every odd year [8]. It remained stable with about 1,000 bats from 1964 to 1974, then increased steadily 6,335 in 2001 before declining to 4,370 in 2005. The statewide population increased from 3,850 in 1992 [3] to 5,105 in 2000 [4].
WEST VIRGINIA
West Virginia has 10 occupied big-eared bat caves [6]. The eight caves systematically surveyed between 1983 and 2005 grew relatively steadily from 3,327 bats to 4,889. All 10 caves were systematically surveyed from 1992 to 2005, growing from 5,699 bats to 6,238 in 2004 before declining to 5,990 in 2005.
- The Arbogast/Cave Hollow population increased from 650 bats (1983) to 1,137 (1988) after a year-round closure was instituted and fence erected [5]. Vandals broke into the cave and built a fire near the maternity roost site between June 1988 and June 1989, reducing the population to 286 bats in 1989. The entrance was subsequently gated and the population slowly but steadily climbed to 648 in 2005 [6].
- The Lambert Cave population declined between 1999 and 2000 when the large tree next to its entrance died, allowing sunlight to increase herbaceous vegetation that blocked the entrance [7]. The West Virginia Department of Natural Resources has controlled the vegetation and planted a new tree at the site, causing the population to bounce back.
- The Cliff maternity site was discovered in 1992 and was the first or second largest through 2005 [6].
WHITE-NOSE SYNDROME
Scientists are concerned about white-nose syndrome infecting the Virginia big-eared bat [11]. There has been no evidence of white-nose syndrome in Virginia big-eared bats yet, but the fungus has been found in the caves where the bats hibernate. Given the lethality of white-nose syndrome and this species’ already low population levels, in November 2009 the National Zoo attempted to establish a captive Virginia big-eared bat colony as a precaution against extinction [12]. Out of 40 uninfected bats that captured in autumn, eight survived the hibernation season [13]. The Zoo's bat team encountered problems feeding the bats, which were lethargic due to hibernation, and prefer to eat while flying. The surviving bats were eventually habituated to eating mealworms from feeding pans, but other food types were refused. Other problems with dermatitis and extremity function led to additional mortality.
CITATIONS
[1] Reynolds, R. 2005. Corynorhinus townsendii virginianus Survey Counts for Virginia. Unpublished report, Virginia Department of Game and Inland Fisheries.
[2] NatureServe. 2005. NatureServe Explorer: An online encyclopedia of life [web application]. Version 4.5. NatureServe, Arlington, Virginia.
[3] U.S. Fish and Wildlife Service. 1992. Endangered and Threatened Species of the Southeastern United States. U.S. Fish and Wildlife Service, Atlanta, GA. (www.fws.gov/endangered/i/a/saa7r-.html)
[4] Currie, R. 2000. Federally listed threatened and endangered species of concern to mining. Paper presented at Bat Conservation and Mining: A Technical and Interactive Forum, November 14-16, St. Louis, MO.
[5] Stihler, C. 2003. Shedding Light On West Virginia's Cave-Dwelling Bats. West Virginia Wildlife Magazine, Summer 2003.
[6] Stihler, C. 2005. Virginia big-eared bat summer colony censuses. Draft report by Craig Stihler, West Virginia Department of Natural Resources, November 28, 2005.
[7,] Stihler, C. 2005. Personal communication with Craig Stihler, West Virgina Department of Natural Resources, November 28, 2005.
[8] Hemberger, T. 2005. Personal communication with Traci Hemberger, Endangered Species Biologist, Kentucky Department of Fish and Wildlife Resources, December 2005.
[9] U.S. Fish and Wildlife Service. 1979. Listing of Virginia and Ozark Big-eared Bats as Endangered Species and Critical Habitat Determination, November 30, 1979 (44 FR 69206).
[10] U.S. Fish and Wildlife Service. 2008. Virginia Big-Eared Bat (Corynorhinus townsendii virginianus) 5-Year Review: Summary and Evaluation. Elikins, WV. 21 pp.
[11] Smithsonian Conservation Biology Institute. 2011. White-Nose Syndrome. Available online at http://nationalzoo.si.edu/scbi/SpeciesSurvival/VirgianiaBigEaredBats/default.cfm. Accessed October 7, 2011.
[12] Mother Nature Network. 2010. White-nose syndrome and the Virginia big-eared bat. Available online at http://www.mnn.com/local-reports/washington-dc/local-blog/white-nose-syndrome-and-the-virginia-big-eared-bat. Accessed October 7, 2011.
[13] Smithsonian Conservation Biology Institute. 2011. Virginia Big-eraed Bats at the National Zoo. Available online at http://nationalzoo.si.edu/scbi/SpeciesSurvival/VirgianiaBigEaredBats/zooproject.cfm . Accessed October 17, 2011.


