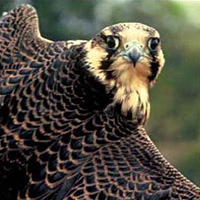
American peregrine falcon (Falco peregrinus anatum)
| Status: Delisted | Critical habitat: 8/11/1977 |
| Listed: 6/2/1970 | Recovery plan: 6/30/1991 |
Range: AL(m), AK(b), AZ(b), AR(m), CA(b), CO(b), CT(b), DE(b), DC(m), GA(b), ID(b), IL(b), IN(b), IA(b), KS(m), KY(b), LA(m), ME(b), MD(b), MA(b), MI(b), MN(b), MS(m), MO(m), MT(b), NE(b), NV(b), NH(b), NY(b), NM(b), NJ(b), NC(b), ND(m), OH(b), OK(m), OR(b), PA(b), RI(b), SC(b), SD(b), TN(b), TX(b), UT(b), VT(b), VA(b), WA(b), WV(m), WI(b), WY(b) ---
SUMMARY
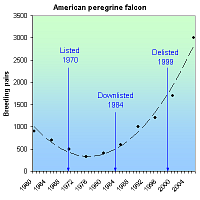
The use of DDT and other organochlorine pesticides thinned American peregrine falcon eggshells, causing reproductive failure and population declines. The banning of DDT, captive-breeding efforts and nest protections allowed falcons to increase from 324 breeding pairs in 1975 to 3,005 pairs as of 2006. The species was delisted in 1999.
RECOVERY TREND
The American peregrine falcon (Falco peregrinus anatum) breeds only in North and Central America and occurs throughout much of North America from the subarctic boreal forests of Alaska and Canada south to Mexico [1]. It is estimated that prior to the 1940s, there were approximately 3,875 nesting pairs of peregrines in North America [1]. From the 1940s through the 1960s, however, the population of the peregrine, and many other raptors, crashed as a result of the introduction of synthetic organochlorine pesticides to the environment. By 1975, there were only 324 known nesting pairs of American peregrine falcons in the U.S. [2].
Scientists investigating the peregrine's decline found unusually high concentrations of the pesticide DDT and its breakdown product DDE in peregrine falcons and other birds of prey [1]. Organochlorine pesticides were put into use following World War II. Use peaked in the late 1950s and early 1960s and continued through the early 1970s [1]. Organochlorine pesticides cause direct mortality and reduced reproduction in birds of prey because they ingest high doses of pesticides concentrated and stored in the fatty tissue of prey animals that themselves ingested contaminated food [1]. Heavily contaminated females may fail to lay eggs and organochlorines passed from the female to the egg can kill the embryo before it hatches [1]. DDE, the principal metabolite of DDT, prevents normal calcium deposition during eggshell formation, causing eggs to frequently break before hatching [1]. During the period of DDT use in North America, eggshell thinning and nesting failures were widespread in peregrine falcons, and in some areas, successful reproduction virtually ceased [1].
The degree of exposure to these pesticides varied among regions, and peregrine falcon numbers in more contaminated areas suffered greater declines [1]. The eastern population plunged from an estimated 350 active nest sites in the 1930s and 1940s to no active breeding birds from 1964 to 1975 [3]. Peregrine falcons in the Great Plains states east of the Rocky Mountains and south of U.S. and Canadian boreal forests were also essentially extirpated [1]. West of the 100th meridian, peregrine falcons were significantly reduced [1]. Local populations were greatly depressed or extirpated and by 1965 fewer than 20 pairs were known west of the U.S. Great Plains [1].
In 1970, the American peregrine was listed as endangered and efforts to recover the species began. The use of DDT was banned in Canada in 1970 and in the United States in 1972 [1]. This was the single-most significant action in the recovery of the peregrine falcon [1]. In addition, in the eastern United States, efforts were made to reestablish peregrine falcons by releasing offspring from a variety of wild stocks that were held in captivity by falconers [1]. The first experimental releases of captive-produced young occurred in 1974 and 1975 in the eastern United States [1]. These and future releases demonstrated that “hacking,” the practice of retaining and feeding young captive bred birds in partial captivity until they are able to fend for themselves, was an effective method of introducing captive-bred peregrines to the wild [1]. Since then, more than 6,000 falcons have been released in North America [1]. Approximately 3,400 peregrines were released in parts of southwest Canada, the northern Rocky Mountain States, and the Pacific Coast states [1].
In the late 1970s, Alaska became the first place American peregrine falcon population growth was documented and, by 1980, populations began to grow in other areas [1]. Not only did the number of peregrine falcons begin to increase, productivity (another important measure of population health) improved [1]. Efforts to reestablish peregrine falcons in the East and Midwest proved largely successful, leading to downlisting of the species in 1984 [1], and by 1999 peregrines were found to be nesting in all states within their historical range east of the 100th meridian, except for Rhode Island, West Virginia and Arkansas [1]. In highly urban areas, peregrine falcons showed great adaptability, and began substituting skyscrapers for natural cliff faces as nesting sites [4]. By 1998, the total known breeding population of peregrine falcons was 1,650 pairs in the United States and Canada, far exceeding the recovery goal of 456 pairs. Other recovery goals, including estimates of productivity, egg-shell thickness, and contaminants levels, had also been met, allowing the species to be delisted in 1999 [1]. Monitoring of American peregrine populations has continued under a post-delisitng monitoring plan [5]. The estimated North American population was 3,005 pairs as of 2006 [6].
ALASKA: Surveys conducted between 1966 and 1998 along the upper Yukon River demonstrated increases in the number of occupied nesting territories from a low of 11 known pairs in 1973 to 46 pairs in 1998 [1]. Similarly, along the upper Tanana River, the number of occupied nesting territories increased from two in 1975 to 33 in 1998 [1]. The recovery objective of 28 occupied nesting territories in the two study areas was first achieved in 1988, with 23 nesting territories on the Yukon River and 12 on the Tanana River [1].
PACIFIC STATES: By 1976, no American peregrine falcons were found at 14 historical nest sites in Washington [1]. Oregon had also lost most of its peregrine falcons and only one or two pairs remained on the California coast [1]. Surveys conducted from 1991 to 1998 indicated a steadily increasing number of American peregrine falcon pairs breeding in Washington, Oregon and Nevada [1]. Known pairs in Washington increased from 17 to 45 and in Oregon from 23 to 51 [1]. The number of American peregrine falcons in California increased from an estimated low of five to 10 breeding pairs in the early 1970s to a minimum of 167 occupied sites in 1998 [1]. The increase in California was concurrent with the restriction of DDT and included the release of more than 750 American peregrine falcons through 1997 [1].
ROCKY MOUNTAINS/SOUTHWEST: The Rocky Mountain/Southwest population of the American peregrine falcon has made a profound comeback since the late 1970s when surveys showed no occupied nest sites in Idaho, Montana or Wyoming and only a few pairs in Colorado, New Mexico and the Colorado Plateau, including parts of southern Utah and Arizona [1]. Surveys conducted from 1991 through 1998 indicated that the number of American peregrine falcon pairs in the Rocky Mountain/Southwest area has steadily increased [1]. In 1991, there were 367 known pairs; in 1998 the number of pairs increased to 535 [1].
EASTERN STATES: The eastern peregrine population has a unique history and complex status under the Act [1]. Peregrine falcons were extirpated in the eastern United States and southeastern Canada by the mid-1960s [1]. Releases of young captive bred peregrines have reestablished populations throughout much of their former range in the East [1]. In 1998, 193 pairs were counted in five designated eastern state recovery units [1]. The number of territorial pairs recorded in the eastern peregrine falcon recovery area increased an average of 10 percent annually between 1992 and 1998 [1]. Equally important, the productivity of these pairs during the same seven-year period averaged 1.5 young per pair, demonstrating sustained successful nesting [1].
CITATIONS
[1] U.S. Fish and Wildlife Service. 1999. Final Rule to Remove the American Peregrine Falcon from the Federal List of Endangered and Threatened Wildlife, and to Remove the Similarity of Appearance Provision for Free-Flying Peregrines in the Conterminous United States. Federal Register (64 FR 46542).
[2] Hoffman, C. 1999. The Peregrine Falcon is Back! New release, U.S. Fish and Wildlife Service, August 20, 1999.
[3] Clark, K. 2005. The Peregrine Falcon in New Jersey, Report for 2005. New Jersey Department of Environmental Protection, Division of Fish and Wildlife, Endangered and Nongame Species Program.
[4] New Jersey Division of Fish and Wildlife. Fact sheet, Peregrine Falcon Falco pereginus. New Jersey Department of Environmental Protection, Division of Fish and Wildlife, Endangered and Nongame Species Program. Website <http://www.njfishandwildlife.com/tandespp.htm> accessed February, 2006.
[5] U.S. Fish and Wildlife Service. 2003. Monitoring Plan for the American Peregrine Falcon, A Species Recovered Under the Endangered Species Act. U.S. Fish and Wildlife Service Division of Endangered Species and Migratory Birds and State Programs. Pacific Region, Portland Oregon 53pp.
[6] Green, M., T. Swem, M. Morin, R. Mesta, M. Klee, K. Hollar, R. Hazelwood, P. Delphey, R. Currie, and M. Aramal. 2006. Monitoring Results for Breeding American Peregrine Falcons (Falco peregrinus anatum), 2003. Biological Technical Publication BTP-R1005-2006. U.S. Department of Interior, Washington, D.C.
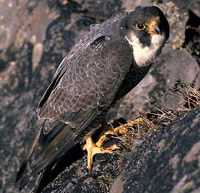
Arctic peregrine falcon (Falco peregrinus tundrius)
| Status: Delisted | Critical habitat: none | Listed: 6/2/1970 | Recovery plan: 6/30/1991 |
Range: AL(m), AK(b), AZ(m), AR(m), CA(m), CO(m), CT(m), DE(m), DC(m), FL(m), GA(m), ID(m), IL(m), IN(m), IA(m), KS(m), KY(m), LA(m), ME(m), MD(m), MA(m), MI(m), MN(m), MS(m), MO(m), MT(m), NE(m), NV(m), NH(m), NY(m), NM(m), NJ(m), NC(m), ND(m), OH(m), OK(m), OR(m), PA(m), RI(m), SC(m), SD(m), TN(m), TX(m), UT(m), VT(m), VA(m), WA(m), WV(m), WI(m), WY(m) ---
SUMMARY
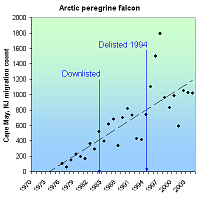
The Arctic peregrine falcon declined due to the egg shell-thinning effects of DDT and other organochlorine pesticides. Its listing as an endangered species in 1970 (along with other birds of prey) prompted the EPA to ban DDT in 1972. Counts of migratory Arctic falcons increased from 103 in 1976, to 1,017 in 2004. The species was downlisted to threatened in 1984 and delisted in 1991.
RECOVERY TREND
The Arctic peregrine falcon (Falco peregrinus tundrius) is one of three peregrine falcon subspecies [1]. It nests in tundra regions of Alaska, Canada (Yukon, Northwest Territories, Quebec, and possibly Labrador), and the ice-free perimeter of Greenland [1]. It is a long-distance migrant that winters in Latin America from Cuba and Mexico south through Central and South America [1].
Severe declines in peregrine falcon numbers began in the 1950s [1]. These declines were linked to organochlorine pesticides that were put into use following World War II, and whose use peaked in the late 1950s-early 1960s [1]. Scientists investigating the peregrine's decline found unusually high concentrations of the pesticide DDT and its breakdown product DDE in peregrine falcons and other birds of prey [2]. Organochlorine pesticides cause direct mortality and reduced reproduction in birds of prey which, being at the top of the food chain, ingest high doses of pesticides concentrated and stored in the fatty tissue of prey animals that themselves ingested contaminated food [1]. Heavily contaminated females may fail to lay eggs and organochlorines passed from the female to the egg can kill the embryo before it hatches. DDE, the principal metabolite of DDT, prevents normal calcium deposition during eggshell formation, causing eggs to frequently break before hatching [1]. Arctic peregrine numbers reached their lowest levels in the early 1970s and in some areas of North America successful reproduction virtually ceased [1]. Populations are thought to have decreased by as much as 80 percent [2].
The listing of the Arctic peregrine falcon as endangered in 1970--as well as the bald eagle, brown pelican, and American peregrine falcon shortly before--fostered a national outcry against the production and spaying of DDT. In 1972, the Environmental Protection Agency banned most used of DDT in the United States [1]. Canada had already restricted DDT use in 1970. These restrictions are the central cause of the recovery of the Arctic and American peregrine falcons (the bald eagle and brown pelican benefited greatly as well, but their recovery also involved substantial habitat protections and reintroductions).
As DDT levels declined after 1972, peregrine falcon productivity rates rose to pre-DDT levels and the population size and range began to increase. This happened most rapidly in northern areas, where pesticide exposur was lower and impacts upon populations were less severe [1]. In 1984, the U.S. Fish and Wildlife Service downlisted the Arctic peregrine falcon from endangered to threatened status [2, 6]. In 1991, the agency initiated a review determine if the species had recovered [2] and in 1994 removed it from the endangered species list [6].
Four major factors were considered in the delisting process: (1) Population size and trend, (2) reproductive performance, (3) pesticide residues in eggs, and (4) eggshell thickness [1]. Despite a lack of long-term studies using consistent methodologies, there was strong evidence of significant population increases throughout the Arctic [1]. Four areas in northern North America (one in Alaska and three in Canada’s North West Territories) for which historical survey information was available indicated the number of Arctic peregrine pairs occupying nesting territories increased since the 1960s [1]. Some areas of Alaska even exceeded the original estimates of pre-DDT-era population size [1]. In addition, in the eastern Arctic, peregrines began nesting in previously vacant nesting sites [1]. Standardized yearly migration counts at New Jersey’s Cape May, an area where Arctic peregrines concentrate during migration, also saw increasing numbers, most likely from Arctic breeding grounds especially in Greenland and eastern Canada (these counts may have also contained peregrines in the American subspecies; however, banding recoveries indicate that the majority of peregrines along the East Coast during fall migration are from the Arctic and thus represent a true increase in Arctic peregrine numbers) [1].
Productivity in all regions where data had been gathered was sufficient to support a stable or increasing population since the 1980s [1]. There had also been improvements in levels of DDE concentration in eggs. Concentrations in excess of 15-20 parts per million (wet weight basis) are associated with high rates of nesting failure. Residue in eggs in 1993 was well below this critical level [1]. Alaskan eggshells collected between 1988 to 1991 were on average only 12 percent thinner than pre-DDT thickness (17 percent or greater reduction in thickness results in population declines).
Arctic peregrine falcon numbers have continued to rise after the species' delisting. On the Sagavanirktok River in Alaska, where Arctic peregrine surveys have been conducted since the late 1950s, the number of pairs increased from five in 1958, to 23 in 1992, to 25 in 1999 [3]. Migration counts at the Cape May Hawkwatch site in New Jersey increased from 103 in 1976 to 1,024 in 2003 [4].
CITATIONS
[1] U.S. Fish and Wildlife Service. 1993. Proposal to Remove the Arctic Peregrine Falcon From the List of Endangered and Threatened Wildlife. 58 Fed. Reg 188.
[2] U.S. Fish and Wildlife Service. 1995. Peregrine falcon, (Falco peregrinus anatum, Falco peregrinus tundrius, Falco peregrinus pealei). Species account. Website <http://www.fws.gov/species/species_accounts/bio_pere.html> accessed October, 2005.
[3] Wright, J.M. and P.J. Bente. 1999. Documentation of active peregrine falcon nest sites, 1 Oct 1994- 31 March 1998. Alaska Department of Fish and Game. Annual research report. Endangered species conservation fund federal aid project SE-2-9, 10, and 11. Juneau, AK. 15 pp.
[4] Cape May Bird Observatory. 2012. Cape May Hawkwatch, Cape May, New Jersey. New Jersey Audubon Society. Website <http://www.njaudubon.org/Sightings/cmhw25.html> accessed April 2, 2012.
[5] NatureServe. 2011. NatureServe’s Central Databases. Arlington, VA. U.S.A
[6] U.S. Fish and Wildlife Service. 1994. Removal of Arctic Peregrine Falcon From the List of Endangered and Threatened Wildlife. 59 Fed. Reg. 50796.
Bald eagle (continental U.S. DPS) (Haliaeetus leucocephalus (Continental U.S. DPS))
| Status: Delisted | Critical habitat: none | Listed: 3/11/1967 | Recovery plan: 5/18/1999 |
Range: AL(b), AZ(b), AR(b), CA(b), CO(b), CT(b), DE(b), DC(b), FL(b), GA(b), ID(b), IL(b), IN(b), IA(b), KS(b), KY(b), LA(b), ME(b), MD(b), MA(b), MI(b), MN(b), MS(b), MO(b), MT(b), NE(b), NV(b), NH(b), NY(b), NM(b), NJ(b), NC(b), ND(b), OH(b), OK(b), OR(b), PA(b), RI(b), SC(b), SD(b), TN(b), TX(b), UT(b), VT(b), VA(b), WA(b), WV(b), WI(b), WY(b) ---
SUMMARY
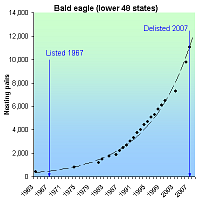
The bald eagle declined throughout the lower 48 states, and was extirpate from most of them due to habitat loss, persecution, and DDT-related eggshell thinning. The banning of DDT, increased wetland protection and restoration, and an aggressive, mostly state-based reintroduction program caused eagle pairs to soar from 416 in 1963 to 11,052 in 2007 when the eagle was removed from the endangered list.
RECOVERY TREND
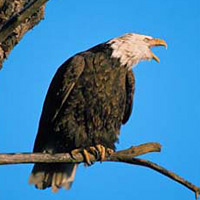
The bald eagle (Haliaeetus leucocephalus) first declined in the 1800s at the hands of trophy hunters, feather collectors, and wanton killing [1]. It was already extirpated or at low numbers in most states by the 1940s when DDT and other organochlorines became widely used. DDE, a breakdown product of DDT, accumulates in the fatty tissue of female eagles, impairing the formation of calcium needed for normal egg formation, causing a decline in reproductive success. DDT caused eagle numbers plummet further, and in 1967 the species was listed as endangered in the lower 48 states [1].
The eagle was joined on the list by the American peregrine falcon, Arctic peregrine falcon and brown pelican in 1970. The listing of these large, charismatic birds rallied the nation to band the production and sale of DDT in 1972.
Due to the DDT ban, increased habitat protection, and aggressive captive breeding and translocation programs (mostly run by state wildlife agencies), bald eagle pairs in the lower 48 soared from 416 in 1963 to 11,052 in 2007 when it was removed from the threatened species list [2, 7]. In 1984, 13 states lacked nesting eagles. By 1998, it was absent from only two. By 2006, it nested in all 48 states [7].
The eagle was proposed for delisting in 1998 [1] and again in 2006 [4]. It was downlisted in 1995 and delisted in 2007 [6].
The bald eagle is managed under five federal recovery plans, divided by region:
Chesapeake Recovery Region: Virginia east of Blue Ridge Mountains, Delaware, Maryland, the eastern half of Pennsylvania, West Virginia Panhandle and two-thirds of New Jersey. Delisting goals were met in 1996 [1]. As of 2003, there were more than 800 nesting pairs in this region [4].
Northern States Recovery Region: 25 Northernmost states. Delisting goals were met in 1991, with 1,349 occupied breeding areas across 20 states. As of 2007, there were an estimated 4,215 breeding pairs in the northern recovery region [6].
Pacific Recovery Region: Idaho, Nevada, California, Oregon, Washington, Montana and Wyoming. Numeric delisting goals were met in 1995 [1]. As of 2001, there were
1,627 nesting pairs in this recovery region [4].
Southeastern Recovery Region: Alabama, Arkansas, Florida, Georgia, Kentucky, Louisiana, Mississippi, North Carolina, South Carolina, Tennessee and eastern Texas. Downlisting goals were met between 1991 and 1998. More than 1,700 pairs were counted in 2000 [4, 6].
Southwestern Recovery Region: Oklahoma and Texas west of the 100th meridian, New Mexico, Arizona and California bordering the Lower Colorado River. The goal established in the recovery plan has been exceeded. In 2003, 46 occupied breeding areas were reported in New Mexico and Arizona. In 2004, the Arizona had 41 occupied breeding areas [4].
In the eight Northeast states from New Jersey to Maine and Vermont, nesting eagle pairs increased from 21 in 1967 to 562 in 2005 [5]. The majority were in Maine, which supported all 21 pairs in 1967 and 385 pairs in 2005. Eagles returned to Massachusetts and New Hampshire in 1990, with the former supporting 19 pairs in 2005 and the latter eight in 2004. In 2005 there were 53 pairs in New Jersey, 94 in New York and one in Vermont. The Northeast is also an important wintering area, with the Connecticut population increasing from 20 to 92 between 1979 and 2005, and the New York population increasing from six to 194 between 1978 and 2006 [5].
CITATIONS
[1] U.S. Fish and Wildlife Service. 1999. Proposed rule to remove the bald eagle in the Lower 48 states from the list of endangered and threatened wildlife. Federal Register, July 6, 1999 (64 FR 36453)
[2] U.S. Fish and Wildlife Service. 2007. Bald Eagle Numbers Soaring. May 14, 2007 press release.
[4] U.S. Fish and Wildlife Service. 2006. Removing the bald eagle in the Lower 48 States from the list of endangered and threatened wildlife; reopening of public comment period with new information. Federal Regiter, February 16, 2006 (71 FR 8238).
[5] Center for Biological Diversity. 2006. Bald eagle trends in the Northeastern United States. Tucson, AZ.
[6] U.S. Fish and Wildlife Service. 2007. Removing the Bald Eagle in the Lower 48 States From the List of Endangered and Threatened Wildlife; Final Rule. 72 Fed. Reg 37346.
[7] Suckling, K. and W. Hodges. Status of the bald eagle in the lower 48 states and the District of Columbia: 1963-2007. Center for Biological Diversity, Tucson, AZ. Available at http://www.biologicaldiversity.org/species/birds/bald_eagle/report/index.html.
California condor (Gymnogyps californianus)
| Status: Endangered | Critical habitat: 9/24/1976 | Listed: 3/11/1967 | Recovery plan: 4/25/1996 |
Range: AZ(b), CA(b) --- NV(x), OR(x), UT(x), WA(x)
SUMMARY
The California condor was nearly driven extinct by DDT, lead poisoning from ingested bullet fragments, and hunting. Lead poisoning remains a major threat to the species. Wild condors declined to nine birds by 1985. A captive-breeding and release program has increased the population to 386 birds as of 2012, including 213 wild and 173 captive birds.
RECOVERY TREND
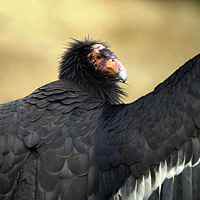
The California condor (Gymnogyps californianus) is a member of the vulture family and one of the largest flying birds in the world [1]. Ten-thousand years ago, its range extended across most of North America, but by the arrival of Europeans, its range was largely restricted to the Pacific Coast from British Columbia south to Baja California. By 1940, it was found only in the coastal mountains of Southern California where it nested in the rugged mountains and scavenged in the foothills and grasslands of the San Joaquin Valley. It was listed as an endangered species in 1967 and was given critical habitat the same year.
The condor's decline was driven by DDT which compromised reproduction, poisoning fromlead poisoning, shooting, collection, and drowning in uncovered oil sumps [1].
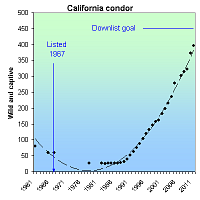
About 600 birds remained in 1890 [1, 2, 3]. It declined to about 60 birds in the late 1930s and early 1940s, 40 in the early 1960s, 27 in 1978, and nine in 1985. All remaining wild birds were taken into captivity in 1987. Since then, a successful captive breeding and reintroduction program increased the 2005 wild population to 121 and the captive population to 158 [2, 3].
The California Department of Fish and Game reports 302 condors in 2007; 315 in 2008; 322 in 2009; 373 in 2010; and 396 in 2011 [4].
The California condor now occurs in three wild populations: in mountains north of the Los Angeles basin, in the Big Sur area of the central California coast, and near the Grand Canyon in Arizona [1].
CITATIONS
[1] U.S. Fish and Wildlife Service. 1996. California Condor Recovery Plan, Third Revision. Portland, Oregon. 62 pp.
[2] California Department of Fish and Game. 2005. California condor population size and distribution. Available at: http://www.dfg.ca.gov/hcpb/species/t_e_spp/tebird/Condor%20Pop%20Stat.pdf
[3] U.S. Fish and Wildlife Service. 2005. Condor population history. Hopper Mountain National Wildlife Refuge Complex. Available at: http://www.fws.gov/hoppermountain/cacondor/Pophistory.html.
[4] Ventana Wildlife Society. 2012. California Condor Recovery Program, Population Size and Distribution updates. Available at: http://www.ventanaws.org/pdf/Status_Reports/2012/Status_Report_February_2012.pdf.
| Status: Endangered | Critical habitat: none | Listed: 3/11/1967 | Recovery plan: 5/15/1992 |
Range: NV(b) ---
SUMMARY
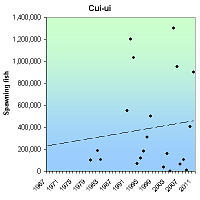
The Cui-ui, a fish found only in Pyramid Lake, Nev., declined due to agricultural diversions that led to a drop in lake levels. Though habitat, fish passage, water level management have improved, the cui-cui remains threatened by drought and diversions. Listed as endangered in 1967, the cui-ui increased from about 100,000 spawning adults in 1983 to more than 900,000 in 2011. Annual rates, however, are highly variable.
RECOVERY TREND
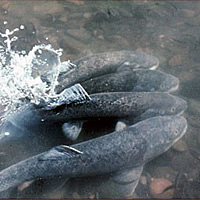
The Cui-ui (Chasmistes cuius) is a sucker fish which formerly inhabitated Pyramid and Winnemucca lakes in Nevada. Adult and juvenile fish inhabitat the lake year-round, but adults leave the lake annually to spawn in its feeder streams.
The Cui-ui was extirpated from Winnemucca Lake in the 1930s when a drought and excessive water diversions completely dried the lake, killing all the fish [1].
Cui-ui populations in Pyramid Lake began to decline after the construction of Derby Dam in 1905 and following the establishment of the Newlands Reclamation Project that led to subsequent agricultural diversions from the Truckee River [2]. Approximately one-half of the annual flow of the Truckee was typically diverted in the early to mid-1900s [3]. Due to decreased flows, Pyramid Lake dropped about 25 meters in surface elevation by 1970 [3]. This drop in lake levels resulted in the formation of a sand-bar delta at the mouth of the Truckee River that essentially blocked the cui-ui from ascending the river to reach their spawning grounds except for in occasional high flow years [2].
In addition, increasing agricultural, municipal, and industrial water demands altered the volume and timing of river flows, and channelization, grazing, and timber harvesting in and along the Truckee River reduced riparian canopy and increased bank erosion [1]. Industrial and agricultural pollutants from point and nonpoint sources along the river also began to affect water quality.
Stampede Dam and Reservoir (completed in 1970) and Marble Bluff Dam (completed in 1976) have helped control river flow and volume and have enhanced spawning runs [1]. Marble Bluff Dam has created several miles of habitat suitable for cui-ui spawning immediately upstream [1]. The regulation of water flows in combination with restrictions on the harvest of cui-ui, hatchery programs (currently run by the Paiute tribe), and the installation of a fishway at Marble Bluff Dam that can be used to give fish access to the river in low-water years have led to increasing cui-ui numbers [3]. In addition, as a result of better water management, in 1987 a band of cottonwoods and willows became established along the Truckee bank [3]. This resulted in changes in channel and floodplain morphology that, along with increased shade from riparian vegetation, improved aquatic conditions for the cui-ui [3].
Between 1950 and 1979, cui-ui only twice had significant successful reproduction, causing the species to have two major year classes during this period [4]. It avoided extinction only through longevity as it can live up to 50 years [4]. This allowed the cui-ui to persist over decades with minimal reproduction.
Cui-cui spawning levels are highly variable (over 1,000,000 spawners in 1992, 1993, and 2005; less than 40,000 in 2002, 2004, 2009) but increased significantly since 1967 and have continued to increase since 1980:
Average Number of Spawning Cui-ui, 1980-2011 [4, 5, 8, 9, 10]
1980-1984 130,157
1985-1989
1990-1994 711,500
1995-1999 276,750
2000-2004 65,723
2005-2009 485,400
2010-2011 651,500
The Dave Koch Cui-ui Hatchery continues to produce large numbers of cui-ui juveniles used to enhance populations [2]. It is unclear, however, how many of these juveniles make it into the adult population and hatchery efforts have begun to focus more on extended rearing [1].
In 2002, the management regime for flows supporting the cui-ui was changed from an annual release to allow spawning, to year-round management to benefit the ecosystem [7]. This resulted in a better-defined channel and other improvements that now allow spawning to occur every year, and contributed to record spawning that occurred in 2005.
CITATIONS
[1] U.S. Fish and Wildlife Service. 1992. Cui-ui (Chasmistes cujus) Recovery Plan. Second revision. U.S. Fish and Wildlife Service, Portland, Oregon. 47pp.
[2] Pyramid Lake Fisheries. 2000. Dave Koch Cui-ui Hatchery website. http://www.pyramidlakefisheries.org/Cui-ui.htm
[3] Rood, S.B., C.R. Gourley, E.M. Ammon, L.G. Heki, J. R. Klotz, M.L. Morrison, D. Mosley, G.G. Scoppettone, S. Swanson, and P.L. Wagner. 2003. Flows for Floodplain Forests: A successful riparian restoration BioScience 53(7):647-656.
[4] Scoppetone, G.G. and P.H. Rissler. 1995. The endangered Cui-ui of Pyramid Lake, Nevada in Our Living Resources, A report to the Nation on the distribution, abundance and health of U.S. plants, animals, and ecosystems. National Biological Service. Available online at http://web.archive.org/web/20060925013929/http://biology.usgs.gov/s+t/noframe/r250.htm.
[5] DeLong, J. 2011. With cui-ui thriving, the whole river teems. Reno Gazette-Journal, May 30, 2011. www.pyramidlake.us/images/news/2011news/5-30-11%20RGJ%20Cui-ui%20Run%20Article.pdf. Accessed October 17, 2011.
[6] Scoppetone, G.G. and P.H. Rissler. 2007. Effects of Population Increase on Cui-ui Growth and Maturation. Transactions of the American Fisheries Society 136:331–340.
[7] Heki, L. 2011. Personal communication regarding population, spawning and flow management.
[8] Scoppettone, G., M. Coleman and G.A. Wedemeyer. 1986. Life history and status of the endangered cui-ui of Pyramid Lake, Nevada. Fish and Wildlife Research 1, U.S. Fish and Wildlife Service, Washington, D.C. 23 pp. www.dtic.mil/cgi-bin/GetTRDoc?AD=ADA323249
[9] U.S. Bureau of Reclamation. 2011. Cui-ui Spawning Runs. Website maintained at http://www.usbr.gov/projects/Project.jsp?proj_Name=Washoe%20Project
Gray wolf (Northern Rockies DPS) (Canis lupus (Northern Rockies DPS))
| Status: Endangered | Critical habitat: none | Listed: 3/11/1967 | Recovery plan: 8/3/1987 |
Range: ID(b), MT(b), eastern OR(b), eastern WA(b), WY(b), northern UT(o)
SUMMARY
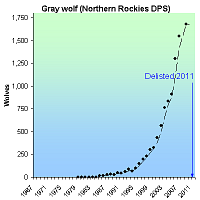
Gray wolves were purposefully hunted, trapped and poisoned to near extinction in the western United States, often by the federal government or with the encouragement of private and state bounties. By 1973, no wild wolves remained in the region. They were listed as endangered in 1967 and began recolonizing the Northern Rocky Mountains from Canada in the early 1980s. Due to prohibition of killing, habitat protection, and reintroductions, the population grew rapidly, was downlisted in 2003, reached 1,679 wolves by 2009, and was delisted in 2011.
RECOVERY TREND
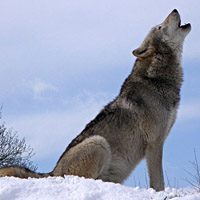
The Northern Rocky Mountains gray wolf (Canis lupus pop.) historically occurred throughout Idaho, the eastern third of Washington and Oregon, all but the northeastern third of Montana, the northern two-thirds of Wyoming, and the Black Hills of South Dakota [1]. As early American settlers began moving west, populations of the gray wolf’s important prey species were over-hunted, causing the wolves to resort to hunting sheep and cattle. As a result, bounty hunting of wolves began in the 19th century and continued through as late as 1965. Around the turn of the century some population control measures were attempted in Yellowstone National Park that led to increased numbers of gray wolves in the area. In response, however, people began killing large numbers of wolves [1]. Beginning in 1912 a minimum of 136 wolves and 80 pups were killed each year and by 1920, only 30 to 40 wolves persisted in this area [1]. By 1973, gray wolves were exterminated from the western lower 48 states and existed only in northeastern Minnesota and Isle Royal, Mich. [2].
Protection of gray wolves was not initiated until the enactment of the Endangered Species Act. By this time gray wolves no longer occurred in the western United States except for the occasional dispersion of Canadian animals into Montana and Idaho that failed to survive long enough to reproduce [3]. Successful recolonization of gray wolves into the Rocky Mountain region did not occur until the early 1980s. Around this time, the Rocky Mountain Gray Wolf Recovery Team was organized with the intent of developing standard observation methods for studying and monitoring the wolves. In 1987, a recovery plan was published. Around this time, the status of the Rocky Mountain Gray wolf was still quite precarious. In Montana, from 1985 to 1986 roughly 15 to 20 wolves were believed to occur near Glacier National Park. In Wyoming from 1982 to 1985, 15 wolves were reported at Yellowstone National Park, and the same number were believed to occur in Idaho in 1986 [1].
Regular monitoring of the Rocky Mountain gray wolf population did not occur until 1995, at which time there were an estimated 14 wolves in Montana and 15 in greater Yellowstone. By 2000, there were an estimated 65 wolves in Montana, 118 in Yellowstone, and 141 in central Idaho [4]. In 2004, a recovery update of the Rocky Mountain gray wolf was released, providing information regarding the status of the gray wolf at three designated recovery areas: the Northwestern Montana Recovery Area (NWMT) in Montana and the Northern Idaho panhandle; the Greater Yellowstone Area (GYA), which includes Wyoming and adjacent parts of Idaho and Montana; and the Central Idaho (CID) area covering central Idaho and adjacent parts of southwest Montana. As of 2004, 16 packs containing 59 wolves were documented at NWMT [3]. In the GYA, 171 wolves in 16 packs inhabited the Wyoming portion and 17 packs occurred in the Montana region. In the CID 64 wolves in 40 groups and as individuals were monitored [3]. The total population of free ranging Rocky Mountain Gray wolves for 2004 was estimated at 59 in Montana, 324 in Greater Yellowstone, and 422 in Central Idaho. In 2005 population estimates were 93, 294, and 525 respectively [4]. In 2009 the population of wolves in the Northern Rockies was about 1,679, up from 1,545 in 2007 and 1,300 in 2006 [4].
The U.S. Fish and Wildife Service delisted the Northern Rockies gray wolf in 2008, but the decision was objected to by conservationists who argued that the recovery plan goal was outdated, and insufficient to remove the threat of extinction because it did not require a large enough or well-connected enough wolf meta-population. In 2011, with encouragement from the Department of Interior, Congress for the first time in the history of the Endangered Species Act, overruled the courts and order the delisting of the Northern Rockies gray wolf without biological or legal review [7].
CITATIONS
[1] U. S. Fish and Wildlife Service. 1987. Northern Rocky Mountain Wolf Recovery Plan. U.S. Fish and Wildlife Service. Denver, CO. 119pp
[2] U. S. Fish and Wildlife Service. 2004. Gray Wolf. U.S. Fish and Wildlife Service. Revised May, 2004.
[3] U.S. Fish and Wildlife Service, Nez Perce Tribe, National Park Service, Montana Fish, Wildlife and Parks, Idaho Fish and Game, and USDA Wildlife Services. 2005. Rocky Mountain Wolf Recovery 2004 Annual Report. U.S. Fish and Wildlife Service, Helena, MT. 72pp. Available at <http://westerngraywolf.fws.gov/annualreports.htm>
[4] International Wolf Center. 2011. Gray Wolf Population Trends in the Contiguous United States. Website <http://www.wolf.org/wolves/learn/wow/regions/United_States_Subpages/Biology1.asp> Accessed October 6, 2011..
[5] U.S. Fish and Wildlife Service. 2006. Designating the Northern Rocky Mountain Population of Gray Wolf as a Distinct Population Segment; Removing the Northern Rocky Mountain Distinct Population Segment of Gray Wolf From the Federal List of Endangered and Threatened Wildlife. Federal Register, February 8, 2006 (71 FR 6634-6660).
[6] U.S. Fish and Wildlife Service. 2007. U.S. Fish and Wildlife Service data cited by Brad Knickerbocker, Gray wolves may lose US protected status, Christian Science Monitor, Febraury 1, 2007.
[7] U.S. Fish and Wildlife Service. 2011. Endangered and Threatened Wildlife and Plants; Reissuance of Final Rule To Identify the Northern Rocky Mountain Population of Gray Wolf as a Distinct Population Segment and To Revise the List of Endangered and Threatened Wildlife. 76 Fed. Reg. 26086.
Pahrump poolfish (Empetrichthys latos)
| Status: Endangered | Critical habitat: none | Listed: 3/11/1967 | Recovery plan: 3/17/1980 |
Range: NV(b) ---
SUMMARY
The Pahrump poolfish is endemic to Manse Spring, Nevada, but was removed when the spring began to dry up. It is threatened by water pumping, water pollution, vandalism, exotic species, and being dependent upon human pool maintenance. It was listed as an endangered species 1967. In 1971 only 29 fish remained. New populations were created, managament was improved and between 2007 and 2010, the population averaged 17,145 fish.
RECOVERY TREND
The Pahrump poolfish (Empetrichthys latos latos) is the only surviving member of the Empetrichthys genus—a group of four desert fish evolved to live in isolated Nevada springs. It is now the only existing fish native to the Pahrump Valley.
- The Ash Meadows poolfish (E. merriami) was endemic to a group of large springs in Ash Meadows. It went extinct in 1950 due to the introduction of exotic species and possibly excessive water pumping [5, 6].
- The Raycraft Ranch poolfish (E. l. concavus) formerly occurred at Raycraft Ranch Spring, in Pahrump Valley. Its population was suppressed by the introduction of exotic predatory carp (Cyprinus spp.) and groundwater pumping [5, 6]. Excessive pumping eventually destroyed the spring's commercial value, leaving it as a perceived source of bothersome mosquitoes. It was thus filled with dirt and completely destroyed in 1957.
- The Pahrump Ranch poolfish (E. l. pahrump) formerly occurred at two springs on Pahrump Ranch in Pahrump Valley. Its population was suppressed by the introduction of exotic predatory carp (Cyprinus spp.) and desiccation of the springs from groundwater pumping [4, 5, 6]. The springs dried up in 1958 due to irrigation pumping.
The Pahrump poolfish is endemic to Manse Spring in the Pahrump Valley. In 1962 or 1963, the pool became contaminated with non-native goldfish, suppressing the poolfish [7, 8]. Water pumping for agriculture had lowered the spring's flow rate. In light of these threats and the recent extinction of all other members of the genus, the U.S. Fish and Wildlife Service placed the Pahrump poolfish on the nation's first list of endangered species in 1967. It was one of only 19 fish on the original list of 72 endangered species.
Goldfish were removed from Manse Spring later that year, but were not eradicated [7, 8]. The poolfish population was estimated at 1,300.
In 1968, two young professors who would go on to become the deans of desert fish ecology—Jim Deacon of the University of Nevada and the W. L. Minckley of Arizona State University—published a remarkable essay in response to the 1967 endangered species list. Entitled "Southwestern fishes and the enigma of 'endangered species'," the essay briefly assessed the status of numerous desert fish and described the challenges facing the scientific community in the new task of determining which fish deserve the status of an "endangered species." [7].
Summing up the state of desert fish and what was needed to save them, Deacon and Minckley wrote:
"A great natural experiment of evolution, evolution, also amplified and perhaps accelerated by isolation in desert aquatic habitats appears about to become an exercise in extinction, if man will have it so…Possibly the most compelling reason for preserving species is the value such a program has in demonstrating the importance of restraint. An "endangered species" program is imperative, not only for the sake of the species studied, but also because of what it can teach us about the possibilities for continued survival of other species, including man."
They cataloged many extinctions and concluded that the next in line was the Pahrump poolfish due to the "catastrophic practice" of water mining the Pahrump Valley. Showing that the flow rate of Manse Spring had declined from 6.0 ft2/second in 1875 to 1.5 ft2/second in 1966, they grimly predicted that "withdrawal of nearly 41,000 acre-feet annually virtually guarantees continued decline of the water table, eventual failure of Manse Spring and extinction of the last population of the genus Empetrichthys…in less than 10 years."
Seven years later, right on schedule, Manse Spring ran dry, killing off the last natural population of the Pahrump poolfish and ending several million years of Empetrichthys evolution in its natural habitat [2].
The Pahrump poolfish, however, did not go extinct.
In response to the Deacon/Minckley essay, the U.S. Fish and Wildlife and others moved fish from Manse Spring to Los Latos Pool in 1970, to Corn Creek Springs in 1971, and to Shoshone Ponds in 1972. The Los Latos Pool population failed in 1976 or 1977. Corn Creek Springs and Shoshone Ponds were successful and still existed as of 2012. A third population was successfully established at Spring Mountains Ranch State Park in 1983 and still existed as of 2012.
DOWNLISTNG CONSIDERATION
The 1980 U.S. Fish and Wildlife Service recovery plan requires the establishment of three populations more than 500 fish for three consecutive years in order to downlist the Pahrump poolfish to threatened status [4]. Delisting can occur if the populations remain at 500 adults for three additional years after downlisting [4]. The habitat of the three populations must also be secured [4].
In 1993, the U.S. Fish and Wildlife Service published a downlisting proposal because the species had more than 500 individuals at Corn Creek Springs, Shoshone Ponds and Spring Mountains Ranch from 1986 through 1993 [4]. From 1988 to 1993 the populations at each site contained “far greater than 500 individuals" [4]. The habitat was deemed sufficiently secure because the U.S. Fish and Wildlife Service had applied for vested water rights at Corn Creek Springs, the Nevada Department of Wildlife had State appropriative water rights at Shoshone Ponds, and the Nevada Division of State Parks had appropriated water rights for Sandstone Spring, the water source for the Spring Mountain Ranch irrigation impoundment [4].
The proposal was not finalized and in 2004, the agency withdrew it due to the sudden loss of the Corn Creek population, a 2003 population decline at Shoshone Ponds, and concern that the state would not protect its water right at Spring Mountains Ranch State Park [1].
STATUS OF POPULATIONS
LOS LATOS POOL
Los Latos Pool is a pond in southern Nevada along the Colorado River near Lake Mohave. The U.S. Fish and Wildlife Service, the Bureau of Reclamation and the Nevada Fish and Game moved "a few fish" from Manse Spring to Los Latos Pool in June, 1970 [2, 10]. "Some" fish were still present in the summer of 1976. In the fall of 1976, several storms struck the area, moving debris in to the pool. The Pahrump poolfish extirpated between then and the next survey in 1977 and has not inhabited the pool since [2, 3]. No further reintroductions were conducted because the site was deemed to have limited recovery potential [2].
CORN CREEK SPRINGS
Corn Creek Springs is a complex of three ponds on the U.S. Fish and Wildlife Service’s Desert National Wildlife Range north of Las Vegas. Water enters the upper pond from two springs, overflows in a middle pond, and then drains into the lower pond [2]. The Pahrump poolfish was established there in August, 1971 with 29 fish from Manse Spring [2, 10]. It thrived until at least 1993, with greater than 500 fish occupying the springs in all years between 1986 and 1993, and far greater than 500 fish from 1988 to 1993 [1, 3, 5].
Bullfrogs and crayfish were illegally introduced to the springs after 1993, causing the population to plummet to three in 1998 and to be extirpated in 1999.
Two small, tamper-proof tanks were constructed in 2002 and 120 poolfish were transplanted there in 2003. The population has remained viable since then, with about 159 fish being present in 2010 [5].
The small size of the tanks renders them incapable of supporting a population numbering in the thousands as used to exist at Corn Creek Springs. It likely renders them incapable of even supporting a consistent population of more than 500 fish, thus preventing the Pahrump poolfish from meeting its downlisting or delisting goal (see above). For this reason, the Nevada Department of Wildlife recommended in 2005 that the poolfish be reintroduced to the Corn Creek Springs [3].
SHOSHONE PONDS
Shoshone Ponds is a series of three, small, constructed artesian well-fed pools (North Pond, Middle Pond, and Stock Tank), one large spring-fed stock pool, and one artesian well outflow. It is on BLM land approximately 60 kilometers southeast of Ely, White Pine County, Nevada [10]. In 1970 the Bureau of Land Management designated the Shoshone Ponds and 1,240 surrounding acres as the Shoshone Ponds Natural Area.
Sixteen Pahrump poolfish from Manse Spring were introduced to Shoshone Ponds in March, 1972 [3, 10]. The population was lost in 1974 when vandals turned off a valve controlling flow are artesian water to the springs [3].
The water system was modified to make it more secure and in 1976, 50 fish from Corn Creek Springs (after spending a year in the University of Nevada at Las Vegas' holding facility) were reintroduced [10].
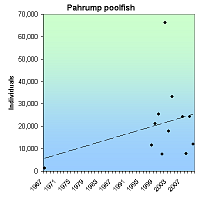
From 1986 to 1993, more than 500 fish occupied the springs in all years; far greater than 500 fish were present from 1988 to 1993 [1, 3, 9]. With the exception of 2002 when the population soared to 8,149 fish and 2003 when it plummet to 922 fish, the population was stable between 3,000 and 5,600 fish between 1997 and 2004. In 2010, the population was estimated at 4,527 fish [9].
SPRING MOUNTAINS RANCH STATE PARK
Spring Mountains Ranch State Park is in western Clark County, Nevada. In 1983, exotic fish were eradicated from pools there, and 426 poolfish were introduced from Corn Creek Springs [3].
More than 500 fish were present between 1986 and 1993. Population estimates were 24,800 fish in 1989, 16,775 in 2003 and 29,876 in 2004. In 2007 there were approximately 20,000 fish, in 2008 there were approximately 5,000, in 2009 there were approximately 20,000, and in 2010 the population was estimated at 7,400 [9].
Chimney Springs and Hot Creek, Nye County
The U.S.G.S. refers to the existence of stable Pahrump poolfish population at this location 1992 [11], but we can find no other reference too it and presume it is a mistake.
Sodaville Springs, Mineral County
The U.S.G.S. refers to the existence of stable Pahrump poolfish population at this location 1992 [11], but we can find no other reference too it and presume it is a mistake.
CITATIONS
[1] U.S. Fish and Wildlife Service. 1980. Pahrump Killifish Recovery Plan. Available at http://ecos.fws.gov/docs/recovery_plan/060628.pdf
[2] U.S. Fish and Wildlife Service. 1993. Proposed reclassification of the Pahrump Poolfish (Empetrichthys latos latos) from endangered to threatened status. September 22, 1993 (58 FR 49279). Available at http://ecos.fws.gov/docs/federal_register/fr2411.pdf
[3] U.S. Fish and Wildlife Service. 2004. Withdrawal of proposed rule to reclassify the Pahrump Poolfish (Empetrichthys latos) from endangered to threatened status. U.S. Fish and Wildlife Service, April 2, 2004 (69 FR 173830)
[4] Sada, D. W. and G. L. Vinyard. 2002. Anthropogenic changes in biogeography of Great Basin aquatic biota. Pages 277-294 IN Great Basin Aquatic Systems History (R. Hershler, D. B. Madsen and D. R. Currey eds. 2002. Smithsonian Contributions to the Earth Sciences 33.
[5] Miller, R. R., J. D. Williams, and J. E. Williams. 1989. Extinctions of North American fishes during the past century. Fisheries 14:22-38.
[6] Deacon, J. E., and J. E. Williams. 1984. Annotated list of the fishes of Nevada. Proceedings of the Biological Society of Washington 97(1):103-118.
[7] Minckley, W. L. and Deacon, J. E. 1968. Southwestern fishes and the enigma of "endangered species". Science 159:1424-1433. Available at http://www.gcmrc.gov/library/reports/biological/Fish_studies/Minckley1968.pdf
[8] Deacon, J.E. and J.E. Williams. 2010. Retrospective Evaluation of the Effects of Human Disturbance and Goldfish Introduction on Endangered Pahrump Poolfish. Western North American Naturalist 70(4):425-436.
[9] [5] Sjoberg, J. 2011. Personal communication with Jon Sjoberg, Biologist, Nevada Department of Wildlife. October 17, 2011.
[10] Nevada Department of Wildlife. 2005. Pahrump poolfish monitoring and recovery activities. Draft report provided by Jon C. Sjöberg, Nevada Department of Wildlife, Las Vegas Nevada, August 21, 2005.
