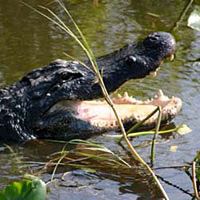
American alligator (Alligator mississippiensis)
| Status: Delisted | Critical habitat: none |
| Listed: 3/11/1967 | Recovery plan: 5/3/1979 |
Range: AL(b), AR(b), FL(b), GA(b), LA(b), MS(b), NC(b), OK(b), SC(b), TX(b) ---
SUMMARY
Habitat loss and poorly regulated hunting resulted in the decline of American alligator populations. Following listing in 1967, populations rebounded, and the American alligator recovered. It remains protected due to similarity of appearance to the endangered American crocodile.
RECOVERY TREND
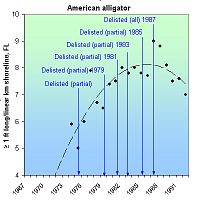
The American alligator (Alligator mississippiensis) suffered noticable population declines by the 1950s and 1960s due to habitat loss and unregulated or poorly regulated hunting [1]. In 1967 it was listed as an endangered species throughout its range in Alabama, Arkansas, Florida, Georgia, Louisiana, Mississippi, North Carolina, Oklahoma, South Carolina and Texas. Populations began to rise and the species was delisted in three Louisiana parishes in 1975 [2]; downlisted in Florida and certain coastal areas of South Carolina, Georgia, Louisiana, and Texas in 1977 [3]; delisted in nine additional Louisiana parishes in 1979 [4]; delisted in the 52 remaining Louisiana parishes in 1981 [5]; delisted in Texas in 1983 [6]; delisted in Florida in 1985 [7]; and delisted in the remaining portion of its range (Alabama, Arkansas, Georgia, Mississippi, North Carolina, Oklahoma and South Carolina) in 1987 [1]. To protect it from accidental shooting, it remains protected under the Endangered Species Act due to its similarity of appearance to the endangered American crocodile [1].
Alligator surveys are generally not comparable due to differences in effort and methodology. Florida established a standardized monitoring program in 1974 that documented an increased density of wild alligators over one foot in length per linear kilometer of shoreline between 1974 and 1992 [8]. The density peaked in 1987 at nine/km and thereafter declined to seven/km in 1992.
CITATIONS
[1] U.S. Fish and Wildlife Service. 1987. Reclassification of the American alligator to threatened due to similarity of appearance throughout the remainder of its range. June 4, 1987 (52 FR 21059)
[2] U.S. Fish and Wildlife Service. 1975. Reclassification of the American alligator in Louisiana, and proposed changes to special rules concerning the alligator. September 26, 1975 (40 FR 44412)
[3] U.S. Fish and Wildlife Service. 1977. January 10, 1977 (42 FR 2071)
[4] U.S. Fish and Wildlife Service. 1979. June 25, 1979 (44 FR 37130)
[5] U.S. Fish and Wildlife Service. 1981. Reclassification of American alligator in Louisiana. August 10, 1981 (46 FR 40664)
[6] U.S. Fish and Wildlife Service. 1983. October 12, 1983 (48 FR 46332)
[7] U.S. Fish and Wildlife Service. 1985. Reclassification of American alligator in Florida to threatened due to similarity of appearance. June 20, 1985 (50 FR 25672).
[8] Woodward, A.R. and C.T. Moore. 1995. American Alligators in Florida; in LaRoe, E.T., G.S. Farris, C.E. Puckett, P.D. Doran, and M.J. Mac, eds. 1995. Our living resources: a report to the nation on the distribution, abundance, and health of U.S. plants, animals, and ecosystems. U.S. Department of the Interior, National Biological Service, Washington, DC. 530 pp. http://biology.usgs.gov/s+t/noframe/d052.htm.
American burying beetle (Nicrophorus americanus)
| Status: Endangered | Critical habitat: none |
| Listed: 8/13/1989 | Recovery plan: 9/27/1991 |
Range: AR(b), KS(b), MA(b), NE(b), OH(b), OK(b), RI(b), SD(b), TX(b) --- AL(x), CT(x), DE(x), DC(x), FL(x), GA(x), IL(x), IN(x), IA(x), KY(x), LA(x), ME(x), MD(x), MI(x), MN(x), MS(x), MO(x), MT(x), NH(x), NY(x), NJ(x), NC(x), ND(x), PA(x), SC(x), TN(x), VT(x), VA(x), WV(x), WI(x)
SUMMARY
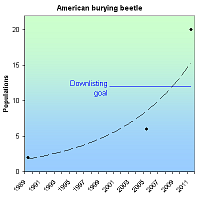
The cause of the American burying beetle's 90% range loss is not well understood, but is thought to be due to disruptions in the food and reproductive web. It is threatened by competition, drought, invasive ants and habatat loss. When listed as endangered in 1989, there were only two known populations. Captive breeding, reintroduction efforts and intensive surveys have increased the total number of populations to 20 or more in 2011.
RECOVERY TREND
The American burying beetle (Nicrophorus americanus) is a large, spectacularly colored orange and black insect. It formerly occurred across a vast range from Nova Scotia south to Florida, west to Texas, and north to South Dakota. It was documented in 150 counties in 34 states, the District of Columbia, and three Canadian provinces. Total historical numbers are not known, but the species may well have occurred in the tens of millions. The burying beetle's dramatic decline has been called "difficult to imagine" and “one of the most disastrous declines of an insect’s range ever to be recorded” [2]. It was extirpated from mainland New England through New Jersey by the 1920s, from the entire mainland east of the Appalachian Mountains by the 1940s, and from the mainland east of the Mississippi River by 1974. It is absent from about 90 percent of its historic range.
The largest of North America's 32 burying beetles, N. americanus is uniquely dependent upon quail-size carrion weighing 100 to 200 grams [1, 15]. Males smell freshly dead mammals and birds (and occasionally even fish) within an hour of death and up to two miles away. Females arrive shortly thereafter, attracted by male pheromones. A competition ensues and is typically won by the largest male and female. Lying on their backs, the winning couple inches the carrion into an excavated burial chamber. During this time, orange phoretic mites borne by the beetles leap to the carcass, cleaning it of fly eggs and microbes. The buried carcass is relieved of its feathers, feet, tail, ears and/or fur. Now known as a "brood ball," it is coated with oral and anal embalming secretions to retard fungal and bacterial growth. The beetles then mate and within 24 hours lay eggs in the soil near the carcass. White grubs emerge three or four days later and are carried to the carcass. The parents also defend the grubs from predators and feed them regurgitated food. The American burying beetle is one of the few non-colonial insects in the world to practice dual parenting. In approximately a week, the grubs leave the chamber and pupate into adults.
The cause of the American burying beetle's decline is not well understood, but the most cogent hypotheses see it as victim of interacting food chain disturbances which reduced the number of large carcasses [2]. The passenger pigeon, which formerly occurred in the billions, was an ideal size. It was last seen in 1914 and was greatly reduced in number in the decades preceding. Its decline and disappearance occurred just prior to the burying beetle's. Other endangered or greatly reduced carrion of ideal size include the black-footed ferret, northern bobwhite, and greater prairie chicken. Competition for dwindling carrion numbers was exacerbated by increasing numbers of mid-sized predators following the extinction or decline of large predators such as the eastern cougar, mountain lion and gray wolf. In their absence, coyotes, raccoons, fox and other mid-size scavengers increased in number and consumed more quail-size carrion. Finally, as habitats became more fragmented mid-size predators were increasingly able to exploit forest and grassland edges, taking more carrion.
At the time of listing in 1989, two populations were known: one on Block Island, Rhode Island and one in eastern Oklahoma [1]. Since then, populations have been discovered in South Dakota (1995), Nebraska (1992), Kansas (1997), Arkansas (1992) and Texas (2003), as well as additional populations in Oklahoma [3, 23]. The total number of populations has increased to at least 20 as of 2011 [7, 11, 13, 10, 22, 23].
RHODE ISLAND. Located 12 miles off the south coast of Rhode Island, Block Island supports the last natural population of the American burying beetle east of the Mississippi River. The island is free of foxes, raccoons, skunks and coyotes. A study of one-third of the population determined that it was relatively stable between 1991 and 1997 (mean=184), steadily grew to 777 in 2006, and then declined to 80 in 2011 in part because of a reduction in supplementation of carcasses [8]. This population served as the source for the successful Roger Williams Park Zoo captive breeding program initiated in 1994 and for direct translocations to Nantucket and Penikese Island.
MASSACHUSETTS. The American burying beetle was extirpated from Massachusetts shortly after 1940 [1] and was reintroduced to the 70-acre Penikese Island in Buzzards Bay over a four-year period between 1990 and 1993. Reintroduced beetles initially came from a Boston University captive breeding population originating from Block Island stock [6]. The population persisted at low numbers through 2002, but was not located in 2003, 2004 or 2005. On Nantucket, 2,892 beetles were introduced from the Roger Williams Park Zoo between 1994 and 2005 to the Audubon Society’s Sesachacha Heathland Wildlife Sanctuary (east side of the island) and the Nantucket Conservation Foundation’s Sanford Farm (west side of the island) [5, 6, 21]. Existing and new beetles were trapped and provisioned with quail carcasses each summer to boost larva production [5]. The introduction program ended in 2005 in order to determine if population is self-sustaining [6]. The Penikese Island reintroduction effort has been deemed a failure, and the success of the Nantucket effort is unknown, although the population is believed to persist [23].
OHIO. The American burying beetle was extirpated from Ohio shortly after 1974 when it was last seen near Old Man's Cave in Hocking Hills State Park [9, 10]. A short-lived captive population derived from Block Island stock was established in 1991 at the Insectarium of the Cincinnati Zoo and Botanical Garden [1]. In July 1998, Ohio became the site of the first mainland introduction when 35 pairs of beetles taken from a wild population near Fort Chaffee, Ark. were introduced to the Waterloo Wildlife Experiment Station in southeast Ohio [10]. The Waterloo population was augmented in 1999 (20 pairs and 15 females) and 2000 (33 pairs and four males), but not 2001 or 2002. Additional augmentation occurred in 2003. A captive population established at Ohio State University in 2002 produced 828 beetles as of 2004; 199 of these were used for reintroductions in 2003 and 156 were reintroduced in 2004. The Wilds (managed by the Columbus Zoo) plans to create a second captive colony [10] and a second reintroduction is planned for the Athens District of the Wayne National Forest [11]. The success of the Ohio reintroduction efforts is unknown but is thought to be limited [23].
MISSOURI. The American burying beetle was extirpated from Missouri in the early 1980s [1]. It has not been relocated despite repeated and recent surveys [12]. A captive breeding population was established at the Monsanto Insectarium, St. Louis Zoo in 2004 (with 10 pairs from Ohio State University) and 2005 (with wild beetles from Arkansas) [7, 15]. Six-hundred-fifty-four adults were produced as of June 2005, 50 of which were transferred to Ohio State University. Plans are being developed to introduce the species to The Nature Conservancy and Missouri Department of Conservation lands. [7].
OKLAHOMA. The presence of American burying beetles has recently been confirmed in 22 eastern Oklahoma counties, reported but unconfirmed in two more, and likely to occur in nine more [16]. The largest known concentrations are a population at Camp Gruber and a smaller one on private timber lands held by Weyerhaeuser International. Captures (not to be confused with population estimates) at Camp Gruber fluctuated around a mean of 213 adults between 1992 and 2003 without discernable trend. Captures at Weyerhaeuser had a mean of 52 adults between 1997 and 2003, but this population collapsed in 2006 and 2007, perhaps due to drought or fire ants [23].
NEBRASKA. The American burying beetle was rediscovered in Nebraska in 1992 [18]. Between 1995 and 1997, nearly 1,000 individuals were trapped or collected in the upland grasslands and cedar tree savannas of the dissected loess hills south of the Platte River in Dawson, Gosper and Lincoln counties of Nebraska. The population is estimated at about 3,000 adults.
SOUTH DAKOTA. The American burying beetle was rediscovered in South Dakota in 1995 and is believed to have a statewide population in excess of 500 adults [17].
ARKANSAS. The American burying beetle was rediscovered in Arkansas in 1992 [3]
KANSAS. The American burying beetle was rediscovered in Kansas in 1997 [19].
TEXAS: The American burying beetle, thought to be extirpated from Texas since the 1930s, was rediscovered in 2003 [3]. Two populations are now known to exist, one on a military base, the other on a Nature Conservancy preserve.
The American burying beetle recovery plan states: "The interim objective [extinction avoidance] will be met when the extant eastern and western populations are sufficiently protected and maintained, and when at least two additional self-sustaining populations of 500 or more beetles are established, one in the eastern and one in the western part of the historical range. Reclassification will be considered when (a) 3 populations have been established (or discovered) within each of four geographical areas (Northeast, Southeast, Midwest, and the Great Lake states), (b) each population contains 500+ adults, (c) each population is self-sustaining for five consecutive years, and, ideally, each primary population contains several satellite populations.”
The beetle remains threatened by the limited availability of carcasses to use for reproduction, by invasive species such as fire ants which compete for carcasses, and by drought and climate change. The Keystone XL pipeline, which would transport tar sands oil from Canada to Texas, is a new threat to the beetle in 2011 and would cut through the core of the beetle's range in South Dakota, Nebraska and Oklahoma.
CITATION
[1] U.S. Fish and Wildlife Service. 1991. American burying beetle (Nicrophorus americanus) recovery plan. Newton Corner, MA.
[2] Sikes, D.S. 2002. A review of hypotheses of decline of the endangered American burying beetle (Silphidae: Nicrophorus americanus Olivier). Journal of Insect Conservation 6: 103–113
[3] Quinn, M. 2006. American Burying Beetle (ABB). Website (http://www.texasento.net/ABB.htm) accessed January 29, 2006.
[4] Peyton, M.M. 1997. Notes on the range and population size of the American Burying beetle (Nicrophorus americanus) in the dissected hills south of the Platte River in central Nebraska. Paper presented at the 1997 Platte River Basin Ecosystem Symposium, Feb. 18-19, 1997 Kearney Holiday Inn Kearney, Nebraska.
[5] Mckenna-Foster, A.A., M.L. Prospero, L. Perrotti, M. Amaral, W.T. Maple, and R.S. Kennedy. 2005. American burying beetle (Nicrophorus americanus) survey and reintroduction to Nantucket, MA, 2004-2005. Abstract presented at the First Nantucket Biodiversity Initiative Conference, September 24, 2005, Coffin School, Egan Institute of Marine Studies, Nantucket, MA.
[6] Amaral, M. 2005. Personal communication with Michael Amaral, U.S. Fish and Wildlife Service, Concord, NH, November 28, 2005.
[7] Homer, P. 2005. Missouri's Threatened and Endangered Species Accomplishment Report: July 1, 2004 - June 30, 2005. Missouri Department of Conservation.
[8] Raithel, C. 2012. American burying beetle, Southwest Block Island trend, 1991-2011. Spreadsheet provided by Christopher Raithel, Rhode Island Dept of Environmental Management, Rhode Island Division of Fish and Wildlife, April 5, 2012.
[9] Ohio Department of Natural Resources, Division of Wildlife. 2005. American Burying Beetle, Nicrophorus americanus. Website (www.dnr.state.oh.us/wildlife/Resources/projects/beetle/beetle.htm) accessed January 28, 2006.
[10] Ohio Department of Natural Resources, Division of Wildlife. 2004-2005 Wildlife Population Status and Hunting Forecast.
[11] Wayne National Forest. 2004. Schedule of Proposed Action, 10-01/04-12/31/04.
[12] Stevens, J. and B. Merz. American Burying Beetle Survey in Missouri. St. Louis Zoo, Department of Invertebrate. Website (http://biology4.wustl.edu/tyson/projectszoo.html) accessed January 29, 2006.
[13] Dabeck, L. 2006. The American Burying Beetle Recovery Program: Saving nature's most efficient and fascinating recyclers. Roger Williams Park Zoo. Website (www.rogerwilliamsparkzoo.org/conservation/burying%20beetle%20program.cfm) accessed January 29, 2006.
[14] Kozol, A. J. 1990. NICROPHORUS AMERICANUS 1989 laboratory population at Boston University: a report prepared for the U.S. Fish and Wildlife Service. Unpublished report.
[15] Stevens, J. 2005. Conservation of the American burying beetle. CommuniQue, September, 2005:9-10.
[16] U.S. Fish and Wildlife Service. 2006. American Burying Beetle (Nicrophorus americanus). U.S. Fish and Wildlife Service. Website (www.fws.gov/ifw2es/Oklahoma/beetle1.htm) accessed January 29, 2006.
[17] South Dakota Game, Fish and Parks. 2006. The American Burying Beetle in South Dakota. Website (www.sdgfp.info/Wildlife/Diversity/ABB/abb.htm) accessed January 29, 2006.
[18] Peyton, M.M. 2003. Range and population size of the American burying beetle (Coleoptera:Silphidae) in the Dissected Hills of South-central Nebraska. Great Plains Research 13(1): 127-138
[19] Miller, E.J. and L. McDonald. 1997. Rediscovery of Nicrophorus americanus Olivier (Coleoptera Silphidae) in Kansas. The Coleopterists' Bulletin 5(1):22.
[20] Mckenna-Foster, A., W.T. Maple, and R.S. Kennedy. 2005. American Burying Beetle (Nicrophorus americanus) survey and reintroduction on Nantucket 2005. Unpublished report.
[21] Perrotti, L. 2006. Roger Williams Park Zoo American Burying Beetle Project Statistics. Spreadsheet provided by Lou Perrotti, American Burying Beetle project coordinator, Roger Williams Park Zoo, Providence, RI, February, 2006.
[22] NatureServe. 2011. American Burying Beetle Species Profile. Available at: http://www.natureserve.org
[23] U.S. Fish and Wildlife Service. 2008. American Burying Beetle (Nicropherus americanus) 5-Year Review Summary and Evaluation. 53 pp.
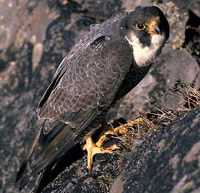
American peregrine falcon (Falco peregrinus anatum)
| Status: Delisted | Critical habitat: 8/11/1977 |
| Listed: 6/2/1970 | Recovery plan: 6/30/1991 |
Range: AL(m), AK(b), AZ(b), AR(m), CA(b), CO(b), CT(b), DE(b), DC(m), GA(b), ID(b), IL(b), IN(b), IA(b), KS(m), KY(b), LA(m), ME(b), MD(b), MA(b), MI(b), MN(b), MS(m), MO(m), MT(b), NE(b), NV(b), NH(b), NY(b), NM(b), NJ(b), NC(b), ND(m), OH(b), OK(m), OR(b), PA(b), RI(b), SC(b), SD(b), TN(b), TX(b), UT(b), VT(b), VA(b), WA(b), WV(m), WI(b), WY(b) ---
SUMMARY
The use of DDT and other organochlorine pesticides thinned American peregrine falcon eggshells, causing reproductive failure and population declines. The banning of DDT, captive-breeding efforts and nest protections allowed falcons to increase from 324 breeding pairs in 1975 to 3,005 pairs as of 2006. The species was delisted in 1999.
RECOVERY TREND
The American peregrine falcon (Falco peregrinus anatum) breeds only in North and Central America and occurs throughout much of North America from the subarctic boreal forests of Alaska and Canada south to Mexico [1]. It is estimated that prior to the 1940s, there were approximately 3,875 nesting pairs of peregrines in North America [1]. From the 1940s through the 1960s, however, the population of the peregrine, and many other raptors, crashed as a result of the introduction of synthetic organochlorine pesticides to the environment. By 1975, there were only 324 known nesting pairs of American peregrine falcons in the U.S. [2].
Scientists investigating the peregrine's decline found unusually high concentrations of the pesticide DDT and its breakdown product DDE in peregrine falcons and other birds of prey [1]. Organochlorine pesticides were put into use following World War II. Use peaked in the late 1950s and early 1960s and continued through the early 1970s [1]. Organochlorine pesticides cause direct mortality and reduced reproduction in birds of prey because they ingest high doses of pesticides concentrated and stored in the fatty tissue of prey animals that themselves ingested contaminated food [1]. Heavily contaminated females may fail to lay eggs and organochlorines passed from the female to the egg can kill the embryo before it hatches [1]. DDE, the principal metabolite of DDT, prevents normal calcium deposition during eggshell formation, causing eggs to frequently break before hatching [1]. During the period of DDT use in North America, eggshell thinning and nesting failures were widespread in peregrine falcons, and in some areas, successful reproduction virtually ceased [1].
The degree of exposure to these pesticides varied among regions, and peregrine falcon numbers in more contaminated areas suffered greater declines [1]. The eastern population plunged from an estimated 350 active nest sites in the 1930s and 1940s to no active breeding birds from 1964 to 1975 [3]. Peregrine falcons in the Great Plains states east of the Rocky Mountains and south of U.S. and Canadian boreal forests were also essentially extirpated [1]. West of the 100th meridian, peregrine falcons were significantly reduced [1]. Local populations were greatly depressed or extirpated and by 1965 fewer than 20 pairs were known west of the U.S. Great Plains [1].
In 1970, the American peregrine was listed as endangered and efforts to recover the species began. The use of DDT was banned in Canada in 1970 and in the United States in 1972 [1]. This was the single-most significant action in the recovery of the peregrine falcon [1]. In addition, in the eastern United States, efforts were made to reestablish peregrine falcons by releasing offspring from a variety of wild stocks that were held in captivity by falconers [1]. The first experimental releases of captive-produced young occurred in 1974 and 1975 in the eastern United States [1]. These and future releases demonstrated that “hacking,” the practice of retaining and feeding young captive bred birds in partial captivity until they are able to fend for themselves, was an effective method of introducing captive-bred peregrines to the wild [1]. Since then, more than 6,000 falcons have been released in North America [1]. Approximately 3,400 peregrines were released in parts of southwest Canada, the northern Rocky Mountain States, and the Pacific Coast states [1].
In the late 1970s, Alaska became the first place American peregrine falcon population growth was documented and, by 1980, populations began to grow in other areas [1]. Not only did the number of peregrine falcons begin to increase, productivity (another important measure of population health) improved [1]. Efforts to reestablish peregrine falcons in the East and Midwest proved largely successful, leading to downlisting of the species in 1984 [1], and by 1999 peregrines were found to be nesting in all states within their historical range east of the 100th meridian, except for Rhode Island, West Virginia and Arkansas [1]. In highly urban areas, peregrine falcons showed great adaptability, and began substituting skyscrapers for natural cliff faces as nesting sites [4]. By 1998, the total known breeding population of peregrine falcons was 1,650 pairs in the United States and Canada, far exceeding the recovery goal of 456 pairs. Other recovery goals, including estimates of productivity, egg-shell thickness, and contaminants levels, had also been met, allowing the species to be delisted in 1999 [1]. Monitoring of American peregrine populations has continued under a post-delisitng monitoring plan [5]. The estimated North American population was 3,005 pairs as of 2006 [6].
ALASKA: Surveys conducted between 1966 and 1998 along the upper Yukon River demonstrated increases in the number of occupied nesting territories from a low of 11 known pairs in 1973 to 46 pairs in 1998 [1]. Similarly, along the upper Tanana River, the number of occupied nesting territories increased from two in 1975 to 33 in 1998 [1]. The recovery objective of 28 occupied nesting territories in the two study areas was first achieved in 1988, with 23 nesting territories on the Yukon River and 12 on the Tanana River [1].
PACIFIC STATES: By 1976, no American peregrine falcons were found at 14 historical nest sites in Washington [1]. Oregon had also lost most of its peregrine falcons and only one or two pairs remained on the California coast [1]. Surveys conducted from 1991 to 1998 indicated a steadily increasing number of American peregrine falcon pairs breeding in Washington, Oregon and Nevada [1]. Known pairs in Washington increased from 17 to 45 and in Oregon from 23 to 51 [1]. The number of American peregrine falcons in California increased from an estimated low of five to 10 breeding pairs in the early 1970s to a minimum of 167 occupied sites in 1998 [1]. The increase in California was concurrent with the restriction of DDT and included the release of more than 750 American peregrine falcons through 1997 [1].
ROCKY MOUNTAINS/SOUTHWEST: The Rocky Mountain/Southwest population of the American peregrine falcon has made a profound comeback since the late 1970s when surveys showed no occupied nest sites in Idaho, Montana or Wyoming and only a few pairs in Colorado, New Mexico and the Colorado Plateau, including parts of southern Utah and Arizona [1]. Surveys conducted from 1991 through 1998 indicated that the number of American peregrine falcon pairs in the Rocky Mountain/Southwest area has steadily increased [1]. In 1991, there were 367 known pairs; in 1998 the number of pairs increased to 535 [1].
EASTERN STATES: The eastern peregrine population has a unique history and complex status under the Act [1]. Peregrine falcons were extirpated in the eastern United States and southeastern Canada by the mid-1960s [1]. Releases of young captive bred peregrines have reestablished populations throughout much of their former range in the East [1]. In 1998, 193 pairs were counted in five designated eastern state recovery units [1]. The number of territorial pairs recorded in the eastern peregrine falcon recovery area increased an average of 10 percent annually between 1992 and 1998 [1]. Equally important, the productivity of these pairs during the same seven-year period averaged 1.5 young per pair, demonstrating sustained successful nesting [1].
CITATIONS
[1] U.S. Fish and Wildlife Service. 1999. Final Rule to Remove the American Peregrine Falcon from the Federal List of Endangered and Threatened Wildlife, and to Remove the Similarity of Appearance Provision for Free-Flying Peregrines in the Conterminous United States. Federal Register (64 FR 46542).
[2] Hoffman, C. 1999. The Peregrine Falcon is Back! New release, U.S. Fish and Wildlife Service, August 20, 1999.
[3] Clark, K. 2005. The Peregrine Falcon in New Jersey, Report for 2005. New Jersey Department of Environmental Protection, Division of Fish and Wildlife, Endangered and Nongame Species Program.
[4] New Jersey Division of Fish and Wildlife. Fact sheet, Peregrine Falcon Falco pereginus. New Jersey Department of Environmental Protection, Division of Fish and Wildlife, Endangered and Nongame Species Program. Website <http://www.njfishandwildlife.com/tandespp.htm> accessed February, 2006.
[5] U.S. Fish and Wildlife Service. 2003. Monitoring Plan for the American Peregrine Falcon, A Species Recovered Under the Endangered Species Act. U.S. Fish and Wildlife Service Division of Endangered Species and Migratory Birds and State Programs. Pacific Region, Portland Oregon 53pp.
[6] Green, M., T. Swem, M. Morin, R. Mesta, M. Klee, K. Hollar, R. Hazelwood, P. Delphey, R. Currie, and M. Aramal. 2006. Monitoring Results for Breeding American Peregrine Falcons (Falco peregrinus anatum), 2003. Biological Technical Publication BTP-R1005-2006. U.S. Department of Interior, Washington, D.C.
Arctic peregrine falcon (Falco peregrinus tundrius)
| Status: Delisted | Critical habitat: none | Listed: 6/2/1970 | Recovery plan: 6/30/1991 |
Range: AL(m), AK(b), AZ(m), AR(m), CA(m), CO(m), CT(m), DE(m), DC(m), FL(m), GA(m), ID(m), IL(m), IN(m), IA(m), KS(m), KY(m), LA(m), ME(m), MD(m), MA(m), MI(m), MN(m), MS(m), MO(m), MT(m), NE(m), NV(m), NH(m), NY(m), NM(m), NJ(m), NC(m), ND(m), OH(m), OK(m), OR(m), PA(m), RI(m), SC(m), SD(m), TN(m), TX(m), UT(m), VT(m), VA(m), WA(m), WV(m), WI(m), WY(m) ---
SUMMARY
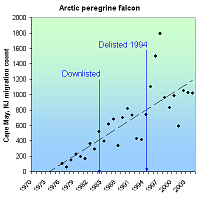
The Arctic peregrine falcon declined due to the egg shell-thinning effects of DDT and other organochlorine pesticides. Its listing as an endangered species in 1970 (along with other birds of prey) prompted the EPA to ban DDT in 1972. Counts of migratory Arctic falcons increased from 103 in 1976, to 1,017 in 2004. The species was downlisted to threatened in 1984 and delisted in 1991.
RECOVERY TREND
The Arctic peregrine falcon (Falco peregrinus tundrius) is one of three peregrine falcon subspecies [1]. It nests in tundra regions of Alaska, Canada (Yukon, Northwest Territories, Quebec, and possibly Labrador), and the ice-free perimeter of Greenland [1]. It is a long-distance migrant that winters in Latin America from Cuba and Mexico south through Central and South America [1].
Severe declines in peregrine falcon numbers began in the 1950s [1]. These declines were linked to organochlorine pesticides that were put into use following World War II, and whose use peaked in the late 1950s-early 1960s [1]. Scientists investigating the peregrine's decline found unusually high concentrations of the pesticide DDT and its breakdown product DDE in peregrine falcons and other birds of prey [2]. Organochlorine pesticides cause direct mortality and reduced reproduction in birds of prey which, being at the top of the food chain, ingest high doses of pesticides concentrated and stored in the fatty tissue of prey animals that themselves ingested contaminated food [1]. Heavily contaminated females may fail to lay eggs and organochlorines passed from the female to the egg can kill the embryo before it hatches. DDE, the principal metabolite of DDT, prevents normal calcium deposition during eggshell formation, causing eggs to frequently break before hatching [1]. Arctic peregrine numbers reached their lowest levels in the early 1970s and in some areas of North America successful reproduction virtually ceased [1]. Populations are thought to have decreased by as much as 80 percent [2].
The listing of the Arctic peregrine falcon as endangered in 1970--as well as the bald eagle, brown pelican, and American peregrine falcon shortly before--fostered a national outcry against the production and spaying of DDT. In 1972, the Environmental Protection Agency banned most used of DDT in the United States [1]. Canada had already restricted DDT use in 1970. These restrictions are the central cause of the recovery of the Arctic and American peregrine falcons (the bald eagle and brown pelican benefited greatly as well, but their recovery also involved substantial habitat protections and reintroductions).
As DDT levels declined after 1972, peregrine falcon productivity rates rose to pre-DDT levels and the population size and range began to increase. This happened most rapidly in northern areas, where pesticide exposur was lower and impacts upon populations were less severe [1]. In 1984, the U.S. Fish and Wildlife Service downlisted the Arctic peregrine falcon from endangered to threatened status [2, 6]. In 1991, the agency initiated a review determine if the species had recovered [2] and in 1994 removed it from the endangered species list [6].
Four major factors were considered in the delisting process: (1) Population size and trend, (2) reproductive performance, (3) pesticide residues in eggs, and (4) eggshell thickness [1]. Despite a lack of long-term studies using consistent methodologies, there was strong evidence of significant population increases throughout the Arctic [1]. Four areas in northern North America (one in Alaska and three in Canada’s North West Territories) for which historical survey information was available indicated the number of Arctic peregrine pairs occupying nesting territories increased since the 1960s [1]. Some areas of Alaska even exceeded the original estimates of pre-DDT-era population size [1]. In addition, in the eastern Arctic, peregrines began nesting in previously vacant nesting sites [1]. Standardized yearly migration counts at New Jersey’s Cape May, an area where Arctic peregrines concentrate during migration, also saw increasing numbers, most likely from Arctic breeding grounds especially in Greenland and eastern Canada (these counts may have also contained peregrines in the American subspecies; however, banding recoveries indicate that the majority of peregrines along the East Coast during fall migration are from the Arctic and thus represent a true increase in Arctic peregrine numbers) [1].
Productivity in all regions where data had been gathered was sufficient to support a stable or increasing population since the 1980s [1]. There had also been improvements in levels of DDE concentration in eggs. Concentrations in excess of 15-20 parts per million (wet weight basis) are associated with high rates of nesting failure. Residue in eggs in 1993 was well below this critical level [1]. Alaskan eggshells collected between 1988 to 1991 were on average only 12 percent thinner than pre-DDT thickness (17 percent or greater reduction in thickness results in population declines).
Arctic peregrine falcon numbers have continued to rise after the species' delisting. On the Sagavanirktok River in Alaska, where Arctic peregrine surveys have been conducted since the late 1950s, the number of pairs increased from five in 1958, to 23 in 1992, to 25 in 1999 [3]. Migration counts at the Cape May Hawkwatch site in New Jersey increased from 103 in 1976 to 1,024 in 2003 [4].
CITATIONS
[1] U.S. Fish and Wildlife Service. 1993. Proposal to Remove the Arctic Peregrine Falcon From the List of Endangered and Threatened Wildlife. 58 Fed. Reg 188.
[2] U.S. Fish and Wildlife Service. 1995. Peregrine falcon, (Falco peregrinus anatum, Falco peregrinus tundrius, Falco peregrinus pealei). Species account. Website <http://www.fws.gov/species/species_accounts/bio_pere.html> accessed October, 2005.
[3] Wright, J.M. and P.J. Bente. 1999. Documentation of active peregrine falcon nest sites, 1 Oct 1994- 31 March 1998. Alaska Department of Fish and Game. Annual research report. Endangered species conservation fund federal aid project SE-2-9, 10, and 11. Juneau, AK. 15 pp.
[4] Cape May Bird Observatory. 2012. Cape May Hawkwatch, Cape May, New Jersey. New Jersey Audubon Society. Website <http://www.njaudubon.org/Sightings/cmhw25.html> accessed April 2, 2012.
[5] NatureServe. 2011. NatureServe’s Central Databases. Arlington, VA. U.S.A
[6] U.S. Fish and Wildlife Service. 1994. Removal of Arctic Peregrine Falcon From the List of Endangered and Threatened Wildlife. 59 Fed. Reg. 50796.
Atlantic green sea turtle (Chelonia mydas mydas)
| Status: Threatened/Endangered | Critical habitat: 9/2/1998 | Listed: 7/28/1978 | Recovery plan: 5/18/1999 |
Range: AL(s), CT(s), DE(m), FL(b), GA(b), LA(s), MA(s), MS(s), NY(s), NJ(s), NC(b), PR(b), RI(s), SC(b), TX(s), VI(b), VA(m) ---
SUMMARY
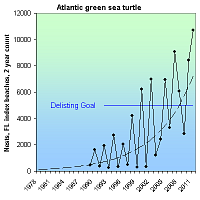
The Atlantic green sea is threatened by egg collection, hunting, vandalism, disturbance while nesting, beach development, habitat loss, and sea level rise. Its population has increased in the United States since being listed as endangered in 1978, but systematic surveys only began in 1989. It grew by 2,206% in Florida between 1989 and 2011 (464 to 10,701) and has achieved its population size recovery goal.
RECOVERY TREND
The green sea turtle (Chelonia mydas) occurs throughout the tropical and subtropical waters of the Mediterranean, Atlantic, Pacific and Indian oceans, and as far north as Massachusetts [1, 2]. It migrates enormous distances between foraging and nesting areas [2]. When not migrating, the green sea turtle’s typical near-shore habitat includes shallow waters inside bays, reefs and inlets [1]. Most nesting occurs on minimally disturbed open beaches [3]. Females generally breed every two or more years, and nest an average of three to four times per breeding year [4].
Exploitation of the green sea turtle, its eggs and its habitat resulted in population declines [1]. Although green sea turtle populations continue to decline throughout much of their range due to directed harvest (both illegal and legal), incidental capture in near-shore gillnets, and negative impacts on essential habitats [1], two populations that nest in the United States (Florida and Hawaii) have increased in size since the species was placed on the endangered list in 1978 [3].
Green sea turtle populations in the U.S. Atlantic occur from Massachusetts to Texas and the Caribbean [1, 2]. In the U.S. Pacific, green sea turtles occur from the mainland coast to Hawaii, Guam and the Mariana Islands [1, 2]. Atlantic green sea turtles are variously considered a population and a subspecies (Chelonia mydas mydas) [1]. In the U.S. Atlantic, nesting occurs primarily on beaches along Florida’s east coast, although smaller numbers of nests can be found in North Carolina, South Carolina, Georgia, the U.S. Virgin Islands and Puerto Rico [5]. Foraging occurs in the Gulf of Mexico to Texas and along the Atlantic Coast to Massachusetts [1].
CARIBBEAN
Reliable, long-term nesting data are unavailable for Puerto Rico and the Virgin Islands [8]. The number of green turtle nests has remained low for all the islands, but there appears to have been a gradual increase in the numbers of juveniles observed in foraging grounds since the mid-1970s [8]. The largest concentration of nests occurs on St. Croix, where an average of 100 were counted per year between 1980 and 1990. Waters surrounding the island of Culebra, Puerto Rico have been designated critical habitat [1].
FLORIDA
State-wide population counts have been conducted in Florida since the 1970s, but are not strictly controlled for survey effort and area, especially in the early years. Thus while it is known that Florida's nesting green sea turtle population has increased since the 1970s, it is not possible to determine by how much. Standardized surveys on a large number of "index beaches" was initiated in 1989. They demonstrate that the number of annual green sea turtle nests increased by 2,206% between 1989 and 2011 (464 to 10,701) [4].
The number of green sea turtle nests in Florida (and in many other places), generally alternates between high and low years. Between 1989 and 2001, the number of nests in low years remained flat (250-500). Between 2003 and 2011 it grew sharply. Nesting in high years grew throughout 1989-2011, but more sharply starting in 1998.
An unusually low count in 2004 was caused by a hurricane. The biennial cycle was broken in 2009 and 2011, resulting in the highest recorded count in what should have been a low year (2011 = 10,701). It is possible to predict at this point if 2012 will be a high or low year.
NORTHERN STATES
Each winter green, Kemps Ridley and loggerhead sea turtles migrating southward from northeastern waters are regularly stranded on shores of Cape Cod Bay between Brewster and Truro [7]. These turtles die of hypothermia if not rescued. The total number of strandings ranged between 49 and 281 turtles between 1995 and 2003. Green sea turtle strandings ranged from zero to seven each year [7]. A volunteer program has been established to rescue, rehabilitate and release the turtles in Florida.
In 2005, the first verified green sea turtle nest was found in Virginia. A few females previously had laid eggs on beaches as far north as North Carolina's Outer Banks [10].
RECOVERY PLAN
In order for the green sea turtle to be delisted, the 1991 federal recovery plan requires that Florida supports an average of 5,000 nests over six consecutive years [1]. This criterion was met in 2009, 2010, and 2011 on the index beaches. As these are a subset of all nesting beaches, the delisting criteria was met in at least all years between 2007 and 2011.
The recovery plan also requires that 2) at least 105 kilometers of nesting beach be in public ownership and support at least 50 percent of U.S. nests, and 3) a reduction in stage-class mortality results in an increase in individuals in foraging grounds [1].
CITATIONS
[1] U.S. Fish and Wildlife Service. 1991. Recovery Plan for U.S. Populations of Atlantic Green Turtle. Washington, DC.
[2] Plotkin, P.T. (editor). 1995. National Marine Fisheries Service and U. S. Fish and Wildlife Service Status Reviews for Sea Turtles Listed under the Endangered Species Act of 1973. Silver Spring, Maryland.
[3] U.S. Fish and Wildlife Service. 2004. Green Sea Turtle (Chelonia mydas). U.S. Fish and Wildlife Service, North Florida Office. Website (http://www.fws.gov/northflorida/SeaTurtles/Turtle%20Factsheets/Green-Sea-Turtle.htm) accessed January, 2006.
[4] Florida Fish and Wildlife Conservation Commission. 2012. Index Nesting Beach Survey Totals (1989-2011). Available at (http://myfwc.com/research/wildlife/sea-turtles/nesting/beach-survey-totals/, accessed May, 2012).
[5] National Marine Fisheries Service. Green Sea Turtle (Chelonia mydas). Threatened Species Account. Endangered Florida and Mexican Breeding Populations. NOAA Fisheries, Office of Protected Resources. Silver Spring, MD. Website (http://www.nmfs.noaa.gov/pr/species/turtles/green.html) accessed January, 2006.
[6] Fish and Wildlife Research Institute. 2006. Florida's index nesting beach survey data. Fish and Wildlife Research Institute, Florida Fish and Wildlife Conservation Commission,. Website (http://research.myfwc.com/features/view_article.asp?id=10690) accessed January, 2006.
[7] Lewis, D. Photo diary of a terrapin researcher. Website (http://terrapindiary.org/) accessed January 7, 2006.
[8] Hillis-Starr, Z.M., R. Boulon, M. Evans. Sea turtles in the Virgin Islands in Status and trends of the Nation's Biological Resources, USGS. Available at (http://biology.usgs.gov/s+t/SNT/noframe/cr136.htm, accessed January, 2006.)
[9] Orlando Sentinel. August 6, 2005. Green Sea Turtle makes odd egg-laying visit to Virginia. Page A20.
Atlantic hawksbill sea turtle (Eretmochelys imbricata imbricata)
| Status: Endangered | Critical habitat: 9/2/1998 | Listed: 6/2/1970 | Recovery plan: 5/18/1999 |
Range: AL(s), CT(o), DE(o), FL(b), GA(o), LA(s), MD(o), MA(o), MS(s), NY(o), NJ(o), NC(o), PR(b), RI(o), SC(o), TX(s), VI(b), VA(o) ---
SUMMARY
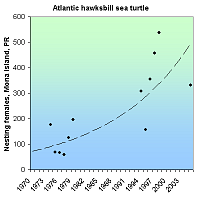
Globally, the number of hawksbill sea turtles may have declined by as much as 80 percent over the past century due to commerce in their shells, poaching, habitat loss, bycatch and entanglement in marine debris. Although hawksbill numbers continue to decline globally, at protected beaches on Mona Island, Puerto Rico, nests increased from 177 in 1974 to 332 in 2005.
RECOVERY TREND
Hawksbill sea turtles (Eretmochelys imbricatause) use different habitats at different stages of their life cycle [1]. Post-hatchling hawksbills occupy pelagic environments, taking shelter in weedlines that accumulate at convergence zones [1]. They reenter coastal waters when they reach approximately 20 to 25 centimeters carapace length [1]. Coral reefs are used as resident foraging habitat by juveniles, subadults and adults [1]. Along the eastern shores of continents where coral reefs are absent, hawksbills are known to inhabit mangrove-fringed bays and estuaries [1]. They feed primarily on sponges [1, 2]. Female hawksbills nest on low- and high-energy beaches of tropical oceans. Throughout their range, hawksbills typically nest at low densities with aggregations consisting of a few dozen, or at most a few hundred individuals [1]. Nests have been found on both insular and mainland beaches where nests are typically placed under vegetation [1]. Migratory patterns of hawksbills are not well known, although a reproductive migration is thought to take place [1, 2].
Hawksbills occur in tropical and subtropical seas of the Atlantic, Pacific and Indian oceans and nest on beaches in at least 60 different nations [3]. Along the eastern and Gulf coasts of the continental U.S., hawksbills have been reported by all of the Gulf states and from as far north as Massachusetts, although sightings north of Florida are rare [1]. Representatives of at least some life-history stages regularly occur in southern Florida (where the warm Gulf Stream current passes close to shore) and the northern Gulf of Mexico (especially Texas), in the Greater and Lesser Antilles, and along the Central American mainland south to Brazil [1].
The largest remaining concentrations of nesting hawksbills occur on the beaches of remote oceanic islands of Australia and the Indian Ocean [1]. The Yucatan Peninsula in Mexico also supports a significant population of nesting hawksbills [1]. Within U.S. jurisdiction, nesting occurs principally on beaches in Puerto Rico and the U.S. Virgin Islands [1]. The most important nesting sites are Mona Island (Puerto Rico) and Buck Island (St. Croix, U.S. Virgin Islands) [1]. Within the continental United States, nesting is restricted to the southeastern coast of Florida and the Florida Keys, where one or two nests have been reported annually [1].
Quantitative data on population changes of hawksbills are scarce, in part because hawksbills were already greatly reduced in number when scientific studies of sea turtles began in the late 1950s [3]. In addition, visual evidence of hawksbill nesting is the least obvious among the sea turtle species, because hawksbills often select remote pocket beaches with little exposed sand to leave traces of revealing crawl marks [1]. An estimate of the minimum number of female hawksbills in 1989 indicated that at least 15,000 to 25,000 female hawksbills nested annually worldwide [4]. Although global numbers are very difficult to estimate, it appears that this turtle has suffered drastic decline, probably by as much as 80 percent over the last century (3). Only five regional populations, Seychelles, Mexico, Indonesia, and two in Australia, support more than 1,000 nesting females annually [3]. Hawksbill populations are either known or suspected to be declining in 38 of the 65 geopolitical units for which nesting density estimates are available [3].
CARIBBEAN
Hawksbill populations in the Western Atlantic-Caribbean region are thought to be greatly depleted [3]. In the Caribbean region, the number of females nesting annually is about 5,000 (order-of-magnitude estimate) [3]. With few exceptions, all of the countries in the Caribbean report fewer than 100 females nesting annually [3]. The largest known nesting concentrations are in the Yucatan Peninsula of Mexico [3]. These populations may be increasing [3]. A total of 4,522 nests were recorded in the states of Campeche, Yucatán and Quintana Roo in 1996, compared to only a few hundred in the early 1980s [5].
In the U.S Caribbean, there is evidence that hawksbill nesting populations have been severely reduced during the 20th century [1]. Estimates of the size of nesting populations under U.S. jurisdiction are available for only a few localities [1]. Although trends are uncertain due to long intervals between hawksbill nesting generations (hawksbill take between 30 and 40 years to reach sexual maturity) and fluctuations in the number of reproductive females that nest in a particular year [3], hawksbill numbers increased at two protected locations, Mona Island, Puerto Rico and at Buck Island Reef National Monument, U.S. Virgin Islands [5]. The number of nests on Mona Island increased from 177 in 1974 to 332 in 2005 [5, 6]. On Buck Island, the number of nesting females increased from 73 in 1987 to 121 in 1998, and averaged 56 from 2001-2005 [5, 6].
International commerce in hawksbill shell (“tortoiseshell” or “bekko”) may be the most significant factor endangering hawksbill populations worldwide [1]. Despite protective legislation, international trade in tortoiseshell and subsistence use of meat and eggs continues in many countries [1]. Females and eggs are vulnerable to poaching on nesting beaches and nests are vulnerable to beach erosion [1]. Egg poaching is a serious problem in Puerto Rico and also occurs in the U.S. Virgin Islands [1]. The practice of beach armoring can prevent females from reaching suitable nesting sites and can result in the loss of dry nesting beaches [1, 2]. Many hawksbill nesting beaches in the Caribbean are privately owned and in jeopardy of being developed [1]. Sand mining is also a threat to nesting beaches throughout the Caribbean [1]. The extent to which hawksbills are killed or debilitated after becoming entangled in marine debris has not been quantified, but it is believed to be a serious and growing problem [1]. Incidental catch in finfish fisheries may also pose a serious threat and the ingestion of marine debris (i.e. plastic bags, styrofoam) can result in hawksbill mortality [1].
CITATIONS
[1] National Marine Fisheries Service and U.S. Fish and Wildlife Service. 1993. Recovery Plan for Hawksbill Turtles in the U.S. Caribbean Sea, Atlantic Ocean, and Gulf of Mexico. St. Petersburg, Florida.
[2] National Marine Fisheries Service and U.S. Fish and Wildlife Service. 1998. Recovery Plan for U.S. Pacific Populations of the Hawksbill Turtle (Eretmochelys imbricata). Silver Spring, MD.
[3] Meylan, A.B. and M. Donnelly. 1999. Status Justification for Listing the Hawksbill Turtle (Eretmochelys imbricata) as Critically Endangered on the 1996 IUCN Red List of Threatened Animals. Chelonian Conservation and Biology. 3(2):200–224.
[4] NatureServe. 2005. NatureServe’s Central Databases. Arlington, VA. U.S.
[5] Meylan. 1999. Status of the Hawksbill Turtle (Eretmochelys imbricata) in the Caribbean Region. Chelonian Conservation and Biology 3(2):177–184. Available at (http://www.iucn-mtsg.org/publications/cc&b_april1999/4.14-Meylan-Status.pdf).
[6] U.S. Fish and Wildlife Service. 2012. Hawksbill Sea Turtle (Eretmochelys imbricata) Fact Sheet. Available at: http://www.fws.gov/northflorida/SeaTurtles/Turtle%20Factsheets/PDF/Hawksbill-Sea-Turtle.pdf
Atlantic leatherback sea turtle (Dermochelys coriacea (Atlantic population))
| Status: Endangered | Critical habitat: 3/23/1979 | Listed: 6/2/1970 | Recovery plan: 5/18/1999 |
Range: CT(s), DE(s), FL(b), GA(b), ME(s), MD(s), MA(s), NH(s), NY(s), NJ(s), NC(b), PR(b), RI(s), SC(b), VI(b), VA(s) ---
SUMMARY
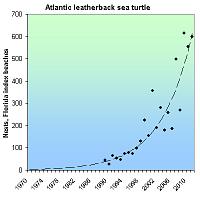
The Atlantic leatherback sea turtles declined due to habitat destruction, commercial fishery bycatch, harvest of eggs, hunting of adults, and loss of beach nesting habitat. It is still threatened by these, and in some places by offshore oil drilling. Globally, leatherback sea turtles have been declining for decades. U.S. populations, however, have increased since being listed as endangered in 1970. Between 1989 and 2011, nests at Florida core index beaches increased from 27 to 615.
RECOVERY TREND
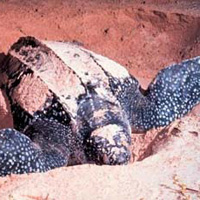
The leatherback sea turtle (Dermochelys coriacea), the largest living turtle species, is a monotypic genus [1]. It is typically associated with continental shelf habitats and pelagic environments. Adult leatherbacks feed primarily on jellyfish in temperate and boreal latitudes, are highly migratory and have the most extensive range of any extant reptile [1]. Although their oceanic distribution is nearly worldwide, the number of nesting sites is few [3]. Gravid females emerge onto beaches to excavate nests and lay eggs. They prefer high-energy beaches with deep, unobstructed access, which occur most often along continental shorelines [2].
In the western Atlantic, leatherbacks nest from North Carolina to southern Brazil [4]. In U.S. waters, leatherbacks can be found along the East Coast from Maine to Florida, and in the Greater and Lesser Antilles [6]. Critical habitat has been designated as the nesting beaches and adjacent waters of Sandy Point, St. Croix, U.S. Virgin Islands [2]. The Pacific population does not nest in the United States or its territories, but has important foraging areas on the West Coast and near Hawaii [1].
Although Atlantic leatherback populations under U.S. jurisdiction have increased in size since 1970, worldwide their numbers are decreasing. Leatherback numbers have declined in Mexico, Costa Rica, Malaysia, India, Sri Lanka, Thailand, Trinidad, Tobago and Papua New Guinea [7]. In 1980 there were more than 115,000 adult female leatherbacks worldwide. In 2005, there were less than 25,000 [6]. The most precipitous declines have occurred in the Pacific Ocean [5]. One study estimated that the number of females in the eastern Pacific decreased from 91,000 in 1980 to 1,690 in 2000 [7]. The number of leatherback nests has also declined at all major nesting beaches throughout the Pacific [6]. Nesting along the Pacific coast of Mexico, which is estimated to represent about 50 percent of all nesting, declined at an annual rate of 22 percent over the last 12 years [6].
CARIBBEAN
In the western Atlantic and Caribbean, the largest nesting assemblages are found in the U.S. Virgin Islands, Puerto Rico and Florida. Nesting data for these locations have been collected since the early 1980s [6]. Nest numbers in Florida as well as on St. Croix, U.S. Virgin Islands, and Culebra Island, Puerto Rico, increased over the past 20 years [8]. At St. Croix, the number of nests deposited annually on Sandy Point National Wildlife Refuge, the largest nesting rookery in U.S. territory, ranged from 82 in 1986 to 260 in 1991 [2]. From 1979 on, the trend indicates a 7.5 percent increase per year (SE = 0.014).
FLORIDA
In Florida, several models estimated trends indicating a 9.1 percent increase per year (SE = 0.049) [2]. Florida has established counts on beaches used as "index beaches" where standardized counts have been conducted, allowing for more accurate comparisons between years and between beaches. From 1989 through 2011, leatherback nests at core index beaches numbered from 27 to 615 [9].
Habitat destruction, incidental catch in commercial fisheries, harvest of eggs and flesh, and offshore oil drilling continue to threaten to the survival of the Atlantic leatherback [6]. Entanglement and ingestion of marine debris, including abandoned nets, also pose a threat [1]. Artificial lights on nesting beaches can result in mortality in hatchling turtles by causing newly emerged hatchlings to become disoriented [1]. Eggs can also be lost to beach erosion. At Sandy Point NWR, 40 percent to 60 percent of the eggs laid each year would be lost to erosion if not for human intervention [2]. Because leatherbacks nest in the tropics during hurricane season, there is also potential for storm-related loss of nests. In 1980, only four out of approximately 80 nests laid on Sandy Point NWR survived to hatch following the catastrophic effects of Hurricane Allen [2]. Finally, there is a growing concern that essential beach nesting habitat will be innundated by global warming-induced sea level rise.
CITATIONS
[1] National Marine Fisheries Service and U.S. Fish and Wildlife Service. 1998. Recovery Plan for U.S. Pacific Populations of the Leatherback Turtle, (Dermochelys coriacea). Silver Spring, MD. 66pp.
[2] National Marine Fisheries Service and U.S. Fish and Wildlife Service. 1992. Recovery Plan for Leatherback Turtles, (Dermochelys coriacea) in the U.S. Caribbean, Atlantic and Gulf of Mexico. Washington, D.C.1992. 60 pp + appendices.
[3] NatureServe. 2005. NatureServe’s Central Databases. Arlington, VA. U.S.A.
[4] Rabon, D. R. Jr., S. A. Johnson, R. Boettcher, M. Dodd, M. Lyons, S. Murphy, S. Ramsey, S. Roff, and K. Stewart. 2003. Confirmed Leatherback Turtle (Dermochelys coriacea) Nests from North Carolina, with a Summary of Leatherback Nesting Activities North of Florida. Marine Turtle Newsletter 101:4-8.
[5] NOAA Fisheries. 2001. Stock Assessment of Leatherback Sea Turtles of the Western North Atlantic.
[6] NOAA Fisheries. 2005. Leatherback Sea Turtle {Dermochelys coriacea). Website (http://www.nmfs.noaa.gov/pr/species/turtles/leatherback.html) accessed December, 2005.
[7] Kaplan, I.C. 2005. A Risk Assessment for Pacific Leatherback Turtles (Dermochelys coriacea). Canadian Journal of Fisheries and Aquatic Sciences. 62(8):1710-1719.
[8] Endangered Species Technical Bulletin 22(3):25.
[9] Florida Fish and Wildlife Conservation Commission Research Institute. 2012. Index Nesting Beach Survey Totals (1989-2011). Available online at http://myfwc.com/research/wildlife/sea-turtles/nesting/beach-survey-totals/. Accessed April 2, 2012.
Atlantic piping plover (Charadrius melodus (Atlantic DPS))
| Status: Endangered | Critical habitat: 7/10/2001 | Listed: 12/11/1985 | Recovery plan: 5/18/1999 |
Range: AL(s), CT(b), DE(b), FL(s), GA(s), LA(s), ME(b), MD(b), MA(b), MS(s), NH(b), NY(b), NJ(b), NC(b), PR(s), RI(b), SC(b), TX(s), VA(b) ---
SUMMARY
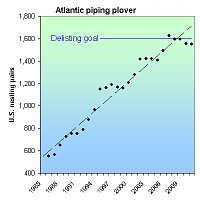
Atlantic piping plover populations initially declined due to hunting and the millinery trade. With these eliminated, it increased in the first half of the 20th century, but began declining after 1950 due to development, beach crowding and predation. It was listed as 1985 after which intensive habitat protection and control of recreationists and predators, increased its U.S. population from 550 pairs in 1986 to 1,550 in 2011, reaching its overall U.S. recovery goal in 3 of the last 5 years.
RECOVERY TREND
The Atlantic piping plover (Charadrius melodus) breeds on Atlantic coastal beaches from Newfoundland to northernmost South Carolina [1]. Hunters and the millinery trade decimated the species in the late 19th and early 20th centuries, but were stopped by the Migratory Bird Treaty Act of 1918. The plover steadily recovered until about 1950, then began to decline again under pressure from development, beach stabilization programs, increased recreation, and anthropogenically caused increases in predation by native and introduced species.
Following its listing as an endangered species in 1985, the plover was subject to intense nest site, nest area, and predator management programs, resulting in the following population growth between 1986 and 2011 [1, 2, 3]:
POPULATION 1986-2011 GROWTH RECOVERY GOAL YEARS AT RECOVERY GOAL
Canada: 240 - 209 pairs 400 pairs 0
New England 184 - 825 pairs 625 pairs At least 100% of goal, last 14 years
New York/New Jersey: 208 - 431 pairs 575 pairs At least 90% of goal, 6 of last 9 years
South Atlantic: 158 - 294 pairs 400 pairs 0
U.S. population: 550 - 1,550 pairs 1,600 pairs At least 100% of goal, 3 of last 5 years
Total: 790 - 1,759 pairs 2,000 pairs At least 87% of goal, last six years
The 1996 federal recovery plan [1] established the following delisting criteria: 1) Increase and maintain for five years a total of 2,000 breeding pairs, distributed among four recovery units as follows: Canada, 400 pairs; New England, 625 pairs; New York-New Jersey, 575 pairs; Southern (DE-MD-VA-NC), 400 pairs. 2) Verify the adequacy of a 2,000-pair population of piping plovers to maintain heterozygosity and allelic diversity over the long term. 3) Achieve five-year average productivity of 1.5 fledged chicks per pair in each of the four recovery units described in criterion 1, based on data from sites that collectively support at least 90 percent of the recovery unit’s population. 4) Institute long-term agreements to assure protection and management sufficient to maintain the population targets and average productivity in each recovery unit. 5) Ensure long-term maintenance of wintering habitat, sufficient in quantity, quality and distribution to maintain survival rates for a 2,000-pair population.
- The New England unit exceeded its recovery plan goal of 625 nesting pairs each of the 14 years between 1998 and 2011 and cointinues to grow.
- The New York/New Jersey unit grew steadily from 1986 to 2007, the only year in which it reached its recovery plan goal. It declined in all years from 2008 to 2011. While it has been at at least 90% of its goal in six of the nine years ending in 2011, the recent declines are worrisome.
- The Southern recovery unit was relatively stable betwee 1986 and 2003, grew rapidly between 2004 and 2008, then remained relatively stable at a reduced level from 2009 to 2011. It has never reached its recovery goal and has always been the smallest and slowest growing of the three U.S. recovery units.
- The U.S. population as a whole had strong, steady growth between 1986 and 2007, increasinging from 550 to 1,624 pairs. 2007 was the first year it reached its recovery goal of 1,600 pairs. From 2009 to 2011, it declined slightly to 1,550 pairs. The U.S. trend is dominated by the New England recovery unit which is the largest, fastest and most consistently growing.
- The Canadian recovery unit has periods of growth and decline, but remained at 200-250 nesting pairs in almost all years between 1986 and 2011. It the smallest of all the recovery units and the only one not to have experienced net growth since 1986.
CITATIONS
[1] U.S. Fish and Wildlife Service. 1996. Piping Plover (Charadrius melodus), Atlantic Coast Population, Revised Recovery Plan. Hadley, Massachusetts. 258 pp.
[2] U.S. Fish and Wildlife Service. 2011. Abundance and productivity estimates – 2010 update: Atlantic Coast piping plover population. Sudbury, MA. Available at http://www.fws.gov/northeast/pipingplover/pdf/Abundance&Productivity2010Update.pdf
[3] U.S. Fish and Wildlife Service. 2012. Preliminary 2011 Atlantic Coast Piping Plover Abundance and Productivity Estimates, March 20, 2012. Sudbury, MA. Available at http://www.fws.gov/northeast/pipingplover/preliminary2011%2020March2012%20for%20AC%20website.pdf
[5] U.S. Fish and Wildlife Service. 2009. Piping Plover (Charadrius melodus) 5-Year Review: Summary and Evaluation. 214 pp.
Bald eagle (continental U.S. DPS) (Haliaeetus leucocephalus (Continental U.S. DPS))
| Status: Delisted | Critical habitat: none | Listed: 3/11/1967 | Recovery plan: 5/18/1999 |
Range: AL(b), AZ(b), AR(b), CA(b), CO(b), CT(b), DE(b), DC(b), FL(b), GA(b), ID(b), IL(b), IN(b), IA(b), KS(b), KY(b), LA(b), ME(b), MD(b), MA(b), MI(b), MN(b), MS(b), MO(b), MT(b), NE(b), NV(b), NH(b), NY(b), NM(b), NJ(b), NC(b), ND(b), OH(b), OK(b), OR(b), PA(b), RI(b), SC(b), SD(b), TN(b), TX(b), UT(b), VT(b), VA(b), WA(b), WV(b), WI(b), WY(b) ---
SUMMARY
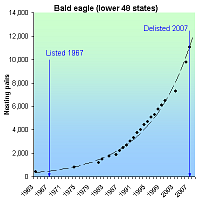
The bald eagle declined throughout the lower 48 states, and was extirpate from most of them due to habitat loss, persecution, and DDT-related eggshell thinning. The banning of DDT, increased wetland protection and restoration, and an aggressive, mostly state-based reintroduction program caused eagle pairs to soar from 416 in 1963 to 11,052 in 2007 when the eagle was removed from the endangered list.
RECOVERY TREND
The bald eagle (Haliaeetus leucocephalus) first declined in the 1800s at the hands of trophy hunters, feather collectors, and wanton killing [1]. It was already extirpated or at low numbers in most states by the 1940s when DDT and other organochlorines became widely used. DDE, a breakdown product of DDT, accumulates in the fatty tissue of female eagles, impairing the formation of calcium needed for normal egg formation, causing a decline in reproductive success. DDT caused eagle numbers plummet further, and in 1967 the species was listed as endangered in the lower 48 states [1].
The eagle was joined on the list by the American peregrine falcon, Arctic peregrine falcon and brown pelican in 1970. The listing of these large, charismatic birds rallied the nation to band the production and sale of DDT in 1972.
Due to the DDT ban, increased habitat protection, and aggressive captive breeding and translocation programs (mostly run by state wildlife agencies), bald eagle pairs in the lower 48 soared from 416 in 1963 to 11,052 in 2007 when it was removed from the threatened species list [2, 7]. In 1984, 13 states lacked nesting eagles. By 1998, it was absent from only two. By 2006, it nested in all 48 states [7].
The eagle was proposed for delisting in 1998 [1] and again in 2006 [4]. It was downlisted in 1995 and delisted in 2007 [6].
The bald eagle is managed under five federal recovery plans, divided by region:
Chesapeake Recovery Region: Virginia east of Blue Ridge Mountains, Delaware, Maryland, the eastern half of Pennsylvania, West Virginia Panhandle and two-thirds of New Jersey. Delisting goals were met in 1996 [1]. As of 2003, there were more than 800 nesting pairs in this region [4].
Northern States Recovery Region: 25 Northernmost states. Delisting goals were met in 1991, with 1,349 occupied breeding areas across 20 states. As of 2007, there were an estimated 4,215 breeding pairs in the northern recovery region [6].
Pacific Recovery Region: Idaho, Nevada, California, Oregon, Washington, Montana and Wyoming. Numeric delisting goals were met in 1995 [1]. As of 2001, there were
1,627 nesting pairs in this recovery region [4].
Southeastern Recovery Region: Alabama, Arkansas, Florida, Georgia, Kentucky, Louisiana, Mississippi, North Carolina, South Carolina, Tennessee and eastern Texas. Downlisting goals were met between 1991 and 1998. More than 1,700 pairs were counted in 2000 [4, 6].
Southwestern Recovery Region: Oklahoma and Texas west of the 100th meridian, New Mexico, Arizona and California bordering the Lower Colorado River. The goal established in the recovery plan has been exceeded. In 2003, 46 occupied breeding areas were reported in New Mexico and Arizona. In 2004, the Arizona had 41 occupied breeding areas [4].
In the eight Northeast states from New Jersey to Maine and Vermont, nesting eagle pairs increased from 21 in 1967 to 562 in 2005 [5]. The majority were in Maine, which supported all 21 pairs in 1967 and 385 pairs in 2005. Eagles returned to Massachusetts and New Hampshire in 1990, with the former supporting 19 pairs in 2005 and the latter eight in 2004. In 2005 there were 53 pairs in New Jersey, 94 in New York and one in Vermont. The Northeast is also an important wintering area, with the Connecticut population increasing from 20 to 92 between 1979 and 2005, and the New York population increasing from six to 194 between 1978 and 2006 [5].
CITATIONS
[1] U.S. Fish and Wildlife Service. 1999. Proposed rule to remove the bald eagle in the Lower 48 states from the list of endangered and threatened wildlife. Federal Register, July 6, 1999 (64 FR 36453)
[2] U.S. Fish and Wildlife Service. 2007. Bald Eagle Numbers Soaring. May 14, 2007 press release.
[4] U.S. Fish and Wildlife Service. 2006. Removing the bald eagle in the Lower 48 States from the list of endangered and threatened wildlife; reopening of public comment period with new information. Federal Regiter, February 16, 2006 (71 FR 8238).
[5] Center for Biological Diversity. 2006. Bald eagle trends in the Northeastern United States. Tucson, AZ.
[6] U.S. Fish and Wildlife Service. 2007. Removing the Bald Eagle in the Lower 48 States From the List of Endangered and Threatened Wildlife; Final Rule. 72 Fed. Reg 37346.
[7] Suckling, K. and W. Hodges. Status of the bald eagle in the lower 48 states and the District of Columbia: 1963-2007. Center for Biological Diversity, Tucson, AZ. Available at http://www.biologicaldiversity.org/species/birds/bald_eagle/report/index.html.
Blue whale (Balaenoptera musculus)
| Status: Endangered | Critical habitat: none | Listed: 6/2/1970 | Recovery plan: 10/23/1998 |
Range: AK(s), CA(s), FL(o), HI(s), ME(o), MD(o), MA(o), NH(o), NY(o), NC(o), OR(m), RI(o), SC(o), WA(m) ---
SUMMARY
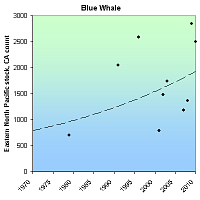
The blue whale population was reduced by as much as 99 percent due to whaling that occurred before the mid-1960s. The number of whales reported off the coast of California, the largest stock in U.S. waters, increased from 704 in 1980 to an estimated 2,497 in 2010.
RECOVERY TREND
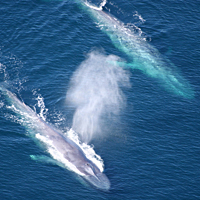
The blue whale (Balaenoptera musculus) is the largest animal ever known to have lived on Earth [1]. Blue whales are found in all oceans worldwide and are separated into populations from the North Atlantic, North Pacific and Southern Hemisphere [1]. Each population is composed of several stocks that typically migrate between higher-latitude summer feeding grounds and lower-latitude wintering areas. The largest numbers of blue whales in U.S. waters are within the eastern North Pacific stock. Other U.S. stocks occur in waters off the coast of Hawaii and the Northeast [1].
Pre-whaling blue whale populations had about 350,000 individuals [3]. In 1868, the invention of the exploding harpoon gun made the hunting of blue whales possible and in 1900, whalers began to focus on blue whales and continued until the mid 1960s [1, 3]. During this time, it is estimated that whalers killed up to 99 percent of blue whale populations [3]. Currently, there are about 5,000-10,000 blue whales in the Southern Hemisphere and about 3,000-4,000 in the Northern Hemisphere [3]. Current threats include collisions with vessels, entanglement in fishing gear, reduced zooplankton production due to habitat degradation, and disturbance from low-frequency noise [1]. The offshore driftnet gillnet fishery is the only fishery likely to take blue whales, but few mortalities or serious injuries have been observed [2].
EASTERN NORTH PACIFIC STOCK
The Eastern North Pacific Stock feeds in waters off the coast of California from June to November and then migrates south to Mexico (sometimes going as far south as Costa Rica) in winter/spring [2]. Recently, blue whales seen off the coast of Alaska were photo-matched to photos from the Southern California area, indicating that California animals now migrate as far north as Alaska [4]. This is probably a reestablishment of a traditional migratory route [4]. The number of whales reported off the coast of California increased from 704 in 1979/80 to 2497 in 2010 [2, 11]. It is not certain if the overall increasing trend indicates a growth in the size of the stock, or just increased use of California waters [2], but in general, the stock is thought to have increased [1]. Because this is the largest stock in U.S. waters, it dominates the trend of the species in U.S. waters.
WESTERN NORTH PACIFIC STOCK
Blue whales feeding along the Aleutian Islands are probably part of a central western North Pacific stock that is thought to migrate to offshore waters north of Hawaii in winter [5]. Sightings of blue whales in Hawaiian waters are infrequent, although acoustic recordings indicate that blue whales occur there. There are no estimates of population size for this stock [5]. No blue whales were sighted during aerial surveys of Hawaiian waters conducted from 1993 to 1998 or during shipboard surveys conducted in the summer/fall of 2002 [5]. In 2004, three blue whales were seen in the western Aleutians, the first U.S. sightings of blue whales from this western North Pacific population in several decades [6]
NORTH ATLANTIC STOCK
The blue whale is an occasional visitor along the Atlantic coast of the Northeast [7]. Sightings of blue whales off Cape Cod, Mass., in summer and fall may represent the southern limit of the feeding range of the western North Atlantic stock that feeds primarily off the Canadian coast [7]. Blue whales have been sighted as far south as Florida, however, and the actual southern limit of this stock’s range is unknown [7]. Because blue whales are not frequently seen in U.S. Atlantic waters, there are insufficient data to determine the stock's population trend [7]. In 1997, the total number of photo-identified individuals for eastern Canada and New England was 352 [1].
CITATIONS
[1] NMFS. 1998. Recovery plan for the blue whale (Balaenoptera musculus). Prepared by Reeves R.R., P.J. Clapham, R.L. Brownell, Jr., and G.K. Silber for the National Marine Fisheries Service, Silver Spring, MD. 42 pp.
[2] NOAA Fisheries. 2004. Stock Assessment Report. Blue Whale (Balaenoptera musculus): Eastern North Pacific Stock. Revised 3/15/05. National Oceanic and Atmospheric Administration, Washington, D.C.
[3] American Cetacean Society. 2005 American Cetacean Society Fact Sheet: Blue Whale (Balaenoptera musculus). Website http://www.acsonline.org/factpack/bluewhl.htm (accessed on 11/30/05).
[4] NOAA. Fisheries. 2004. NOAA Scientists Sight Blue Whales in Alaska. Press Release 7/27/2004.
[5] NOAA Fisheries. 2004. Stock Assessment Report. Blue Whale (Balaenoptera musculus): Western North Pacific Stock. Revised 3/15/05. National Oceanic and Atmospheric Administration, Washington, D.C.
[6] Rankin, Barlow and Stafford. (in press) Marine Mammal Science.
[7] NOAA Fisheries. 2002. Stock Assessment Report. Blue Whale (Balaenoptera musculus): Western North Atlantic Stock. Revised Jan. 2002. National Oceanic and Atmospheric Administration, Washington, D.C
[8] NOAA Fisheries. 2007. Stock Assessment Report. Blue Whale (Balaenoptera musculus): Eastern North Pacific Stock. National Oceanic and Atmospheric Administration, Washington, D.C.
[9] NOAA Fisheries. 2008. Stock Assessment Report. Blue Whale (Balaenoptera musculus): Eastern North Pacific Stock. National Oceanic and Atmospheric Administration, Washington, D.C.
[10] NOAA Fisheries. 2009. Stock Assessment Report. Blue Whale (Balaenoptera musculus): Eastern North Pacific Stock. National Oceanic and Atmospheric Administration, Washington, D.C.
[11] NOAA Fisheries. 2010. Stock Assessment Report. Blue Whale (Balaenoptera musculus): Eastern North Pacific Stock. National Oceanic and Atmospheric Administration, Washington, D.C.
Brown pelican (Eastern DPS) (Pelecanus occidentalis (Atlantic/Eastern Gulf Coast DPS))
| Status: Delisted | Critical habitat: none | Listed: 10/13/1970 | Recovery plan: 6/30/1980 |
Range: AL(b), CT(o), DE(s), FL(b), GA(b), ME(o), MD(b), MA(o), NH(o), NY(s), NJ(s), NC(b), RI(o), SC(b), VA(b) ---
SUMMARY
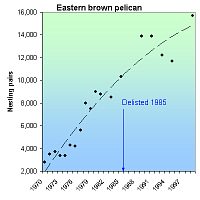
Reproductive failure due to eggshell thinning, caused by the pesticide DDT, was the main cause of brown pelican population declines. The pelican has recovered, but now faces threats from offshore oil and wind development, rising sea levels and hurricanes. Brown pelican nests on the Atlantic Coast increased from 2,796 in 1970 to 15,670 in 1999; on the eastern Gulf Coast, nest numbers increased slightly from 5,100 in 1970 to 5,682 in 1999. The eastern brown pelican was delisted in 1985 due to recovery.
RECOVERY TREND
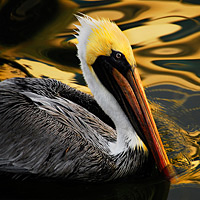
The southeastern brown pelican (Pelecanus occidentalis pop.) breeds from Maryland south along the Atlantic Coast to southern Florida and westward along the Gulf Coast to Alabama [1]. The brown pelican occurs regularly as a non-breeder in New York, New Jersey and Delaware, and occasionally northward to Nova Scotia.
The listing history of this population is complex. The brown pelican species was listed as endangered throughout its range in 1970. The "southeastern brown pelican," a taxon not previously recognized by scientists or wildlife managers, was separated from the rest of the species, declared recovered, and delisted in 1985 [1]. This distinct population includes, and is limited to, all portions of the eastern brown pelican (P. o. carolinensis) east of Mississippi.
Nests on the Atlantic Coast increased from 2,796 in 1970 to 10,300 in 1985, when it was delisted, and numbered 15,670 in 1999. Nests on the Gulf Coast (eastern and western) increased from 5,100 in 1970 to 7,000 in 1985 when the Eastern Gulf Coast population was delisted, then continued increasing to 24,400 in 1999.
MARYLAND: Prior to 1987, when six pairs nested on a state-owned dredge spoil island in Chincoteague Bay near Assateague Island, the brown pelican had not been recorded nesting in Maryland [3,4]. Nesting pairs increased from 26 in 1989 to 1,042 in 2008 [5].
VIRGINIA: The brown pelican was not recorded as nesting in Virginia prior to 1987 [4]. Nests increased from 37 in 1989 to 1,406 in 1999 [2]. In 2008 there were 1,924 breeding pairs in the state [6].
NORTH CAROLINA: Nests increased from 75 in 1976 [1] to 4,350 in 1999 [2]. In 2007 there was a marked decrease to 3,452 nests [7].
SOUTH CAROLINA: Nests increased from 1,117 in 1970 [1] to 7,739 in 1989, then decreased to 3,486 in 1999 [2]. The latter decline is believed to be the result of key island habitats eroding away. The birds likely moved to other states. In 2009 there were 3,985 nests [8].
GEORGIA: The first record of nesting pelicans was in 1988 [2]. Nests increased from 200 in 1989 to around 3,500 nests in 2007 [2,9].
FLORIDA: Nests increased from 7,690 in 1970 [1] to 12,312 in 1989 [2], then decreased to only 4,724 nesting pairs in 2007 [10], which is the lowest number of nests recorded in the state since before 1970.
ALABAMA: The brown pelican was not recorded to nest in Alabama prior to 1983 [1]. Nests increased from 588 in 1989 to around 5,000 as of 2006 [11].
NEW JERSEY: Beginning in the 1980s, brown pelicans were seen with some regularity during the summer. Several pairs unsuccessfully attempted to nest in 1992 and 1994 [2].
NEW YORK: Beginning in the 1980s, brown pelicans were seen with some regularity during the summer, but have not been recorded nesting [2].
DELAWARE: Beginning in the 1980s, brown pelicans were seen with some regularity during the summer, but have not been recorded nesting [2].
CITATIONS
[1] U.S. Fish and Wildlife Service. 1985. Removal of the brown pelican in the southeastern United States from the list of endangered and threatened wildlife. Federal Register (50:4938).
[2] Shields, M. 2002. Brown Pelican (Pelecanus occidentalis). In The Birds of North America, No. 609 (A. Poole and F. Gill, eds.). The Birds of North America, Inc., Philadelphia, PA.
[3] USGS. 2005. Biological and ecotoxicological characteristics of terrestrial vertebrate species residing in estuaries. U.S. Geological Survey. Website (www.pwrc.usgs.gov/bioeco/bpelican.htm) accessed December 30, 2005.
[4] Brinker, D.F. 2006. Brown pelican nesting in Maryland, 1986-2005. Data provided by David Brinker, Natural Heritage Program, Maryland Department of Natural Resources, Cantonsville, MD, January 3, 2006.
[5] Maryland Department of Natural Resources. 2008. Creature Feature: Brown Pelican. Accessed July 27, 2010 at: http://dnr.maryland.gov/mydnr/creaturefeature/brownpelican.asp
[6] Watts, B. D. and B. J. Paxton. 2009. Status and distribution of colonial waterbirds in
coastal Virginia: 2009 breeding season. CCBTR-09-03. Center for Conservation Biology, College of William and Mary/Virginia Commonwealth University, Williamsburg, VA 21 pp.
[7] North Carolina Wildlife Resources Commission. 2008. Annual Program Report 2007-2008. Wildlife Diversity Program Division of Wildlife Management. Accessed July 27, 2010 at: http://www.ncwildlife.org/Wildlife_Species_Con/documents/AnnualProgramReportWDinWM07-08.pdf
[8] South Carolina Department of Natural Resources (SCDNR). 2010. Untitled population data provided to U.S. Fish and Wildlife Service. Obtained via FOIA FWS-2010-00941.
[9] Jodice, P.G.R., T.M. Murphy, F.J. Sanders, and L.M. Ferguson. 2007. Longterm Trends in Nest Counts of Colonial Seabirds in South Carolina, USA.
[10] Florida Fish and Wildlife Conservation Commission. 2007. Fiscal Year 2006-2007 Progress Report on activities of the Endangered and Threatened Species Management and Conservation Plan. Accessed July 27, 2010 at: http://www.myfwc.com/docs/WildlifeHabitats/Endangered_Threatened_Species_Progress_Report_2006_2007.pdf#search=%22brown%20pelican%2
[11] Morley, D.F. 2006. 2006 Alabama Coastal BirdFest. Conservation News, Alabama Dept. of Conservation and Natural Resources. Accessed August 2, 2010 at: http://www.outdooralabama.com/outdoor-alabama/07-06news.pdf.
Delmarva Peninsula fox squirrel (Sciurus niger cinereus)
| Status: Endangered | Critical habitat: none | Listed: 3/11/1967 | Recovery plan: 6/8/1993 |
Range: DE(b), MD(b), PA(b), VA(b) --- NJ(x)
SUMMARY
Logging and conversion of forests to farms and developments destroyed much of the Delmarva Peninsula fox squirrel's habitat. The squirrel remains threatened by ongoing habitat loss, car strikes and rising sea levels due to global climate change. At the time of listing in 1967, the squirrel occupied only 10 percent of the Delmarva Peninsula. As of 2007, its likely occupied range had expanded to 27 percent of the peninsula. In addition, 11 of 16 translocations have been successful.
RECOVERY TREND
The Delmarva Peninsula fox squirrel (Sciurus niger cinereusis) is a large, heavy-bodied tree squirrel with an unusually full, fluffy tail [1]. Historically, it occurred in southeastern Pennsylvania, Delaware, south-central New Jersey, eastern Maryland, and the Virginia portion of the Delmarva Peninsula [2]. Because the species' habitat requirements are somewhat specific, requiring mature park-like forests, it is likely that populations were scattered and discontinuous. As forests were logged or converted to farms, they became unsuitable for the fox squirrel. As forests regrew, they were cut again before the mature forest required by fox squirrels could develop. By the turn of the century, the Delmarva fox squirrel had disappeared from New Jersey, Pennsylvania and Virginia, and by 1936, it disappeared from Delaware as well.
At the time of its listing as endangered in 1967, the Delmarva fox squirrel occurred in about 10 percent of its former range in four eastern Maryland counties (Kent, Queen Anne’s, Talbot and Dorchester) [1]. As of 2007, the known range of the squirrel covered 27 percent of the Delmarva Peninsula [3]. This represents the total acreage where the squirrels are likely to occur, delineated as the area within three miles of all occupied habitat. The known area of occupied habitat is now more than 25,000 acres larger than it was in 1998, and some of the newly discovered populations significantly extend the periphery of the range known at the time of listing. Using a total area of occupied habitat of 128,434 acres and density estimates, it is estimated that the total population size is now 20,000 to 38,000 squirrels.
Starting in 1968, efforts were made to translocate fox squirrels into unoccupied habitat. As of 2007, 11 of 16 translocations were considered to be successful based on recovery plan criteria [3]. After approximately 25 years, almost 70 percent of the original release sites have persisting populations of Delmarva fox squirrels, with expansion indicated at the majority of sites. Of the unsuccessful translocation efforts, three were thought to have failed by 1993 (Nassawango, Fairhill and Chester). A fourth (Brownsville, Va.) began with a substantial number of animals, but although a few persisted at this site for an extended period, there was no evidence of reproduction. The most recent loss was the population at Assawoman, which was started with 13 animals and monitored as a benchmark site. Despite comparatively low numbers, reproduction was occurring and the
population persisted for about 15 years; however, Assawoman was not supplemented with additional animals, and this reintroduction is now considered unsuccessful
according to the recovery plan criteria. The population on Eastern Neck National Wildlife Refuge was not counted as one of the 16 translocations; however, it started from an historic translocation conducted in the 1920s by the hunt club that owned the property at the time. The population thrived on this relatively small island for many years and was a source of animals used to establish and supplement the translocated population at Chincoteague National Wildlife Refuge. Recent trapping evidence and observations by refuge staff indicate that this population has diminished to a few individuals at most, and it remains to be seen whether this population will blink out or bounce back [3].
The 1993 recovery plan specified a series of benchmark sites where squirrels were to be monitored for a minimum of seven years, using winter nest box checks and some trapping, in order to better understand the subspecies’ population dynamics. The seven sites included Blackwater, Chincoteague, and Prime Hook national wildlife refuges; Hayes Farm; Lecompte and Wye Island wildlife management areas, , and Assawoman Wildlife Area. Only four of the sites, Blackwater, Hayes Farm, Lecompte, and Wye Island, are part of the remnant distribution of this species; the others are translocation sites. Monitoring results showed the squirrels to be present and breeding at all benchmark locations during the seven-year study period; however, since the conclusion of the benchmark evaluation, the Assawoman translocation has been deemed a failure [3]. Despite this, the 2007 Five-Year Review recommended downlisting [3].
Current threats to the Delmarva fox squirrel include development, timber harvest, short-rotation pine forestry, forest conversion to agriculture, and rising sea levels due to global climate change [1,3]. Because much of the squirrel’s occupied habitat is on privately owned lands, the success of conservation efforts will be largely dependent on management practices on these lands. Small populations are also very susceptible to extirpation.
In the 2007 Five-Year Review, the Service recommended downlisting the squirrel from “endangered” to “threatened” [3]. However, due to ongoing threats to the species and lack of reliable quantitative long-term population data, it would be premature to downlist the squirrel.
CITATIONS
[1] U.S. Fish and Wildlife Service. 1993. Delmarva Fox Squirrel (Sciurus niger cinereus) Recovery Plan, Second Revision. Hadley, Massachusetts. 104 pp.
[2] U.S. Fish and Wildlife Service. 1984: Proposed Determination of Experimental Population Status for Introduced Population of Delmarva Fox Squirrel; Federal Register (49:13556-13558).
[3] U.S. Fish and Wildlife Service. 2007. Delmarva Peninsula Fox Squirrel (Sciurus niger cinereus) 5-Year Review: Summary and Evaluation. Chesapeake Bay Field Office, Annapolis, Maryland. 56 pp.
Eggert's sunflower (Helianthus eggertii)
| Status: Delisted | Critical habitat: none | Listed: 5/22/1997 | Recovery plan: 12/9/1999 |
Range: AL, KY, TN
SUMMARY
Eggert's sunflower was threatened by development, agriculture, herbicides and fire suppression. At the time of listing in 1997, there were 34 known sites for Eggert's sunflower. When delisted in 2005, there were 287 known sites, many of which were protected by cooperative management agreements.
RECOVERY TREND
Eggert’s sunflower (Helianthus eggertii) is an 8-foot tall sunflower that occurs in Alabama, Kentucky and Tennessee. It is commonly associated with the barrens-woodland ecosystem, a complex of somewhat dry plant communities maintained by drought and fire with a grassy ground cover and scattered medium-to-small-canopy trees [1].
The sunflower was protected under the Endangered Species Act in 1997 due to habitat loss for residential, commercial and industrial development, plant succession, conversion of its limited habitat to pasture or croplands, and herbicide use, particularly along roadsides [1]. At the time of listing in 1997, it was known from 34 sites.
The 1999 Eggert’s sunflower federal recovery plan establishes the following delisting criteria: 1) The long-term conservation/protection of 20 geographically distinct, self-sustaining populations (distributed throughout the species’ range or as determined by genetic uniqueness) must be provided through management agreements or conservation easements on public land or land owned by private conservation groups, and 2) these populations must be under a management regime designed to maintain or improve the habitat and each population must be stable or increasing for five years.
Due to protection of known populations, discovery of new populations, and cooperative management agreements with a variety of agencies to protect the species, the sunflower was delisted in 2005, at which time there were 287 known sites and 73 defined populations [2].
CITATIONS
[1] U.S. Fish and Wildlife Service. 1997. Determination of Threatened Status for Helianthus eggertii (Eggert’s Sunflower). 62 FR 27973.
[2] U.S. Fish and Wildlife Service. 2005. Removal of Helianthus eggertii (Eggert’s Sunflower) from the Federal List of Endangered and Threatened Plants. 70 FR 48482.
Fin whale (Balaenoptera physalus)
| Status: Endangered | Critical habitat: none | Listed: 6/2/1970 | Recovery plan: 7/30/2010 |
Range: AL(o), AK(s), CA(s), CT(s), DE(s), FL(s), GA(s), HI(s), LA(o), ME(s), MD(s), MA(s), MS(o), NH(s), NY(s), NJ(s), NC(s), OR(s), PA(s), RI(s), SC(s), TX(o), VA(s), WA(s) ---
SUMMARY
Fin whales were hunted in all the world's oceans for the first three-quarters of the 20th century, causing population decline. Ongoing threats include illegal and legal whaling, vessel collisions, fishing gear entanglement, reduced prey and noise. Total population size is unknown, but both the North Atlantic and North Pacific populations increased between 1995 and 2009.
RECOVERY TREND
Fin whale (Balaenoptera physalus) populations in the North Atlantic, North Pacific and southern oceans mix rarely, if at all. For management purposes, the North Pacific is divided into three stocks: 1) the California/Oregon/Washington stock, 2) the Hawaii stock and 3) the Alaska stock [2]. A western North Atlantic stock inhabits U.S. waters along northeastern coasts [3]. Most groups are thought to migrate seasonally, in some cases over large distances [1]. They feed at high latitudes in summer and move to low latitudes in winter. Some groups move over shorter distances and may be resident to areas with a year-round supply of adequate prey.
Fin whales were hunted, often intensively, in all the world's oceans for the first three-quarters of the 20th century [1]. From 1947 to 1987, approximately 46,000 fin whales were taken from the North Pacific [2]. Commercial whaling did not end until 1976 in the North Pacific and 1987 in the North Atlantic. The current status of fin whale populations relative to pre-whaling levels is uncertain.
In the North Pacific, pre-whaling populations were estimated to be between 42,000 and 45,000 [2]. By 1973, the North Pacific population is thought to have been reduced to 13,620-18,680 — less than 38 percent of historic carrying capacity [2].
California/Oregon/Washington Stock
The California/Oregon/Washington stock of the North Pacific is thought to be increasing [5]. Fin whale acoustic signals are detected year-round off Northern California, Oregon and Washington, with a concentration of vocal activity between September and February [2]. Fin whales increased in abundance along the California coast between 1979 and 1996, and based on ship surveys in 2001, they continued to increase. Populations appeared to be increasing monotonically from 1991 to 2001 [5]. In 2001, 3,279 (CV= 0.31) were estimated in California, Oregon and Washington coastal waters [2]. The 2008 population was estimated at 2,825 whales [9].
Alaskan Stock
Since 1999, information on abundance of fin whales in Alaskan waters has improved and although the full range has not yet been surveyed, a rough estimate of the size of the population west of the Kenai Peninsula is 5,703 [6]. Surveys conducted in 1999 and 2000 in the central-eastern Bering Sea and southeastern Bering Sea provided provisional estimates of 3,368 (CV = 0.29) and 683 (CV = 0.32), respectively [6]. One aggregation of fin whales spotted in 1999 involved more than 100 animals [6]. Because historical abundance information is lacking, population trends are difficult to determine [6].
Hawaiian Stock
Fin whales are rare in Hawaiian waters and the stock is thought to be quite small [7]. Over the course of 12 aerial surveys conducted within about 25 nautical miles of the main Hawaiian Islands in 1993-98, only one fin whale was sighted [7]. More recent acoustic data suggest that fin whales migrate into Hawaiian waters mainly in fall and winter [7]. In 2002, a ship survey of the entire Hawaiian Islands resulted in an abundance estimate of 174 (CV=0.72) fin whales [7].
Western North Atlantic Population
Western North Atlantic fin whales off the eastern U.S. coast north to Nova Scotia and the southeastern coast of Newfoundland are considered a single stock [3]. New England waters represent a major feeding ground, and calving is thought to take place along mid-Atlantic U.S. latitudes from October to January. The locations used for calving, mating and wintering for most of the population remains unknown. It is likely that fin whales occurring in the U.S. Atlantic undergo migrations into Canadian waters, open-ocean areas, and perhaps even subtropical or tropical regions. An abundance of 2,200 (CV=0.24) fin whales was estimated from a 1995 line-transect sighting survey that covered waters from Virginia to the mouth of the Gulf of St. Lawrence. A 1999 estimate of 2,814 (CV=0.21) fin whales, currently considered the best estimate for the western North Atlantic stock, was derived from a line-transect sighting covering waters from Georges Bank to the mouth of the Gulf of St. Lawrence [3]. The best estimate of population for this stock in 2007 is 3,985 whales [8]. Although there is little data on population trends, the minimum population estimate reported in NOAA Fisheries Stock Assessment Reports has steadily increased since 1992.
The main direct threat to fin whales today is the possibility of illegal whaling or a resumption of legal whaling [1]. In 2006, Japan announced that it would expand hunts to include fin whales [4]. It expected to harvest 10 fin whales from Antarctic waters [4]. Collisions with vessels, entanglement in fishing gear, reduced prey abundance due to overfishing and habitat degradation, as well as disturbance from low frequency noise, are also potential threats [1]. The offshore drift gillnet fishery is the main fishery likely to take fin whales [2].
CITATIONS
[1] National Marine Fisheries Service. 1998. Draft Recovery Plan for the Fin Whale (Balaenoptera physalus) and Sei Whale (Balaenoptera Borealis). Silver Spring, MD.
[2] NOAA Fisheries. 2005. Stock Assessment Report. North Atlantic Right Whale (Eubalaena glacialis): Western Stock revised Dec., 2004. National Oceanic and Atmospheric Administration, Washington, D.C.
[3] NOAA Fisheries. 2004. Stock Assessment Report. Fin Whale (Balaenoptera physalus): Western North Atlantic stock. Revised Dec. 2004. National Oceanic and Atmospheric Administration, Washington, D.C.
[4] Hans Greimel, Associated Press. 2005. Japan To Double Usual Whale Kill in New Antarctic Hunt, Expanded To Include Fin Whales. Nov. 9, 2005.
[5] Barlow, J. 2003. Preliminary Estimates of the Abundance of Cetaceans along the U.S. West Coast: 1991-2001 Southwest Fisheries Science Center Administrative Report LJ-03-03. Available at <http://swfsc.nmfs.noaa.gov/prd/PROGRAMS/CMMP/default.htm>.
[6] NOAA Fisheries. 2004. Stock Assessment Report. Fin Whale (Balaenoptera physalus): Northeast Pacific stock. Revised 10/21/2004.
[7] NOAA Fisheries. 2005. Draft Stock Assessment Report. Fin Whale (Balaenoptera physalus): Hawaiian stock. Revised 3/15/2005.
[8] NOAA Fisheries. 2010. Stock Assessment Report. Fin Whale (Balaenoptera physalus): Western North Atlantic Stock. Revised 11/2010.
[9] NOAA Fisheries. 2011. 2010 Stock Assessment Report. Fin Whale (Balaenoptera physalus): California/Oregon/Washington stock. Revised 1/15/2011.
Florida manatee (Trichechus manatus latirostris)
| Status: Endangered | Critical habitat: 9/24/1976 | Listed: 3/11/1967 | Recovery plan: 10/3/2001 |
Range: AL(o), CT(o), DE(o), FL(b), GA(b), LA(o), MD(o), MS(o), NY(o), NJ(o), NC(o), RI(o), SC(o), TX(o), VA(o) ---
SUMMARY
The Florida manatee is imperiled by habitat loss, coastal development, and motor boat collisions. It was listed as endangered in 1967, but range-wide systematic surveys were not instituted until 1991. The manatee increased 227% between 1991 and 2011 (1,478 to 4,834 manatees). Local surveys indicate the manatee has been increasing since the 1970s.
RECOVERY TREND
The Florida manatee (Trichechus manatuslatirotris latirostris) lives in freshwater, brackish and marine environments and inhabits shallow coastal waters, estuaries, bays, rivers and lakes [1]. Florida manatees occur in waters of the southeastern United States, primarily in Florida and southeastern Georgia, but individuals can range as far north as Rhode Island and probably as far west as Texas [2]. During winter, cold water temperatures keep the population concentrated at warm water sites in peninsular Florida [2].
Collisions with boats represent the greatest current threat to Florida manatees but water-control structures also account for significant mortality. Habitat loss caused by residential and commercial development also remains a problem and the loss of warm water refuges could pose a significant threat [2].
Historical data for Florida manatee numbers are poor [2]. Early aerial survey studies conducted in the late 1980s concluded that there were at least 1,200 animals [4]. Beginning in 1991, the state initiated synoptic aerial surveys to count manatees in potential winter habitat during periods of extreme cold weather. Aerial survey results are highly variable however, and results depend on weather conditions [2]. The number of manatees counted increased from 1,478 in 1991 to 4,834 in 2007 [6]. Warm water refuge counts, which are more accurate, also show an increase since the 1970s [2]. An analysis of trends at winter aggregation sites suggests a mean annual increase of 7 percent to-12 percent occurred at sites on the East Coast from 1978 to 1992 [3]. More detailed demographic data is needed, and more widespread accurate surveys must be conducted before population trends can be determined with certainty.
Over the past 25 years, there has been an increase in Florida manatee deaths. It is unclear whether this represents a proportional increase relative to overall population size [2]. This needs further investigation because Florida manatee recovery likely depends on controlling human-caused mortality of adult manatees [2]. "Red tides" caused by the dinoflagellate (Gymnodinium breve) have also resulted in three incidents (1982, 1991 and 1996) of high mortality [2]. Observed declines in the percentage and number of calves seen at power plant aggregation sites is also cause for concern [4].
CITATIONS
[1] Lefebvre, L. W., et al. 1989. Distribution, status, and biogeography of the West Indian manatee. Pages 567-610 in C. A. Woods (editor). Biogeography of the West Indies. Sandhill Crane Press, Gainesville, Florida
[2] U.S. Fish and Wildlife Service. 2001. Florida Manatee Recovery Plan, (Trichechus manatus latirostris), Third Revision. U.S. Fish and Wildlife Service. Atlanta, Georgia.
[3] U.S. Fish and Wildlife Service. West Indian Manatee (Trichechus manatus latirotris) Florida Stock Assessment. U.S. Fish and Wildlife Service Jacksonville Florida. Revised 1995
[4] Reynolds, J.E., III and J.R. Wilcox. 1994. Observations of Florida manatees (Trichechus manatus latirostris ) around selected power plants in winter. Marine Mammal Science 10(2): 143-177
[5] Associated Press. 2007. Report: U.S. may take manatees off endangered list. April 9, 2007.
[6] Florida Fish & Wildlife Conservation Commission. 2012. Synoptic aerial surveys (1991-2011). http://myfwc.com/research/manatee/projects/population-monitoring/synoptic-surveys/.
Florida panther (Puma concolor coryi)
| Status: Endangered | Critical habitat: none | Listed: 3/11/1967 | Recovery plan: 11/1/2008 |
Range: FL(b) --- AL(x), AR(x), GA(x), LA(x), MS(x), SC(x), TN(x)
SUMMARY
The Florida panther was reduced to near extinction by habitat loss, hunting, persecution, and vehicle collisions. Vehicle collisions, habitat loss and fragmentation, lack of sufficient wildland areas, and in-breeding depression remain current threats. Its population size when listed as endangered in 1967 is unknown, but may have been a little larger than the 30-50 animals recorded throughout the 1980s. The population began to grow after a genetic intervention in 1990s, reaching 130 panthers in 2010.
RECOVERY TREND
The Florida panther (Felis concolor coryi) formerly ranged from eastern Texas and western Louisiana into the lower Mississippi River Valley and eastward through Arkansas, Louisiana, Mississippi, Alabama, Florida, Georgia and parts of Tennessee and South Carolina [1].
Hunting and habitat loss reduced the subspecies to a single population of 30 to 50 adults in south Florida by the late 1980s [2]. This population generally occurs within the Big Cypress Swamp physiographic region and is centered in Collier and Hendry counties [1].
In 1981, two panthers were captured and radio-collared, initiating an extensive monitoring program. More than 116 panthers have been collared since the program’s inception [5]. By 1990, all extensive panther habitats had been explored and few panthers remained uncollared [5].
Between 1981 and 1990, the panther population was static at 30 to 50 adults [5] and showing signs of inbreeding depression expressed through increased genetic defects in the heart and sperm [4]. To increase genetic diversity, eight reproductive females from a closely related subspecies were translocated from Texas in 1995. The population increased 200 percent between the 1995 translocation population and 2003 when it reached 87 individuals [3, 4]. It has continued to grow since then, reaching 97 in 2006 [6], 118 in 2007 [8], and 130 in 2010 [7].
CITATIONS
[1] U.S. Fish and wildlife Service. 1993. Florida Panther (Felis Concolor Coryi) Species Account. Website < http://www.fws.gov/endangered/i/a/saa05.html> accessed May, 2006.
[2] Lotz, M., D. Land, M. Cunningham and B. Ferree. 2005. Florida Fish and Wildlife Conservation Commission Florida Panther Annual Report 2—4-2005. Available at <http://www.panther.state.fl.us/news/pdf/FWC2004-2005PantherAnnualReport.pdf>.
[3] Gross, L.J. and Comiskey. 2002. ATLSS PanTrack Telemtry Visualization Tool. U.S. Geological Survey Greater Everglades Science Program 2002 Biennial Report. Available at <http://sofia.usgs.gov/projects/atlss/panthers/telvistool_03geerab.html>.
[4] Pimm, S.L., L. Dollar, and O.L. Bass Jr. 2006. The genetic rescue of the Florida panther. Animal Conservation 9(2):115-122.
[5] McBride, R.T. 2001. Current panther distribution, population trends, and habitat use: report of field work: fall 2000 – winter 2001. Report to Florida Panther SubTeam of MERIT, U.S. Fish and Wildlife Service, South Florida Ecosystem Office, Vero Beach, Florida. www.panther.state.fl.us/news/pdf/rtm2001.pdf.
[6] U.S. Fish and Wildlife Service. 2007. Draft 5-Year Review Summary and Evaluation for the Florida Panther (Puma concolor coryi). Vero Beach, FL.
[7] Florida Fish and Wildlife Commission. 2010 . Statement on Estimating Panther Population Size. Available online at http://myfwc.com/news/resources/fact-sheets/panther-population/. Accessed September 19, 2011.
[8] Florida Fish and Wildlife Commission. 2009. Annual Report on the Research and Management of Florida Panthers: 2008-2009. Available online at http://www.floridapanther.org/images/FWC_Panther_AR_2008_2009.pdf. Accessed September 19, 2011.
| Status: Endangered | Critical habitat: none | Listed: 4/28/1976 | Recovery plan: 7/1/1982 |
Range: AL(b), AR(b), FL(o), GA(o), IL(o), IN(o), KS(o), KY(b), MS(o), MO(b), NC(o), OK(o), TN(b), VA(o), WV(s) ---
SUMMARY
Gray bats declined due to mining, cave disturbance, vandalism, persecution, flooding, deforestation and possibly pesticides. In 2010, they were found with white-nose syndrome, but it is not known if the fungus is lethal to them or not. There were likely at least 5 million gray bats in 1970. At listing in 1976, the gray bat was declining, to a low of 1.5 million bats in 1992. Numbers reached 3.4 million in 2006, the most recent rangewide estimate.
RECOVERY TREND
The gray bat (Myotis grisescens) is one the few North American bats to inhabit caves year-round, and may be the most cave-dependent mammal in the United States [5]. The specificity of these bats' needs, the rarity of caves that can satisfy them, and a growing human population that increasingly seeks out those very same caves thrust the gray bat into a century-long extinction trajectory from which it only recently escaped.
The discovery of white-nose syndrome in gray bats in 2010, however, threatens to reverse the dramatic population gains of the past two decades.
NATURAL HISTORY
Gray bats require exceptionally cold caves during winter hibernation [1]. The temperature must be between 42 degrees and 52 degrees. One or more vertical shafts must descend below the level of the entrance so that as cold air flows in, it becomes trapped, keeping the cave a steady temperature. Hibernacula often have multiple entrances to facilitate air flow.
As fewer than 5 percent of caves in the bat's range have these properties, large numbers of wintering bats crowd into a very small number of caves, some of them traveling hundreds of miles from their summer roosts to find them [1]. Since at least the 1960s, 95 percent of all gray bats winter in just nine caves. Historically, large hibernacula consisted of more than a million bats; in recent years, they support hundreds of thousands.
Females enter hibernation immediately after copulating (usually September or October) but do not become pregnant until emerging from hibernation in the spring. Males, which are generally more plastic in their roosting needs, remain active until entering hibernation in November.
In the spring, pregnant females disperse to very specific maternity caves where they simultaneously give birth to and raise one pup each. (Males and yearling females disperse to smaller, nearby caves.) Pup survival is closely related to the temperature of the maternity site within the maternity cave. The warmer the site, the better: If it is not between 57 degrees and 77 degrees, pup mortality is elevated. Gray bats help maintain the proper temperature by seeking out caves with domed, heat-trapping ceilings and heating them with their own bodies. If the species is healthy enough to have tens of thousands or hundreds of thousands of bats in a single maternity colony, their bodies will produce a substantial amount of heat; and if the cave is structured to retain that heat, the maternity site will remain a steady, warm temperature.
Gray bats forage over rivers, streams, lakes and reservoirs, primarily capturing aquatic insects such as mayflies, caddisflies and stoneflies, but also eating beetles and moths when they cross paths. Most summer caves are within 2.5 miles of a river or lake, further limiting the bats' availability, though some bats travel as far as 22 miles to forage if needed.
THREATS
The gray bat is something of wilderness species, not tolerating human disturbance very well [1]. If humans disturb a maternity roost, it can cause mass mortality of pups, which fall to the cave floor as the startled females withdraw or take flight. Both maternity roosts and hibernacula may be abandoned in response to disturbance.
Caves may be rendered unusable or less able to support gray bat needs if protective vegetation around the entrance is removed, airflow is disturbed by barriers, ingress and egress routes are altered, or the cave's structure or temperature is altered.
In addition to these common, often catastrophic — but not necessarily malicious — impacts, humans have killed large numbers of gray bats for sport, vandalism, or in the mistaken belief that bats are harmful to humans and their crops and pets.
The gray bat's evolved foraging, maternity and roosting strategies intersect with the region's small number of suitable caves to cause a very large portion of the species to inhabit a very small number of roosts. If those roosts are disturbed, even by relatively minor actions, significant portions of the population can be quickly lost. Thus one of the first monographs on the gray bat's decline declared that the "concentration of such a large proportion of the known population into so few caves constitutes the real threat to their survival" [10].
As the human population within the gray bat's range has grown, it has increasingly come into contact with formerly remote bat caves, causing gray bats to withdraw to more remove caves. Today, however, there are few caves left to withdraw to, so it is imperative that all occupied and important caves be protected from disturbance.
If gray bats decline to very low numbers, there will not be enough bats to maintain high maternity roost temperature, which, in a positive feedback loop, will increase pup mortality, further suppressing the population.
In 2010, white-nose syndrome was found in a gray bat hibernaculum in Shannon County, Mo. [14]. This is an enormous threat because it could spread very quickly to the great majority of the species. The bats, however, were not obviously distressed and it is not yet known if white-nose is lethal to them.
RANGE
Gray bats are primarily found in Alabama, Arkansas, Kentucky, Missouri and Tennessee, with smaller populations found in adjacent states, including a growing population in Indiana [1]. Ninety-five percent of bats hibernate in 17 caves in Tennessee (5), Missouri (4), Arkansas (5), Kentucky (3) and Alabama (1).
POPULATION TRENDS
The historic gray bat population size is unknown. Based on reported regional declines of 70 percent to 76 percent from maximum historic levels by 1976-1980 [4, 8], and an estimated range-wide population size of about 2 million in 1979 [8], we estimate the historic population to have been at least 9.5 million bats. It may have been much larger.
Though the scale has not been quantified, the gray bat's decline is believed to have begun in the 19th century with the advent of commercial mining of saltpeter, onyx and other cave minerals [5]. By the beginning of the 1960s, its status was of enough concern for scientists to warn that gray bats were especially vulnerable to human disturbance [7]. By the end of the decade, scientists were predicting the animal's extinction: "in the last few years human disturbance has threatened the very existence of the species…M. grisescens is destined to continue a rapid decline in numbers and probably faces extinction" [6].
The extinction trajectory continued during the 1970s. Using a "conservative" method he suggested would produce "a gross underestimate of true population losses," Merlin Tuttle documented a 54 percent decline of the 22 "healthiest" maternity caves in Alabama and Tennessee between 1970 and 1976 [8]. As the caves had declined 47 percent before his study started, the total decline from historic levels was 76 percent. A similar level of decline (70 percent from historical levels) was documented in nine major maternity roosts in Missouri by 1980 [4].
Only seven of the 22 caves studied by Tuttle were at their maximum historic level in 1970. This was reduced to four by 1976. The largest maternity colony — which was also the species' largest remaining maternity colony — numbered 111,400 bats in 1970. By 1976, it had declined by 95 percent to 6,000 bats.
Where others viewed the gray bat as a near lost cause, Tuttle found hope in the upswell of conservation actions since the bats listing as an endangered species in 1976:
"Since the gray bat was listed as endangered, encouraging progress has been made. The U. S. Fish and Wildlife Service is purchasing the major gray bat hibernating cave reported by Hall and Wilson (1966) in Kentucky as well as the most important known summer cave (no. 11 in this paper), and is considering other important acquisitions. It also has fenced and posted cave 15 of this study on the Wheeler National Wildlife Refuge…Following only 2 years of strict protection from human disturbance, this colony has now returned to maternity status and has increased to more than 19,000 bats….Although recent decline of gray bats has been precipitous there is no reason to believe that this trend cannot be reversed if adequate measures are taken to prevent human disturbance and vandalism." [8].
The gray bat continued to decline, however, leading the federal gray bat recovery team to warn in 1984 that if current trends continued, the species would be reduced to 100,000 individuals by 2000, triggering an irreversible extinction spiral because maternity roosts would be too small to successfully raise young [5].
The declines continued through 1992, when the gray bats reached a low point of 1.5 million individuals [13]. Thereafter the population rapidly increased to 3.4 million in 2006 [11, 12, 1]
DOWNLISTING CONSIDERATION
The U.S. Fish and Wildlife Service announced in 2002 that it intended to downlist the gray bat from endangered to threatened status [15]. Downlisting was widely supported by scientists due to the large upswing in bat numbers, the many protections that had been instituted to purchase, protect and manage many important caves, a commitment to continued monitoring, and the sense that these efforts have become sufficiently institutionalized within federal and state agencies to continue indefinitely.
While the Fish and Wildlife Service was examining the bat's population and management status in consideration of downlisting, white-nose syndrome appeared in the New York and spread rapidly north, south and east, killing some 7 million bats by 2011. In its 2009 “Five-Year Review,” the agency responded by putting the downlisting process on hold:
"Despite the achievements in recovery for this species, the potential threat of white-nose syndrome to populations of Myotis grisescens is of such a magnitude that any possible recommended changes in the future on the classification of this species should be withheld until more can be learned about WNS and its possible adverse impact on gray bat. If WNS spreads to populations of gray bats and results in mortality rates reported elsewhere in the northeastern U.S., the vulnerability of the species to extinction would be high..."
The following year, white-nose would be found in a gray bat hibernaculum and on five of the bats themselves [14]. While the potential for catastrophe is great — likely much greater for the gray bat than any other species — it is not yet known if white-nose is lethal or significantly harmful to it. If the fungus is lethal at levels it has been to some other bats, it could quickly drive the gray bat extinct.
CITATIONS
[1] U.S. Fish and Wildlife Service. 2009. Five Year Review of the Gray Bat (Myotis grisescens). Columbia, MO. http://ecos.fws.gov/docs/five_year_review/doc2625.pdf
[2] Ellison, L.E., T. J. O’Shea, M.A. Bogan, A.L. Everette and D.M. Schneider. 2003. Existing data on colonies of bats in the United States: Summary and analysis of the U.S. Geological Survey’s bat population database. Pages 127-237 in T.J. O’Shea and M.A. Bogan, eds.: Monitoring trends in bat populations of the United States and territories: problems and prospects. U.S. Geological Survey, Biological Resources Division, Information and Technology Report, USGS/BRD/ITR-2003-0003. 274 pp.
[3] Sasse, D.B., R.L. Clawson, M.J. Harvey, and S.L. Hensley. 2007. Status of populations of the endangered gray bat in the western portion of its range. Southeast. Naturalist 6(1):165-172.
[4] Elliott, W.R. 2008. Gray and Indiana bat population trends in Missouri. Pages 46-61 in Proceedings of the 18th National Cave & Karst Management Symposium, W.R. Elliott, ed; Oct. 8-12, 2007. National Cave and Karst Management Symposium Steering Committee. 320 pp. www.utexas.edu/tmm/sponsored_sites/biospeleology/pdf/2008%20elliott%20bats.pdf
[5] U.S. Fish and Wildlife Service. 1982. Gray bat recovery plan. Minneapolis, MN. http://ecos.fws.gov/docs/recovery_plan/820701.pdf
[6] Barbour, R.W., and W.H. Davis. 1969. Bats of America. University of Kentucky Press, Lexington, 286 pp.
[7] Manville, R.H. 1962. A plea for bat conservation. Journal of Mammalogy. 43:571.
[8] Tuttle, M. 1979. Status, causes of decline, and management of endangered gray bats. Journal of Wildlife Management 43:1-17.
[9] Harvey, M.J. 1992. Bats of the eastern United States. Arkansas Game and Fish Commission, Little Rock.
[10] Mohr, C.E. 1972. The status of threatened species of cave-dwelling bats. Bull. Natl. Spe1eo1. Soc. 34:33-47.
[11] Martin, C.O. 2007. Assessment of the population status of the gray bat (Myotis grisescens). Status review, DoD initiatives, and results of a multi-agency effort to survey wintering populations at major hibernacula, 2005-2007. Environmental Laboratory, U.S. Army Corps of Engineers, Engineer Research and Development Center Final Report ERDC/EL TR-07-22. Vicksburg, Mississippi. 97 pp. http://www.dtic.mil/cgi-bin/GetTRDoc?AD=ADA473199
[12] Harvey, M.J., and R.R. Currie. 2007. Gray bat (Myotis grisescens) status review. Unpublished working paper, U.S. Fish and Wildlife Service, Asheville, NC. March 2007.
[13] Harvey, M.J. 1992. Bats of the eastern United States. Arkansas Game and Fish Commission, Little Rock.
[14] Traylor-Holzer, K., Tawes, R., Bayless, M., Valenta, A., Rayman, N., and Songsasen, N. (eds.). 2010. Insectivorous Bat Captive Population Feasibility Workshop Report. IUCN/SSC Conservation Breeding Specialist Group: Apple Valley, MN.
[15] Department of Interior. 2002. Semiannual Regulatory Agenda. December 9, 2002 (67 FR 74583).
Great Lakes piping plover (Charadrius melodus (Great Lakes DPS))
| Status: Endangered | Critical habitat: 7/10/2001 | Listed: 12/11/1985 | Recovery plan: 9/8/2003 |
Range: AL(s), FL(s), GA(s), LA(s), MI(b), MS(s), NC(s), SC(s), TX(s), VA(s), WI(b) --- IL(x), IN(x), MN(x), NY(x), OH(x), PA(x)
SUMMARY
Early declines in Great Lakes piping plover populations were due to hunting, egg collecting and the millinery trade; later declines were the result of development, predation, and human recreation in plover nesting habitat. When the Great Lakes piping plover was listed as endangered in 1985, only 19 pairs remained. It increased to 55 pairs in 2011 and its range had expanded to the south, east and west.
RECOVERY TREND
The Great Lakes piping plover (Charadrius melodus) population breeds and raises its young on sparsely vegetated beaches, cobble pans and sand spits of glacially formed sand dune ecosystems along the Great Lakes shoreline [1].
It formerly nested in Illinois, Indiana, Michigan, Minnesota, New York, Ohio, Pennsylvania, Wisconsin and Ontario. In the late-1800s the population may have been as large as 492 to 682 breeding pairs with 215 in Michigan, 152 to 162 in Ontario, 125 to 130 in Illinois, fewer than 100 in Indiana, Ohio, and Wisconsin and fewer than 30 in Minnesota, New York and Pennsylvania. Hunting, egg collecting and the millinery trade caused a late 19th-early 20th century population crash of many bird species until the Migratory Bird Treaty Act of 1918 put protections in place. How and when the Great Lakes population declined to its precariously small size at the time of listing is unknown [3]. However, conversion of nesting habitat to public recreation and general shoreline development are believed to have been important causes of the decline. By the late 1970s, the plover was essentially extirpated from Illinois, Indiana, New York, Ohio, Pennsylvania and Ontario. It was extirpated from Wisconsin in 1983 and Minnesota in 1986, leaving just a small Michigan population.Impacts (e.g. development, recreation, beach stabilization) on the plover's wintering range also negatively affected birds from coastal North Carolina to Florida and along the Florida Gulf Coast to Texas, Mexico and the Caribbean Islands [4].
When the plover was listed as an endangered species in 1985, just 19 nesting pairs remained, all in Michigan [2]. The population fluctuated between 12 and 19 pairs between 1985 and 1993, then increased steadily to 55 pairs in 2011 [4]. The range expanded to the south, east and west, and plovers recolonized Wisconsin in 1998 at Apostle Islands National Lakeshore, Lake Superior, after being absent since 1983 [1]. The largest nesting congregation is at Sleeping Bear Dunes National Seashore, Mich., which typically supports about 25 percent of the population. The post-1993 increase was facilitated by aggressive management programs that protected nests from predators, nest areas from recreationists, and beaches from development. There is also a small captive rearing program focused exclusively on raising chicks hatched from abandoned eggs.
The 2003 federal recovery plan [1] establishes the following downlisting criteria: 1) a population of at least 150 pairs maintained over five consecutive years, with at least 100 breeding pairs in Michigan and 50 in other Great Lakes states; 2) a five-year average range-wide fecundity of 1.5 to 2.0 fledglings per pair; 3) a 10-year, post-downlisting projection of a stable or growing population. Delisting can occur when these population goals are paired with 1) a determination that genetic diversity is adequate, and 2) development of long-term funding and management agreements to ensure the population is adequately protected in its breeding and wintering range.
Michigan has attained 50 percent of its 100-pair breeding goal for four consecutive years [2]. The five-year average fecundity goal has been met. However, breeding in other Great Lakes states is limited to one to twopairs in Wisconsin.
CITATIONS
[1] U.S. Fish and Wildlife Service. 2003. Recovery Plan for the Great Lakes Piping Plover (Charadrius melodus). Ft. Snelling, Minnesota. viii + 141 pp.
[2] University of Minnesota Great Lakes Piping Plover Research Program. 2006. Summary of Great Lakes piping plover reproductive success 1984-2005. Spreadsheet provided by Francie Cuthbert, University of Minnesota, February 6, 2006.
[3] Cuthbert, F. 2006. Personal communication with Francie Cuthbert, Great Lakes Piping Plover Research Program, University of Minnesota, February 6, 2006.
[4] Cavalieri, V. 2012. Great Lake Piping Plover: Status of the Population and Recovery Program. Presentation presented at Northern Great Plains Piping Plover Workshop, December, 2011. Available at www.fws.gov/northdakotafieldoffice/endspecies/2011%20Northern%20Great%20Plains%20Plover%20papers/CavalieriGreat%20Lakes.pdf.
Humpback whale (Megaptera novaeangliae)
| Status: Endangered | Critical habitat: none | Listed: 6/2/1970 | Recovery plan: 11/15/1991 |
Range: AL(o), AK(s), CA(s), CT(s), DE(s), FL(s), GA(s), HI(s), LA(o), ME(s), MD(s), MA(s), MS(o), NH(s), NY(s), NJ(s), NC(s), OR(s), RI(s), SC(s), TX(o), VA(s), WA(s) ---
SUMMARY
Humpback whale populations were greatly depleted by commercial whaling by the early 1900s. In 1966, the entire North Pacific humpback population was thought to number only around 1,200 animals. As of 2010, the total population of North Pacific humpback was estimated at 21,808.
RECOVERY TREND
Humpback whales (Megaptera novaeangliae) occur in all oceans of the world, generally inhabiting waters over continental shelves, along continental edges and around some oceanic islands [1]. They winter in warm waters in a few specific locations and mate and give birth on wintering grounds where little feeding is thought to take place [1]. For the summer season, they migrate to high-latitude areas where they tend to stay relatively close to shore (although some groups inhabit deeper water) and spend the majority of their time feeding [1].
Humpback whale populations were greatly depleted by commercial whaling [1]. Prior to whaling, humpback whale numbers are thought to have exceeded 125,000 [1]. American whalers alone killed between 14,164 and 18,212 humpback whales between 1805 and 1909 [1]. Humpback whales first received protection in the North Atlantic in 1955 when the International Whaling Commission placed a prohibition on non-subsistence whaling by member nations [1]. Protection was extended to the North Pacific and southern hemisphere populations following the 1965 hunting season [1]. Although hunting has largely been stopped (some exceptions exist that allow the take of a limited number of whales), and populations appear to be increasing, human impacts such as vessel collisions and entanglements are factors that may be slowing the recovery of the humpback whale population [3].
The total level of human-caused mortality and serious injury is unknown, but data indicate that it is significant [3]. Humpback whales are also vulnerable to marine pollution [2]. The increasing levels of anthropogenic noise in the world’s oceans, such as that produced by certain types of sonar, may also be problematic for whales, particularly for baleen whales that communicate using low-frequency sound [4].
GULF OF MAINE, WESTERN NORTH ATLANTIC STOCK
There are likely six stocks within the western North Atlantic humpback population [3]. A feeding aggregation in the Gulf of Maine (considered a single stock) is the only one U.S. waters [3]. Within New England waters, humpbacks are present in spring, summer and autumn [3]. They spend much of their time feeding and their distribution in this region has been largely correlated to prey species and abundance [3]. In winter, humpbacks from the different western Northern Atlantic feeding areas mate and calve primarily in the West Indies, where spatial and genetic mixing among subpopulations occurs [3]. From late December to early April most of the population is found at Silver and Navidad Banks at the end of the Bahamian archipelago, and along the coast of the Dominican Republic [1]. They are also found at much lower densities throughout the remainder of the Antillean arc, from Puerto Rico to the coast of Venezuela [3]. The only U.S.-controlled portions of the breeding range include waters along the Northwest coast of Puerto Rico and the U.S. Virgin Islands [1]. Not all of the stock migrates to the West Indies every winter, however, and significant numbers of animals are found in mid- and high-latitude regions during the winter months [3]. There have recently been a number of wintertime humpback sightings in coastal waters of the southeastern U.S. [3].
North Atlantic humpback numbers are thought to be slowly increasing. An average increase of 1 percent (SE=0.005) was estimated for the period 1979 to 1993 [3]. The best estimate of the number of North Atlantic humpbacks in 1992 and 1993 was 11,570 (CV=0.069) [3]. Data suggest that the Gulf of Maine humpback whale stock is also steadily increasing in size at a rate consistent with the larger population [3]. The Gulf of Maine minimum population was estimated to be 501 in 1992 and 647 in 1999 [3]. Both of these estimates are likely low due to sampling technique [3]. The best estimate of the actual number of animals is thought to be 902 [3].
NORTH PACIFIC
Historic summering range for the North Pacific humpback whales encompassed coastal and inland waters around the Pacific rim from Point Conception, Calif. north to the Gulf of Alaska and the Bering Sea, and west along the Aleutian Islands, Kamchatka Peninsula and into the Sea of Okhotsk [1]. Rough estimates of the pre-whaling population speculate that there were around 15,000 humpbacks in the North Pacific [1]. In 1966, the entire North Pacific humpback population was thought to number only around 1,200 animals [4]. This estimate increased to between 6,000 and 8,000 by 1992 [4]. Although these estimates are uncertain and are based on different methods, the 6 percent to 7 percent growth rate implied is consistent with the observed growth rate of the better-studied eastern North Pacific subpopulation [4].
Although the International Whaling Commission only considered North Pacific humpbacks to be one stock, there is now good evidence for multiple stocks in the North Pacific [4]. There are at least three relatively separate populations that migrate between their respective summer/fall feeding areas and winter/spring calving and mating areas; the eastern North Pacific stock, the central North Pacific stock and the western North Pacific stock [4]. These divisions are a simplification, however, and are not perfect. In general, interchange occurs (at low levels) between breeding areas, although fidelity is extremely high among the feeding areas [4].
The eastern North Pacific stock spend much of their lives within U.S. waters [1]. They winter in coastal Central America and Mexico, migate along the U.S. West Coast, and summer in British Columbia [4]. Mark-recapture population estimates increased steadily from 1988/90 to 1997/98 at about 8 percent per year [4]. Surveys of humpback whale abundance in feeding areas in California, Oregon and Washington conducted from 1991 to 2002 show a steady upward trend with the exception of a large decline in 2000 [5]. The 2002 to 2003 population estimate (1,391, CV=0.22) was higher than any previous estimate and may indicate that the lower numbers in 1999 to 2001 exaggerated any real decline that might have occurred [5]. It could also indicate that a real decline was followed by an influx of new whales from another area [4]. This latter view was substantiated by a greater fraction of new whales seen for the first time in 2003 [4].
The central North Pacific stock, in general, winters around the Hawaiian Islands (some go to Mexico) and migrates to northern British Columbia/Southeast Alaska and Prince William Sound west to Kodiak [6]. Three feeding areas for the Central North Pacific stock have been studied using photo-identification techniques; these include southeastern Alaska, Prince William Sound and Kodiak Island [6]. There has been some exchange of individual whales between these locations, although the aggregation in southeastern Alaska seems to remain relatively isolated from other groups [6]. The current total estimated abundance for this stock is 4,005 individuals [7]. The abundance of the Prince William Sound feeding aggregation is thought to be fewer than 200 whales [6]. In the Kodiak region, 127 individual whales were identified between 1991 and 1994 and abundance was estimated to be 651 (95 percent CI: 356-1,523) [6]. The number of animals in the Southeast Alaska aggregation is thought to have increased [6]. The 2000 estimate of 961 is substantially higher than estimates from the 1980s, which put numbers in the high 300s [6]. In a 2004 report, an annual population rate of increase was calculated to be 10 percent [6]. Another study, based on aerial surveys conducted across the main Hawaiian Islands, and designed specifically to estimate trends in the Central Pacific Stock, found an annual increase of 7 percent from 1993 to 2000 [8]. In 2006, the Southeast Alaska population reached 1,115 [10].
The western North Pacific stock is the least studied of the Northern Pacific populations [9]. This aggregation winters off Japan and probably migrates to waters west of the Kodiak Archipelago (the Bering Sea and Aleutian Islands) in summer/fall [9]. Recent surveys in the central-eastern and southeastern Bering Sea in 1999 and 2000 resulted in humpback whale sightings suggesting that the Bering Sea is an important feeding area [9]. New information indicates that humpback whales from the western and Central North Pacific stocks mix on summer feeding grounds in the central Gulf of Alaska and perhaps the Bering Sea [9]. A major research effort (the SPLASH project) was initiated in 2004 in order to better delineate stock structure of humpback whales in the North Pacific [9]. There are no reliable estimates for the abundance of humpback whales in the western Pacific stock because surveys of the known feeding areas are incomplete, and not all feeding areas are known [9].
The 2010 estimate of abundance of humpback whales in the entire North Pacific Basin based on a Chapman-Petersen estimate is 21,808 (CV=0.04) [10].
CITATIONS
[1] National Marine Fisheries Service. 1991. Recovery Plan for the Humpback Whale (Megaptera novaeangliae). Prepared by the Humpback Whale Recovery Team for the Silver Spring, Maryland. 105pp.
[2] NatureServe. 2005. NatureServe’s Central Databases. Arlington, VA. U.S.A.
[3] NOAA Fisheries. 2005. Stock Assessment Report. Humpback Whale (Megaptera novaeangliae): Gulf of Maine Stock, revised Dec. 2004. National Oceanic and Atmospheric Administration, Washington, D.C.
[4] NOAA Fisheries. 2005. Stock Assessment Report. Humpback Whale (Megaptera novaeangliae): Eastern North Pacific Stock, revised May 15, 2005. National Oceanic and Atmospheric Administration, Washington, D.C.
[5] Calambokidis J., T. Chandler, L. Schlender, G.H. Steiger, and A. Douglas. 1995-2000. Final reports to Monterey Bay, Channel Islands, and Olympic Coast National Marine Sanctuaries, Southwest Fisheries Science Center, and University of California at Santa Cruz. Cascadia Research, 218 1/2; W Fourth Ave., Olympia, WA 9850. Accessed at http://www.cascadiaresearch.org/abstracts/abstract.htm.
[6] NOAA Fisheries. 2005. Stock Assessment Report. Humpback Whale (Megaptera novaeangliae): Central North Pacific Stock, revised Feb 12, 2005. National Oceanic and Atmospheric Administration, Washington, D.C.
[7] NOAA Fisheries, Office of Protected Resources. Cetaceans: Whales, Dolphins, and Porpoises. Humpback Whale. Website <http://www.nmfs.noaa.gov/pr/species/mammals/cetaceans/humpback_whale.doc> accessed January, 2005.
[8] Mobley J. Jr., S. Spitz, and R. Grotefendt. 2001. Abundance of Humpback Whales in Hawaiian Waters: Results of 1993-2000 aerial surveys. Hawaiian Islands Humpback Whale National Marine Sanctuary Office of National Marine Sanctuaries. National Oceanic and Atmospheric Administration U.S. Dept of Commerce. Available at <http://hawaiihumpbackwhale.noaa.gov/research/HIHWNMS_Research_Mobley.pdf>.
[9] NOAA Fisheries. 2005. Stock Assessment Report. Humpback Whale (Megaptera novaeangliae): Western North Pacific Stock, revised Feb 5, 2005. National Oceanic and Atmospheric Administration, Washington, D.C.
[10] NOAA Fisheries. 2010. Draft Stock Assessment Report. Humpback Whale (Megaptera novaeangliae): Central North Pacific Stock, revised Jan 28, 2010. National Oceanic and Atmospheric Administration, Washington, D.C.
Kemp's ridley sea turtle (Lepidochelys kempii)
| Status: Endangered | Critical habitat: none | Listed: 12/2/1970 | Recovery plan: 9/22/2011 |
Range: AL(o), CT(s), DE(s), FL(o), GA(s), LA(m), ME(s), MD(s), MA(s), MS(m), NH(s), NY(s), NJ(s), NC(s), PR(o), RI(s), SC(o), TX(b), VI(o), VA(s) ---
SUMMARY
More than 40,000 Kemp's Ridley sea turtles once nested in a single day on one beach in Mexico, but egg collection, oil drilling, development, and commercial fishing extirpated it from the United States by the 1950s. It was listed as endangered in 1970 and was reintroduced to Texas in 1978. There was little progress until 1995. The population reached 199 in 2011. The Mexican population grew from a low of 740 in the mid-1980s to at least 11,600 nests in 2006.
RECOVERY TREND
The Kemp's Ridley sea turtle (Lepidochelys kempii) nests only in the Gulf of Mexico [6]. Historical nesting areas are not well known, but have likely always been centered in Mexico. Even less is known about historic population numbers, but as late as 1947, more than 40,000 females nested in a single day on one beach in Mexico. Collection of turtle eggs, development of nesting beaches, commercial fisheries by-catch and oil extraction pushed the species to near extinction by the 1970s.
TEXAS
The Kemp's Ridley sea turtle was extirpated from the U.S. as a breeding species by the 1950s, though it continued to forage in U.S. waters along the Gulf Coast and the Atlantic. In 1978, an international, multi-agency project began to reestablish a nesting colony at Padre Island National Seashore in Texas [5]. From 1978 to 1988, 22,507 eggs were transported from Mexico for incubation and imprinting on the sands and surf of the national seashore. Most hatchlings were transported to a National Marine Fisheries Service laboratory where they were raised away from predators for nine to 11 months. They were then released into the Gulf of Mexico, where it was hoped that they would return to nest on the sands where they were imprinted.
The program proved controversial at first, due to setbacks and little nesting success between 1979 and 1994, but nest counts began to increase in 1995, accelerated in 2004, and reached reaching 199 in 2011 [9, 11, 12, 13].
By 2006, 60 percent of Texas nesting occurred in Padre Island National Seashore [1], with the remainder occurring at seven additional sites: Bolivar Peninsula, Galveston Island, near Surfside (Brazoria County), Mustang Island, South Padre Island, Boca Chica Beach, and Aransas/Matagorda Island National Wildlife Refuge [1, 10]. Nesting turtles returned to Matagorda Island, Matagorda Island National Wildlife Refuge in 2005 (three nests) and continued to nest in 2006 (four nests), and 2007 (four nests) [10].
OTHER STATES
Very small, sporadic nesting efforts occur in Alabama, Florida and South Carolina. In 1999, single nests were found on the Bon Secour National Wildlife Refuge in Alabama and on Gulf Island's National Seashore in Perdido Key, Fla. [3]. In 2001, a single hatchling was found at Bon Secour and a nest was found at Gulf Shores’ West End Beach, Ala. [2, 3].
MEXICO
The vast majority of Kemp’s Ridley turtles nest on a single beach near Rancho Nuevo, Tamaulipas, Mexico. The Mexico population declined from more than 40,000 nests in 1947 to 740 in 1985 before steadily climbing to 10,099 in 2005 and at least 11,600 in 2006 [4, 8, 9]. The increase was facilitated by habitat protection, prohibition and education about egg collection, and the requirement that turtle excluder devices be used by U.S. and Mexican shrimp fishing fleets in the Gulf of Mexico. Prior to their use, the fleet killed 500 to 5,000 turtles annually [6].
CITATIONS
[1] Padre Island National Park. 2007. The Kemp's ridley sea turtle. U.S. National Park Service. Website (http://www.nps.gov/pais/naturescience/kridley.htm) accessed August 30, 2007.
[2] U.S. Fish and Wildlife Service. 2001. World's Most Endangered Sea Turtle Nest Discovered Along U.S. Coastline for Only Ninth Time This Year, August 17, 2001 press release. (http://www.fws.gov/southeast/news/2001/al01-001.html)
[3] U.S. Fish and Wildlife Service. 2002. Availability of an Environmental Assessment and Receipt of an Application for an Incidental Take Permit for FML81A, LLC, Fort Morgan Peninsula, Baldwin County, AL. May 9, 2002 (67 FR 31359).
[4] Turtle Expert Working Group. 2000. Assessment Update for the Kemp’s Ridley and Loggerhead Sea Turtle Populations in the Western North Atlantic. U.S. Dep. Commer. NOAA Tech. Mem. NMFS-SEFSC-444, 115 pp.
[5] Arroyo, B., P. Burchfield, L.J. Pena, L. Hodgson, and Pl Luevano. 2003. The Kemp's Ridley: recovery in the making Endangered Species Bulletin, May-June, 2003.
[6] NOA Fisheries. 2005. Kemp's Ridley Turtle (Lepidochelys kempii) (www.nmfs.noaa.gov/prot_res/species/turtles/kemps.html)
[8] Caribbean Conservation Corporation and Sea Turtle Survival League. 2006. Sea turtle species of the world. Website (www.cccturtle.org/species_world.htm) accessed January 23, 2006.
[9] Hanna, B. 2006. Slow and steady revives the species. Fort Worth Telegram-Star, July 3, 2006. Available at http://www.texansforkay.com/news/Read.aspx?ID=103
[10] Stinson, T. 2007. Personal communication with Tonya Stinson, Environmental Education Specialist, Aransas National Wildlife Refuge Complex, May 22, 2007.
[11] National Marine Fisheries Service et al. 2011. Bi-National Recovery Plan for the Kemp’s Ridley Sea Turtle (Lepidochelys kempii). Silver Spring, MD. 177 pp.
[12] Shaver, D. 2012. Sea Turtle Nesting Season 2011. Padre Island National Park. www.nps.gov/pais/naturescience/nesting2011.htm
[13] Shaver, D. 2011. Kemp's Ridley nests found on Texas coast, 2000-2010. Padre Island National Park.
Kirtland's warbler (Dendroica kirtlandii)
| Status: Endangered | Critical habitat: none | Listed: 3/11/1967 | Recovery plan: 6/30/1985 |
Range: FL(m), GA(m), KY(m), MI(b), NC(m), OH(m), PA(m), SC(m), WV(m), WI(b) ---
SUMMARY
Kirtland's warbler declined due to fire suppression suppresse creation of stands of young jack pine, nest parasitism by brown-headed cowbirds, and loss of forest habitat to development and agriculture. It was listed as an endangered species in 1967. In 1971, there were only 201 surviving pairs. In response to habitat protection and restoration, and cowbird control, the population grew steadily to 1,805 pairs in 2011.
RECOVERY TREND
Kirtland's warbler (Dendroica kirtlandii) was described in 1851 and the first nest was discovered in 1903 in northern lower Michigan [1]. Until 1996 all known nests were within 60 miles of this site [1].
Kirtland’s warblers nest in grasses and shrubs below living tree branches in young jack pine forests [1]. This early seral stage habitat was historically maintained by fire [2]. The population size peaked between 1885 and 1900, probably due to the cessation of logging during a period of widespread fire [1]. By 1951, however, the warbler had been reduced to 432 pairs due to fire suppression and nest parasitism by brown-headed cowbirds [1, 3].
Between 1957 and 1962, the U.S. Forest Service and the Michigan Department of Natural Resources created four warbler management areas within state and national forests [1]. The population increased slightly to 502 pairs by 1961, but then declined to its lowest point of 201 pairs in 1971 [2]. During the mid-1970s, some 134,000 acres of jack pine forest in 24 units were designated for Kirtland's warbler management on state and national forests. Additional lands were added in the 1990s and 2000s, bringing the total public land specifically managed for the Kirtland's warbler to more than 180,000 acres [4]. These forests are managed by logging, burning, seeding and replanting on a rotational basis to consistently provide approximately 38,000 acres of productive nesting habitat [1]. In addition, in 1972 the U.S. Fish and Wildlife Service (in cooperation with the U.S. Forest Service, Michigan Department of Natural Resources and the Michigan Audubon Society) initiated a cowbird control program. On average,4,000 cowbirds per year have been removed from Kirtland's warbler breeding areas [1].
The number of territorial males remained at about 200 pairs through 1989, began to increase in 1990, and grew steadily to 1,805 in 2011 [5]. The vast majority of the 2007 territories (1,697) were in Michigan; eight were in Wisconsin, two were in Ontario [2]. Wisconsin was discovered to have been recolonized in 1990 (one singing male) and sporadically thereafter. There was nesting in Wisconsin in 2005 (three nests), 2006 (four nests), and 2007 (eight nests). Ontario was also discovered to have been recolonized in 1990 (one singing male) and sporadically thereafter.
CITATIONS
[1] Michigan Department of Natural Resources. 2006. Kirtland's Warbler (Dendroica kirtlandii). Available at www.michigan.gov/dnr/0,1607,7-153-10370_12145_12202-32591--,00.html
[2] Carlson, E. 2007. Kirtland's warblers by state and county, 1951-2007. Spreadsheet provided by Elaine Carlson, Michigan Department of Natural Resources, August 24, 2007.
[3] Olson, J. A. 2002. Special animal abstract for Dendroica kirtlandii (Kirtland's warbler). Michigan Natural Features Inventory, Lansing, MI. 5 pp.
[4] Carlson, E. 2007. Personal communication with Elaine Carlson, Michigan Department of Natural Resources, August 26, 2007.
[5] Michigan Department of Natural Resources. September 19, 2011. Michigan's Kirtland's Warbler Continues to Exceed Recovery Goal. Available online at http://www.michigan.gov/dnr/0,4570,7-153-10371_10402-262577--,00.html. Accessed September 26, 2011.
Mississippi Sandhill crane (Grus canadensis pulla)
| Status: Endangered | Critical habitat: 6/30/1975 | Listed: 6/4/1973 | Recovery plan: 9/6/1991 |
Range: MS(b) --- AL(x), FL(x), GA(x), LA(x), TX(x)
SUMMARY
Less than 2 percent of the Mississippi sandhill crane's wet pine savanna habitat remains. It was to a single population of 40 birds in 1973, threatened by habitat loss, predation, isolation, harassment, contaminants and hurricanes. The release of captive-bred sandhill cranes began in 1981, and the wild population increased from 33 birds in 1989 to 135 birds in 1993. The population has remained relatively steady due to ongoing captive augmentation with 110 birds in 2009 and 2011.
RECOVERY TREND
The Mississippi sandhill crane (Grus canadensis pulla) historically consisted of a Georgia/Florida population and a separate population along the Gulf Coastal Plain of Texas, Louisiana, Mississippi and Alabama [1]. It was so plentiful in southern Louisiana in the late 1880s that it was considered a farm pest. It was extirpated from Louisiana by the 1910s and from Alabama by the 1960s. It is currently found only on the 7,813-hectare Mississippi Sandhill Crane National Wildlife Refuge in southern Jackson County, Miss.
By 1929, the Mississippi sandhill crane population was about 75 birds [2]. When placed on the endangered species list in 1973, about 40 birds remained. In 1975 critical habitat was designated and the 7,813-hectare Mississippi Sandhill Crane Wildlife Refuge was established. The first federal recovery plan was completed in 1976. The U.S. Geological Survey’s Patuxent Wildlife Research Center began releasing captive-raised birds into the wild flock in 1981 [4]. The wild population increased steadily from 33 birds in 1989 to 135 birds in 1993 [2]. Despite extensive damage to the refuge, the species survived Hurricane Katrina with minimal short-term mortality [3]. In 2009 there were about 110 individuals, including about 20 to 25 breeding pairs [5].
The crane's remaining habitat has been divided and subdivided and now consists only of small islands surrounded by human-altered landscapes. Cranes have also been directly harassed, shot, and may suffer the effects of environmental contaminants [5]. There are ongoing problems with natural recruitment due primarily to nest predation, but the population remains stable at 105 to 120 birds per year due to augmentation with captive-reared cranes [6].
Without Endangered Species Act protection and the creation of the Mississippi Sandhill Crane National Wildlife Refuge, this subspecies would very likely have been lost to extinction. Only two percent of wet pine savanna habitat remains, and the remnant survives in large part due to the creation of the crane refuge.
CITATIONS
[1] U.S. Fish and Wildlife Service. 1991. Mississippi Sandhill Crane Recovery Plan. U.S, Fish and Wildlife Service, Atlanta, Georgia. 42pg.
[2] Gee, G.F. and S.G. Hereford. Mississippi Sandhill Cranes. U.S. Geological Service website (http://biology.usgs.gov/s+t/noframe/b157.htm) visited December 28, 2005.
[3] Hereford, S.G. 2005. Personal communication with Scott Hereford, Senior Wildlife Biologist, Mississippi Sandhill Crane National Wildlife Refuge, December 2005.
[4] Noyes, S. 2005. Mississippi Sandhill Crane and PWRC. Volunteers - Friends. Friends of Patuxent 16(9).
[5] U.S. Fish and Wildlife Service. 2009. Mississippi Sandhill Cranes webpage. http://www.fws.gov/mississippisandhillcrane/mssandhillcranes.html
[6] Hereford, S. 2011. Personal Communication between Scott Hereford, Senior Wildlife Biologist, Mississippi Sandhill Crane National Wildlife Refuge, and Tierra Curry. September 15, 2011.
Mountain golden heather (Hudsonia montana)
| Status: Threatened | Critical habitat: 10/20/1980 | Listed: 10/20/1980 | Recovery plan: 9/14/1983 |
Range: NC
SUMMARY
Mountain golden heather declined due to trampling by rock climbers and hikers, and due to fire suppression which allowed other species to dominate its limited habitat. Following protection under the Endangered Species Act, mountain golden heather increased from 2,883 plant clumps in 1982 to 10,301 in 2009.
RECOVERY TREND
Mountain golden heather (Hudsonia montana) is a flowering plant in the rock-rose family found only in two counties in western North Carolina. It is restricted to unusually dry specialized microhabitats [1].
The heather declined due to soil compaction and plant crushing by rock climbers and hikers, and vegetative crowding of limited habitat due to fire suppression [2].
It was discovered in 1816, thought extinct in the 1960s and early 1970s, rediscovered in 1978, and listed a threatened species by the U.S. Fish and Wildlife Service in 1980 and North Carolina in 1981 [4]. Critical habitat was designated in 1980 at the time of federal listing.
Prescribed burning, seedling reintroduction and control of recreation impacts have reduced threats and improve the species status [1]. As a result, the total mountain heather population increased from 2,883 plant clumps in 1982 to 10,301 in 2009 [1, 3].
CITATIONS
[1] Michener, R.L. 2004. Current global status of Hudsonia montana nuttall (Mountain Golden Heather). Senior research thesis, Whitman College.
[2] NatureServe. 2010. Mountain Golden Heather Species Profile. Available at: http:www.natureserve.org
[3] Alexander, M. 2011. Personal Communication with Mara Alexander, botanist, U.S. Fish and Wildlife Service, Asheville Field Office. Nov. 2, 2011.
[4] U.S Fish and Wildife Service. 1983. Mountain Golden Heather Recovery Plan. U.S. Fish and Wildlife Service, Atlanta, Georgia, 26 pp.
Northern Great Plains piping plover (Charadrius melodus (Northern Great Plains DPS))
| Status: Threatened | Critical habitat: 9/11/2002 | Listed: 12/11/1985 | Recovery plan: 5/18/1999 |
Range: MT, ND, SD, NE, KS, CO, MN, IA, OK; SC, GA, FL, AL, MS, LA, TX, PR
SUMMARY
The Northern Great Plains piping plover was listed as endangered in 1986 due to threats from habitat loss, predation and disturbance. The number of Northern Great Plains piping plovers in the United States has increased from about 1,000 adults when ti was listed as an endangered species in 1985 to 2,959 adults in 2006.
RECOVERY TREND
In the Northern Great Plains, most piping plovers (Charadrius melodus) nest on the unvegetated shorelines of alkali lakes, reservoirs or river sandbars. The Northern Great Plains population is geographically widespread, with many birds in very remote places, especially in the U.S. and Canadian alkali lakes region, making population monitoring difficult.
The International Piping Plover Census is conducted every five years. The census found that the U.S. portion of the Northern Great Plains piping plover population decreased between 1991 and 1996, then increased in 2001 and again in 2006. In the United States in 1991, there were 2,023 adults and 891 breeding pairs. In 2006, there were 2,959 adults and 1,212 breeding pairs. The population of plovers in Canada increased in 1996, decreased in 2001, and then increased again in 2006. Overall, the number of Great Plains piping plovers has increased from approximately 3,500 birds in 1991 to approximately 4,600 birds in 2006 [1].
The recovery goal in the 1988 recovery plan is for 1,300 pairs in the Northern Great Plains that remain stable for 15 years including 60 pairs in Montana, 650 pairs in North Dakota, 350 pairs in South Dakota, 465 pairs in Nebraska, and 25 pairs in Minnesota [2].
The number of piping plover pairs in Montana increased from fewer than 20 pairs in 1986 to more than 100 pairs in 1992, then fluctuated around 60 pairs from 1994 to 2008. The number of pairs in North Dakota has fluctuated, but increased from around 300 pairs in 1986 to nearly 800 pairs in 2008. The number of pairs in South Dakota increased from around 100 pairs in 1986 to around 250 pairs in 2008. The number of pairs in Nebraska increased from around 100 pairs in 1986 to around 400 pairs in 2008. In Minnesota in 1986, there were approximately 11 plover pairs, but from 2002 to 2008 there were only one to two pairs. A few piping plover pairs are also found in Colorado, Kansas and Iowa. From 1990 to 2008, there were two to 18 pairs in Colorado, two to four pairs in Kansas, and four to seven pairs in Iowa [1].
Modeling strongly suggests that the piping plover population is very sensitive to adult and juvenile survival [1]. Therefore, while there is a great deal of effort extended to improve breeding success, to improve and maintain a higher population over time, it is also necessary to ensure that the wintering habitat, where birds spend most of their time, is secure. While the population increase seen in recent years demonstrates the possibility that the population can rebound from low population numbers, ongoing efforts are needed to maintain and increase the population. In the U.S., piping plover crews attempt to locate most piping plover nests and take steps to improve their success. This work has suffered from insufficient and unstable funding in most areas. In addition to habitat loss, human disturbance, and predation, emerging threats, such as energy development (particularly wind, oil and gas and associated infrastructure) and climate change are likely to impact piping plovers both on the breeding and wintering grounds [1].
CITATIONS
[1] U.S. Fish and Wildlife Service. 2009. Piping Plover (Charadrius melodus) 5-Year Review: Summary and Evaluation. 214 pp.
[2] U.S. Fish and Wildlife Service. 1988. Great Lakes and Northern Great Plains Piping Plover Recovery Plan. 170 pp.
| Status: Endangered | Critical habitat: none |
| Listed: 3/11/1967 | Recovery plan: 10/26/1990 |
Range: FL(b), MS(b), NC(b), SC(b), TN(b) --- AL(x), AR(x), DE(x), DC(x), GA(x), IL(x), IN(x), KY(x), LA(x), MD(x), MO(x), OH(x), OK(x), PA(x), TX(x), VA(x), WV(x)
SUMMARY
Red wolves were decimated by habitat loss and shooting. From a population of only 17 red wolves in 1980, captive breeding and release to the wild have resulted in a total population of 300 in 2011.
RECOVERY TREND
The red wolf (Canis rufus) was once found throughout forested regions from southern New England to the Gulf Coast [1]. By 1920, it was extirpated from the southern Atlantic states [1]. By 1970 the population had declined to fewer than 100 wolves and was confined to a small area of coastal Texas and Louisiana [1]. These declines were the result of aggressive predator-control programs and the loss of forest habitat [1].
Early recovery attempts were largely unsuccessful, and as the last red wolf population continued to decline, remaining individuals began mating with coyotes [2]. The number of genetically pure red wolves decreased, further contributing to the species’ decline [2]. In a final attempt to save the species, 17 genetically pure red wolves were captured for captive-breeding efforts [1]. The red wolf captive-breeding program established at the Point Defiance Zoo and Aquarium in Tacoma, Wash., was able to successfully breed 14 of the original wolves, and the first reintroduction occurred in 1978 on Bulls Island off the coast of South Carolina [1].
In 1980, the last remaining wild red wolves were brought into captivity and the species was declared extinct in the wild [2]. The captive-breeding program continued, however, and has now expanded to include 38 zoos and nature centers in 23 states [1]. In 1988 the first wild-born litter since reintroductions began was found at Alligator River National Wildlife Refuge, North Carolina [1]. In 2011 the total population, including wild and captive wolves, was estimated at 300 [3].
Red wolves have now been reintroduced into areas in North and South Carolina, Great Smoky Mountains National Park, and on three islands off the Atlantic and Gulf Coasts [2]. Introductions to the coastal islands have acted as a stepping stone between captivity and the wild; although the islands are too small to support wolf populations, they provide an opportunity for the wolves to breed and exist in the wild and to produce animals for future mainland reintroductions [1]. In 2003, approximately 100 red wolves existed in the wild, with another 157 held in captive-breeding facilities (this includes two island propagation programs). In 2004, 11 of 22 packs had created dens [2].
CITATIONS
[1] U.S. Fish and Wildlife Service. 2004. Alligator River National WIldlife Refuge: Red Wolf Re-establishment Program. Website <http://www.outer-banks.com/alligator-river/redwolf.asp>.
[2] International Wolf Center. 2006. Timeline: The Red Wolf in the Southeastern United States. Website <http://www.wolf.org/wolves/learn/basic/history/red_timeline.asp>.
[3] U.S. Fish and Wildlife Service. 2011. Red Wolf Recovery Program. Available online at http://www.fws.gov/redwolf/index.html. Accessed September 28, 2011.
Sandplain gerardia (Agalinis acuta)
| Status: Endangered | Critical habitat: none | Listed: 9/7/1988 | Recovery plan: 9/20/1989 |
Range: CT(b), MD(b), MA(b), NY(b), RI(b) ---
SUMMARY
The sandplain gerardia is threatened by the ongoing loss of its coastal grassland habitats due to development. Also, the loss of grazing animals and the suppression of fires have allowed woody vegetation to claim many of its historical sites. When the sandplain gerardia was listed as endangered in 1988, only 12 of 51 historic populations remained. As of 2005 there were 22 populations, as well as an increase in the total number of plants.
RECOVERY TREND
The sandplain gerardia (Agalinis acuta) inhabits dry, sandy, poor-nutrient soils in sandplain and serpentine sites in Massachusetts, Rhode Island, Connecticut, New York and Maryland [1]. Its favored growing conditions are native grasslands on sandy loam soils. It requires exposed mineral soil in close proximity to little bluestem and other native grasses, with which it is thought to form hemiparasitic root connections [12]. Most sites are within 10 miles of the coast. The taxonomic relationship between A. acuta and the nonendangered A. tenella is unclear. They are morphologically distinct, but chloroplast DNA variation is not significant [11].
Fifty-one populations were known historically (two more than reported in the 1989 federal recovery plan), but only 12 remained when the gerardia was placed on the endangered species list in 1988. Reintroductions increased the number of occupied populations to 22 in 2005. Short-term population trends can be misleading because of the species' capacity for explosive population growth and rapid decline. Populations in all states except Rhode Island grew substantially between 1988 and 2005. Massachusetts, Connecticut and New York populations were stable to moderately increasing between 1988 and the late 1990s, increasing significantly in the late 1990s and early 2000s, growing explosively for one or several years, then rapidly declining in 2004-2005. There are indications of a similar pattern in Maryland, but adequate data are not available. The small Rhode Island population fluctuated substantially with an overall stable trend. Cumulatively, the MA, RI, CT and NY populations increased dramatically from means of 4,441 (1988-1993) to 14,069 (1994-1999) to 196,466 (2000-2005).
MASSACHUSETTS. The sandplain gerardia historically occurred in 24 populations on Cape Cod, Nantucket, Martha's Vineyard and a few disjunct populations as far west as Worcester County [1]. Its decline was so complete that it was thought extinct in the state until rediscovered on Cape Cod in 1980. When placed on the endangered species list in 1988, just two populations were known in historic cemeteries in Sandwich and Falmouth [3]. A third population was discovered on Martha's Vineyard in 1994 [3]. Due to intensive management, including scientific research, reintroductions, habitat protection and habitat management, the Massachusetts population grew remarkably. From 1988 to 1991 it declined from 13,977 plants to 150, steadily increased to 23,161 in 1998, then exploded to about 483,530 in 2004, before declining to about 49,063 in 2005. The 2005 decline is believed to be drought related [4].
The Sandwich population fluctuated greatly, but increased significantly between 1988 (9 plants) and 2005 (2,299) [3]. High points were in 1995 (4,253), 2000 (4,757) and 2003 (3,712). The population only dipped below 1,000 plants twice between 1993 and 2005. The Falmouth population was discovered in 1981 and supported 6,994 plants in 1988. It was augmented with an introduced subpopulation on an adjacent site beginning in 1989. It declined to less than 50 plants in 1991 and 1992, steadily increased to 4,476 in 1999, exploded to 231,600 in 2004, then plummeted to 21,262 in 2005. A third natural population was discovered on Martha's Vineyard in 1994. It increased steadily from 378 in 1994 to 1,315 in 2000, then jumped to more than 4,200 in 2002-2004, before declining to 1,309 in 2005.
Three populations were introduced in 1998 and 2000 [3]. The Falmouth population increased steadily from 552 plants in 1998 to 15,000 in 2004, then declined to 1,910 in 2005. One Martha's Vineyard reintroduction increased from five plants in 1998 to 1,092 in 1994. A second Martha's Vineyard reintroduction increased from 23 plants in 2000 to 1,238 in 2003. Prior to these successes, there were "several" failed reintroduction attempts on Nantucket and a "couple" on Martha's Vineyard [4]. Introduced populations, including the Falmouth subpopulation, often made up 40-50 percent of the total state population in the last decade.
RHODE ISLAND. The sandplain gerardia historically occurred in six populations in Rhode Island, but by 1988 was reduced to just a single population of 56 plants in a historic cemetery [1]. The population fluctuated considerably, but without discernable trend between 1988 and 2005 [5]. A second population of 33 plants was established in 2003 and grew to 241 plants in 2005.
CONNECTICUT. By 1988, the sandplain gerardia was extirpated from the only two known sites in Connecticut [1], but a very small population was discovered in 1990 [6]. It fluctuated between zero and 32 observable plants from 1990 to 2002, then due to better site management, increased to 165 plants in 2004 before declining to 84 in 2005.
NEW YORK. The sandplain gerardia formerly occurred in 17 populations in New York [1]. The Montauk, Long Island population alone was said to have once had "untold millions" of plants [2]. At the time of listing, only six populations remained in New York with a total population of 814 plants [10]. Cumulatively, the populations remained relatively stable until 1997 (approx. 500-2,000 plants), grew substantially through 2002 (7,272 plants), exploded to 83,531 in 2003, and declined to 10,488 in 2005. Reintroductions were attempted at seven locations after 1988. Of these, four were successful with a mean of 96-263 plants. Plants sown at new introduction sites, and at unoccupied locations within existing sites, accounted for 61-94 percent of total plants in New York from 2001-2005.
MARYLAND. Maryland supported two historical gerardia populations, one of which was destroyed by urbanization and highway construction prior to 1988 [4]. At the time of listing, a single population of 150 plants existed at Soldiers Delight Natural Environmental Area within Patapsco Valley State Park. The population has not been augmented, but due to an active program of burning, clearing, mowing and eradication of exotic plants, the Soldiers Delight population increased to 10,000 in 1989 and well over 100,000 by 2005 [2]. More detailed annual population estimates are not available, but the population presumably fluctuates significantly between these extremes. The Maryland Department of Natural Resources describes the population as stable or increasing, but cautions that additional monitoring is needed to establish a scientifically defensible trend [8]. A second potential population was discovered at Andrews Air Force Base in 1993 but could not be relocated in 1995 [9]. However, specimens could not be distinguished from A. obtusifolia and A. decemloba and thus may not be the sandplain gerardia.
The 1989 federal recovery plan [1] requires 1) The establishment or discovery of 20 stable, wild populations located throughout the species' historic range. To be "stable," a population must have a continuous five-year geometric average of at least 100 plants. 2) At least 15 of the populations must be on protected lands. 3) There must be proven technology for propagation or seed storage. As of December 2005, 13 populations had a five-year mean of at least 96 plants.
CITATIONS
[1] U.S. Fish and Wildlife Service. 1989. Sandplain gerardia (Agalinis acuta) recovery plan. Newton Corner, MA. 47 pp.
[2] NatureServe. 2005. Central database. NatureServe, Arlington, VA.
[3] Somers, P. 2005. Agalinis acuta data summaries, 1980-2005. Spreadsheets provided by Paul Sommers, Natural Heritage & Endangered Species Program, Massachusetts Division of Fisheries & Wildlife, Westborough, MA, November 2005.
[4] Somers, P. 2005. Personal communication with Paul Somers, Natural Heritage & Endangered Species Program, Massachusetts Division of Fisheries & Wildlife, Westborough, MA, November 17, 2005
[5] Raithel, C. 2005. Personal communication with Christopher Raithel, Rhode Island Division of Fish and Wildlife, Endangered Species Program, Providence, RI, November, 2005.
[6] Murray, N. 2005. Personal communication with Nancy Murray, Connecticut Department of Environmental Protection, Wildlife Division, November 22, 2005.
[7] Thomas, J. 2004. Endangered Plants of Maryland: Sandplain Gerardia. Maryland Department of Natural Resources website (www.dnr.state.md.us/wildlife/rtesandplain.asp) dated 10-25-04.
[8] Tyndall, W. 2005. Personal communication with Wayne Tyndall, Maryland Department of Natural Resources, Annapolis, MD, November 23, 2005.
[9] Davidson, L. 2005. Personal communication with Lynn Davidson, Maryland Department of Natural Resources, Annapolis, MD, November 28, 2005.
[10] Jordan, M. 2005. Agalinis acuta monitoring data, Long Island, New York. Spreadsheet provided by Marilyn Jordan, The Nature Conservancy, Cold Spring Harbor, New York, November, 2005
[11] Neel, M.C. and M.P. Cummings. 2004. Section-level relationships of North American Agalinis (Orobanchaceae) based on DNA sequence analysis of three chloroplast gene regions. BMC Evolutionary Biology 4:15.
[12] Jordan, M. 2006. Personal communication with Marilyn Jordan, The Nature Conservancy, Cold Spring Harbor, NY, February 13, 2006.
Seabeach amaranth (Amaranthus pumilus)
| Status: Threatened | Critical habitat: none | Listed: 4/7/1993 | Recovery plan: 11/12/1996 |
Range: DE(b), MD(b), NY(b), NJ(b), NC(b), SC(b), VA(b) --- CT(x), MA(x), RI(x)
SUMMARY
By 1988, seabeach amaranth had been extirpated from much of the Atlantic coast, largely due to beach development, dune stabilization and enhancement projects, off-road vehicles, recreation, exotic species and hurricanes. Since being placed on the endangered species list in 1993, the amaranth has recolonized New Jersey, Delaware, Maryland and Virginia, and has increased from approximately 13,000 at listing to about 31,000 as of 2005.
RECOVERY TREND
The seabeach amaranth (Amaranthus pumilus) is endemic to beaches on the Atlantic coast from Cape Cod, Mass., to Kiawah Island along the central South Carolina coast [1]. It occurs on sparsely vegetated overwash flats and fore dunes, often around inlets on barrier island ends. Hurricanes and storms reduce and eliminate populations, but also create new habitat by reducing competing ground cover. They may also aid large-scale dispersal. The amaranth traps sand, initiating dune formation and creating suitable habitat for other plants, such as sea oats and beach grass. Numerous shorebirds, including the least tern (Sterna antillarum), Wilson's plover (Charadrius wilsonia), black skimmer (Rhynchops niger), Caspian tern (Sterna caspia), and the endangered piping plover (Charadrius melodus) and roseate tern (Sterna dougallii dougallii), nest in seabeach amaranth stands [2].
The amaranth formerly occurred in 31 counties in nine states, from Massachusetts to South Carolina [1]. By 1988, it occurred only in North and South Carolina. Its decline was likely caused by beach development, dune stabilization and enhancement projects, off-road vehicles, recreation, exotic species and hurricanes. Severe weather in 1989 and 1990 (Hurricane Hugo, Hurricane Bertha, northeasters) caused the South Carolina population to decline by 90 percent (1,800 plants in 1988, 188-379 plants in 1990).* At the same time, 13 populations recolonized Long Island, N.Y., perhaps carried by the storms. Even with the inclusion of the Long Island populations, the species declined by 76 percent between 1988 and 1990. Since being placed on the endangered species list, the amaranth has recolonized New Jersey, Delaware, Maryland and Virginia. Annual population counts were not consistently made in South Carolina, but in the other six states, it increased dramatically from 14,899-17,174 in 1993 to 46,108-48,668 in 2004. While the species fluctuated dramatically (well over 100,000 plants in 2000, 2001, 2003 and fewer than 50,000 in 1999, 2002 and 2004), the trend between 1993 and 2004 was clearly upward.
New Jersey. Extirpated in 1913 [1]; recolonized in 2000 at four sites within Gateway National Recreation Area and several sites on Monmouth County municipal beaches [3]. The latter sites were created by a 1995 beach nourishment project by the Army Corps of Engineers. The 2000 population was 1,039; the 2005 population was 5,795-5,813 [5].
Delaware. Extirpated in 1875 [1]; recolonized in 2000 between the north end of Delaware Seashore State Park and Fenwick Island State Park [6]. The 2000 population of 32 plants grew to 423 in 2002, but declined to just six in 2005 [6, 7]. Some of the plants were found in protected piping plover nest areas [6]. There was no obvious change in habitat conditions that would explain the dramatic decline; it may reflect a natural population fluctuation [7].
Maryland. The amaranth was first found in 1967 at Assateague Island National Seashore in storm overwash areas, but was extirpated, probably due to failed Park Service dune construction and stabilization efforts in 1973 [1]. Two plants naturally recolonized the seashore in 1998 — the first sighting of the species between New York and North Carolina in 26 years. With Hurricane Bonnie approaching, the U.S. Park Service and the Maryland Department of Natural Resources removed one of the plants and took cuttings from the other. The cutting did not seed, and the wild plant was killed by Bonnie. The captured plant produced thousands of seeds, and some 5,400 of their greenhouse-raised offspring were outplanted between 2000 and 2002. The population increased to about 870 in 2001 and 2002, then stabilized at 480-560 plants in 2003-2005 [8].
Virginia. Extirpated in 1973 [1]; recolonized in 2001 with 10 plants, probably dispersers planting at Assateague Island National Seashore [8]. The population fluctuated without apparent trend and was at 30 plants in 2005.
New York. Extirpated about 1960 [1]. Recolonized in 1990 with 331 plants and increased to about 190,500 plants in 2002 before declining to 30,831 in 2004 [9]. Most amaranth sites are within areas symbolically fenced to protect endangered piping plovers.
North Carolina. The North Carolina population fluctuated significantly with lows of 490 (1991), 710 (1999), and 183 (2000) and highs of 29,993 (1992), 38,702 (1995) and 21,966 (2005) [10].
South Carolina. Amaranth populations declined from 1,334 in 1987 to zero and four plants in 1999 and 2000 [1, 10], but the population sizes in 2003 (1,381) and 2004 (2,110) were similar to the 1987 count [11]. The South Carolina Department of Natural Resources transplanted nearly 4,000 seedlings from greenhouses to barrier-island beaches in 2000-2001.
* There are minor discrepancies between reported counts in some years, likely due to a confusion of preliminary and final counts, timing of surveys, etc. [10]. We report the data as a range between the different reports. In all such cases, one of the numbers was provided by Dale Suiter of the U.S. Fish and Wildlife Service. The Service is in the process of systematizing the data and running statistical analyses.
CITATIONS
[1] U.S. Fish and Wildlife Service. 1993. Amaranthus pumlius (Seabeach Amaranth) determined to be threatened. April 7, 1993 (58 FR 18035).
[2] Randall, J. 2002. Bringing back a fugitive - seabeach amaranth. Endangered Species Bulletin, July-August 2002.
[3] Walsh, W. 2000. Regional News & Recovery Updates: Region 5. Endangered Species Bulletin, September, 2000.
[4] U.S. Fish and Wildlife Service.1996. Recovery Plan for Seabeach Amaranth (Amaranthus pumilus) Rafinesque. Atlanta, Georgia.
[5] Staples, J.C. 2005. Personal communication with John C. Staples, U.S. Fish and Wildlife Service, New Jersey Field Office, November 21, 2005.
[6] Pepper, M. 2004. 2004 Amaranthus pumilus (Seabeach amaranth) Survey Results. Unpublished report, Delaware Division of Fish and Wildlife, Natural Heritage and Endangered Species Program.
[7] McAvoy, W. 2005. Personal communication with William McAvoy, Botanist, Delaware Natural Heritage Program, November 7, 2005.
[8] Sturm, M. 2005. Personal communication with Mark Sturm, Assateague Island National Seashore, November 14, 2005.
[9] Young, S. 2005. Amaranthus pumilus Counts on Long Island 1990-2005. New York Natural Heritage Program Information.
[10] Suiter, D. 2005. Personal communication with Dale Suiter, U.S. Fish and Wildlife Service, Raleigh, NC, December 7, 2005 and February 22, 2006.
[11] Strand, A. 2005. Seabeach Amaranth 2004 census and seed rain estimates. Unpublished report, College of Charleston, Charleston, S.C.
[12] U.S. Fish and Wildlife Service. 2007. Seabeach Amaranth (Antaranthus pumilus) 5-Year Review: Summary and Evaluation. Raleigh, N.C.
Shortnose sturgeon (Acipenser brevirostrum)
| Status: Endangered | Critical habitat: none | Listed: 3/11/1967 | Recovery plan: 12/15/1998 |
Range: CT(b), DE(b), DC(b), FL(b), GA(b), ME(b), MD(b), MA(b), NY(b), NJ(b), NC(b), PA(b), SC(b), VA(b) --- NH(x), RI(x)
SUMMARY
The shortnose sturgeon formerly occupied rivers and estuaries along the Atlantic seaboard, but was driven to near extinction by overfishing, bycatch in the shad fishery, damming of rivers, habitat destruction and deterioration of water quality. At least five sturgeon populations have increased in number since listing. For example, the Lower Connecticut River population increased from approximately 875 adults in 1990 to 1,800 as of 2003.
RECOVERY TREND
The shortnose sturgeon (Acipenser brevirostrum) formerly occupied rivers and estuaries along the Atlantic seaboard from New Brunswick to northern Florida [1]. It was driven to near extinction by overfishing, bycatch in the shad fishery, damming of rivers, habitat destruction and deterioration of water quality. Scientists and fishermen in the 19th and early 20th centuries did not distinguish between Atlantic and shortnose sturgeon, so there are no historical population estimates. By the early 20th century, populations were known to be declining, and by the 1950s or earlier the species was considered imperiled. It was placed on the endangered species list in 1967.
Shortnose sturgeon populations are divided into 19 management units based on presumed reproductive isolation [1]. Recent genetic analysis generally supports the management units, but suggests that the Delaware River be combined with Chesapeake Bay and the Ogeechee River be combined with the Altamaha River [2]. The 1987 draft and 1988 final federal recovery plans recommended that each of the units be treated as a distinct population segment that can be recovered and delisted separately. The 1987 draft recommended downlisting the Connecticut, Delaware and Hudson river populations to "threatened" and delisting the Kennebec System population as recovered.
There are seven large populations (greater than 1,000 fish): Saint John River (NB), Kennebec System (ME), Connecticut River (CT, MA), Hudson River (NY), Delaware River (DE, NJ, PA), Savannah River (SC), and Altamaha River (GA). There are two small populations (fewer than 1,000 fish): Winyah Bay (SC, NC) and Ogeechee River (GA). There are 10 very small populations (<100 fish): Penobscot (ME), Merrimack River (MA), Chesapeake Bay (MD, VA), Cape Fear River (NC), Santee River (SC), Cooper River (SC), "ACE" Basin (SC), Satilla River (GA), St. Marys River (FL), St. Johns River (FL).
Five populations are ranked as improved: Kennebec System (ME), Connecticut River (CT, MA), Hudson River (NY), Savannah River (SC) and Altamaha River (GA). One population is ranked as stable: Delaware River (DE, NJ, PA). No populations are ranked as declining. Thirteen populations are ranked as unknown:
Saint John River (NB), Penobscot (ME), Merrimack River (MA), Chesapeake Bay (MD, VA), Winyah Bay (SC, NC), Cape Fear River (NC), Santee River (SC), Cooper River (SC), "ACE" Basin (SC), Satilla River (GA), Ogeechee River (GA), St. Marys River (FL) and St. Johns River (FL).
Five of the seven large populations, and four of the six improved/stable populations, are north of Chesapeake Bay. The southern populations are generally smaller and less known. Six of the seven large populations are improved/stable. All of the unknown populations are small/very small with the exception of the St. John River (NB). The later trend likely indicates that the small populations consist of numbers too small to support robust trend estimates. The species' overall trend has improved since being placed on the endangered species list in 1967.
IMPROVING POPULATIONS
* Kennebec System (Kennebec, Sheepscot, Androscoggin Rivers, ME). This population increased from an estimated 7,222 adults (95 percent CI 5,046-10,765) in 1977-1981 [1] to 9,488 in 1998-2000 [5]. The 1993 capture rate in the Adrosscoggin River was the highest ever recorded [1]. Since the 1998 removal of Kennebec Dam, the upstream range has increased [5].
* Connecticut River (CT, MA): Sturgeon in the upper and lower Connecticut River have been largely separated by the Holyoke Dam for 157 years. The Upper Connecticut River was estimated to support 297-515 total fish 1976-1978 and 47 and 98 spawning fish in 1992 and 1993 respectively [1]. The Lower Connecticut supported approximately 875 adults in 1988-1993 [1, 8] and 1,800 in 2003 [8].
* Hudson River (NY). The shortnose sturgeon occupies a 246-kilometer section of the Hudson River from New York City to Troy Dam upstream of Albany [4]. This population is larger than the other 19 management populations combined. From late spring through early fall adults use deep, channel habitats of the freshwater and brackish reaches of the estuary. In the late fall, most or all adults concentrate at a single overwintering site in the river channel near Kingston while juveniles remain in the estuary. In the spring, adults spawn at a single location slightly downstream of the Troy Dam. The larvae gradually disperse downstream with juvenile sturgeon that inhabit much of the estuary during the summer, but occupy a more limited range in the southern portion of the estuary during winter.
Due to fishing prohibitions and habitat protection efforts (the population has not been augmented with hatchery fish or translocations), numbers in the Hudson River increased dramatically between 1979 (12,669 spawning fish (95 percent CI = 9,080-17,735)), 1980 (13,844 (95 percent CI = 10,014-19,224)), and 1994-1996 (56,708 (95 percent CI = 50,862-64,072)) [4]. The size and age of individual fish and the demographic structure of the population as a whole indicate a healthy condition typical of nonendangered, long-lived species.
The 1998 federal recovery plan specifies that a sturgeon population is to be considered viable if it has at least 10,000 members, is on a stable or improving population trajectory, and is protected from degradation of its key habitat areas [2]. As the demographic parameters have been exceeded and the spawning and overwintering habitats appear stable, some biologists have recommended that the Hudson River population be designated as a distinct population segment and removed from the endangered species list as recovered species [4]. Delisting, however, would require the establishment of management agreements to guarantee long-term protection from unsustainable fishing, bycatch, pollution and habitat degradation.
* Savannah River (SC): Between 1984 and 1992, approximately 97,000 shortnose sturgeon were stocked in the Savannah River [1]. The 1999-2000 population had many more adults than in 1992, primarily due to presence of stocked fish, but there was little evidence of reproduction [3]. The 1999 population was estimated at 3,000 fish [5].
* Altamaha River (GA): Population estimates on the Altamaha River were 2,862 total fish in 1988 (95 percent CI=1,069-4,226) [1], 798 in 1990 (95 percent CI=645-1,045) [1], 468 in 1993 (95 percent CI=316-903) [1], and 5,910 (95 percent C.I. 4,740-7,848) in 2003-2005 [7].
STABLE POPULATIONS
* Delaware River (DE, NJ, PA): The Delaware River population was 6,408-14,080 in 1981-1984 [1], 10,000 in 2002 [6] and 8,445 in 2004 [5].
UNKNOWN POPULATIONS
* Saint John River (NB): The only Canadian population occurs in the Saint John River system, New Brunswick, including its tributary, the Kennebecasis River [11]. Construction of the Mactaquac Dam in 1967 closed off much the former spawning grounds while logging, development and pollution from agricultural and industrial sources degraded habitat and water quality. A fish lift was built into the dam, but there is no record of sturgeon using it, probably because the intake is only 1.8 m down in water 12.8 m deep. It is not known whether sturgeon persist above the dam. In the lower Saint John River below the dam, the 1973-1977 population was estimated at 18,000 adults (+/-30%) [11]. Surveys conducted in recent years were not sufficient to estimate a total population and were not comparable to prior surveys due to differences in methodology [11, 12]. Aboriginal people familiar with the river, however, tend to believe the population has declined since the construction of the Mactaquac Dam [11].
* Merrimack River (MA): unknown trend. The 1989-1990 population was estimated at 33 total fish [1].
* Penobscot (ME) Dennys, Machias, East Machias, Ducktrap: the last report is of a single fish in 1978 [2].
* Chesapeake Bay (MD, VA): unknown trend, very small population [1, 5].
* Winyah Bay (Waccama, Pee Dee, Black Rivers; SC, NC): unknown trend [1].
* Cape Fear River (NC): unknown trend, likely less than 50 individuals [1, 5].
* Santee River (SC): unknown trend [1].
* Cooper River (SC): unknown trend [1], 100-300 fish in recent years [5].
* "ACE" Basin (Ashepoo, Combahee, and Edisto Rivers; SC): unknown trend [1].
* Satilla River (GA): unknown trend
* Ogeechee River (GA): unknown trend. The 1993 population was estimated to have 266 adults [9] and 361 total fish [1]. The 1999 population was estimated at 195 adults, which was not statistically different from the 1993 estimate [9].
* St. Marys River (FL): unknown trend
CITATIONS
[1] National Marine Fisheries Service. 1998. Recovery Plan for the Shortnose Sturgeon (Acipenser brevirostrum). Silver Springs, Maryland. 104 pages.
[2] Wirgin, I., C. Grunwald, E. Carlson, J. Stabile, D.L. Peterson, and J. Waldman. 2005. Range-wide population structure of shortnose sturgeon Acipenser brevirostrum based on sequence analysis of the mitochondrial DNA control region. Estuaries 28(3):406-421.
[3] Smith, T. I. J., M. C. Collins, W. C. Post, and J. W. McCord. 2002. Stock enhancement of shortnose sturgeon: a case study. Pages 31–44 in W. VanWinkle, P. Anders, D. H. Secor, and D. Dixon, editors. Biology, management, and protection of North American sturgeon. American Fisheries Society, Symposium 28, Bethesda, Maryland.
[4] Bain, M.B, N. Haley, D.L. Peterson, K.K. Arend, K. Mills, and P. Sullivan, 2000. Shortnose sturgeon of the Hudson River: an endangered species success story. EPRI-AFS Symposium: Biology, Management and Protection of Sturgeon, 2000 Annual Meeting of the American Fisheries Society, St Louis, MO, August 23-24, 2000.
[5] National Marine Fisheries Service. 2004. Biennial Report to Congress on the Recovery Program for Threatened and Endangered Species, October 1, 2002–September 30, 2004.Washington (DC): Department of Commerce.
[6] National Marine Fisheries Service. 2002. Biennial Report to Congress on the Recovery Program for Threatened and Endangered Species, October 1, 2000–September 30, 2002.Washington (DC): Department of Commerce.
[7] DeVries, R.J and D.L. Peterson. 2006. Population dynamics and spawning habitat of shortnose sturgeon in the Altamaha River, Georiga. Georgia Chapter of the American Fisheries Society, 2006 Annual Meeting, Gainesville, GA, January, 2006.
[8] Connecticut Department of Environmental Protection. 2003. Working with Nature: Shortnose Sturgeon. Webpage (http://dep.state.ct.us/whatshap/press/2003/mf0730.htm) Accessed January 31, 2006.
[9] Bryce, T.D., Bryce, J.E. Fleming and J.P. Kirk. 2002. Fort Stewart Assesses Status of Shortnose Sturgeon: A 2001 Update. Environmental Update, A Quarterly Publication of Army Environmental News 14 (1). Available at (http://aec.army.mil/usaec/publicaffairs/update/win02/win0220.html).
[10] Crossman, J.A., A. Giberson, R. Hardy, R.M. Browne, and M.K. Litvak. 2003. Estimating population size and wild growth rates of the shortnose sturgeon (Acipenser brevirostrum) in the St. John River, NB. Canadian Conference for Fisheries Research and the Canadian Society of Limnologists, January 2-5, 2003, Ottowa, ON.
[11] COSEWIC. 2005. COSEWIC assessment and update status report on the shortnose sturgeon Acipenser brevirostrum in Canada. Committee on the Status of Endangered Wildlife in Canada. Ottawa. vi + 27 pp.
[12] Litvak, M.K. 2006. Personal communication with Matthew K. Litvak, Department of Biology, University of New Brunswick, St. John, NB, February 1, 2006.
Small whorled pogonia (Isotria medeoloides)
| Status: Threatened | Critical habitat: none | Listed: 9/9/1982 | Recovery plan: 11/13/1992 |
Range: CT, DC, DE, GA, IL, MA, MD, ME, MI, MO, NC, NH, NJ, NY, PA, RI, SC, TN, VA, VT, WV, OH
SUMMARY
The small whorled pogonia is threatened by loss of forest habitat to residential development and roads, trampling, grazing and closure of forest canopies. Many populations are vulnerable to extinction because of their small size. It was listed as endangered in 1982 and downlisted to "threatened" status in 1994. Known sites increased from 33 in 1985 to 150 in 2007.
RECOVERY TREND
The small whorled pogonia (Isotria medeoloides) is a rare orchid of relatively open eastern deciduous and coniferous forests [1].
It formerly occurred in 48 counties in 16 states and Canada. When placed on the endangered species list in 1982, it was thought to exist in only 17 counties in 10 states and at one site in Ontario, Canada. By 1985 it was known from 34 sites, by 1991, 86 sites in 15 states, and by 1993 it was known from 104 sites in 15 states. The 104 sites included 66 in the Appalachian Mountains in New England and northern coastal Massachusetts ((Maine (17), New Hampshire (42), Massachusetts (five), Rhode Island (one), Connecticut (10)), 13 in the Coastal Plain and Piedmont ((New Jersey (three), Delaware (one), Virginia (nine)), 18 in the Southern Appalachians ((North Carolina (five), South Carolina (four), Georgia (eight), Tennessee (one)) and seven disjunct populations ((Pennsylvania (three), Ohio (one), Michigan (one), Illinois (one), Ontario (one)).
Since 1993, additional small populations were discovered in the southern portion of the pogonia's range, and in New Hampshire and Maine [4]. In 1999, a new population was documented for the first time in West Virginia, but it remained extirpated from Vermont, New York, Maryland, Missouri and the District of Columbia. As of 1998, plants had not been found at the Ontario site since the sighting of a single individual in 1989 [3]. As of 2008, the species was known to occur at 150 sites [5]. In 2010 it was rediscovered in Schunnemunk Mountain State Park, New York [6].
The 1992 revised recovery plan stipulates that downlisting to "threatened" status should be initiated when 25 percent of the viable populations known as of 1992 are protected, and proportionally distributed throughout the species' range [2]. The species was downlisted to “threatened” in 1994 based on finding that 23 percent of all sites were viable and protected, and 62 percent of viable populations were protected [1].
Delisting is to be initiated when there at least 61 sites which 1) are permanently protected; 2) represent at least 75% of self-sustaining populations over a ten-year period; and 3) management commitments or sufficient habitat exist to allow existing sites to expand. In its 2008 Five-Year Review, the U.S. Fish and Wildlife Service concluded that the three additional criteria had not been met, but that the species was “on the brink of recovery.” The agency recommended updating the recovery plan delisting criteria based on improved understanding of the species' natural history.
CITATIONS
[1] U.S. Fish and Wildlife Service. 1994. Final rule to reclassify the plant Isotria medeoloides (small whorled pogonia) From endangered to threatened. U.S. Fish and Wildlife Service. October 6, 1994 (59 FR 50852-50857).
[2] U.S. Fish and Wildlife Service. 1992. Small whorled pogonia (Isotria medeoloides) Recovery plan. Hadley, MA.
[3] White, D.J. 1998. Update COSEWIC status report on the Small Whorled Pogonia Isotria medeoloides in Canada. Committee on the Status of Endangered Wildlife in Canada. Ottawa.
[4] U.S. Marine Corps. Small whorled pogonia (Isotria medeoloides). Poster available at (www.fws.gov/endangered/photos/posters/Pogonia.pdf)
[5] U.S. Fish and Wildlife Service. 2008. Small Whorled Pogonia (Istotria medeoloides) 5- Year Review: Summary and Evaluation. New England Field Office, Concord, NH. 26 pp.
[6] Smith, K. J. and S. Young. 2011. Rediscovery of Two Federally Listed Rare Plant Species in New York. Northeast Natural History Conference 2011. Available at http://nysparks.com/environment/documents/presentations/RediscoveryOf2FederallyListedRarePlantSpeciesInNY.pdf.
| Status: Threatened | Critical habitat: 4/1/1976 | Listed: 10/9/1975 | Recovery plan: 5/5/1983 |
Range: AL(b), GA(b), TN(b) ---
SUMMARY
Impoundments in the Tennessee River drainage caused the extirpation of the snail darter from parts of the mainstem and the lower reaches of the major tributaries of the Tennessee River. Assuming that all natural populations existed in 1974, the number of snail darter populations has increased from six to nine through reintroductions and the recolonization of historic habitat.
RECOVERY TREND
The snail darter (Percina tanasi) was discovered in 1973 in the lower Little Tennessee River. Prior to construction of impoundments in the Tennessee River drainage, it likely occurred in the mainstem of the Tennessee River and the lower reaches of its major tributaries from Fort Loudon downriver to the confluence of the Paint Rock River in Alabama [1]. Initially thought to occur only in the Little Tennessee River, natural populations of the species were subsequently found at five locations:
Tennessee River. The darter occupies reaches below the confluence of the Little Tennessee River, below Watts Bar Dam, below Nickajack Dam and below Chickamauga Dam [7].
South Chickamauga Creek. Discovered in 1980 [2], this population ranges from the Tennessee River confluence upstream 19.5 miles [7].
Sewee Creek. A substantial population was discovered in 1991 [2]. In ranges from the Tennessee River confluence upstream 6 miles [7].
Paint Rock River. Small numbers of darters occur in the Paint Rock River [2, 8].
Sequatchie River. The snail darter existed in very small numbers in the Sequatchie River, but may be extirpated [2, 8]
It was introduced to, or colonized, seven rivers after being listed:
Hiwassee River. A population of 710 fish was introduced in 1975 and 1976, growing to an estimated 2,500 fish by 1979 [2, 3]. The population ranges from the 35.8-mile point, upstream to the Bradley/Polk county line and from the Bradley County line to the confluence of the Ocoee River [7]. It was considered relatively abundant in 2004 [1].
Holston River. A population of 531 fish was introduced in 1978 and 1979 from the Hiwassee and Little Tennessee Rivers [2]. It ranges from the Tennessee River confluence upstream 14.5 miles [7]. The population grew as habitat conditions improved [4] and was considered relatively abundant in 2004 [1]. But others report that the population has not done as well as the TVA expected [8].
Little River. The Little River was colonized by the Holston River population in about 1979 [8]. It was relatively abundant in 2004 [5].
French Broad River. A population was discovered in 1988 upstream from the confluence with the Holston River and is believed to have been colonized by the Holston River population [1]. It ranges from the Tennessee River confluence upstream 30 miles [7]. The species was downlisted to “threatened” in 1984 [9]. The population was relatively abundant in 2004 [1].
Elk River. A population of 425 snail darters from the Little Tennessee River was introduced in 1980 [2], but was extirpated in the early 1980s [8].
Nolichucky River. A population of 61 fish was introduced in 1975, but the program was discontinued after the discovery of sharphead darters in the river for fear of impacting the rare species [3]. It was extirpated in the early 1980s [8].
A single snail darter was found in the Ocoee River in 1993 and has not been seen since [8]. It was probably a disperser from the Hiwassee River population [4].
Assuming that all natural populations existed in 1974 regardless of when they were discovered, the number of snail darter populations has increased from six to nine since being placed on the endangered list in 1975. All of the increase is due to the creation of new populations or the recolonization of historic habitat by the created populations.
CITATIONS
[1] U.S. Fish and Wildlife Service. 2004. Bioloigcal Opinion on the Reservoir Operations Study (ROS) located in the Tennessee River Valley in Alabama, Georgia, Kentucky, Mississippi, North Carolina, Tennessee, and Virginia. U.S. fish and Wildlife Service, Febraury 9, 2004.
[2] U.S. Fish and Wildlife Service. 1992. Snail Darter, Percina (Imostoma) tanasi. U.S. Fish and Wildlife Service, Endangered and Threatened Species of the Southeastern United States, www.fws.gov/endangered/i/e/sae15.html
[3] Fuller, P. 2004. Percina tanasi. U.S. Geological Survey, Nonindigenous Aquatic Species Database, Gainesville, FL. <http://nas.er.usgs.gov/queries/factsheet.asp?SpeciesID=827> Revision Date: 7/27/2004
[4] Shute, P.W. and D.A. Etnier. 1999. 1999 Report of Region 3 - North-Central. Southeastern Fishes Council , www.flmnh.ufl.edu/fish/organizations/sfc/regionalreports/R3NC1999.htm
[5] Godwin, J. 1999. Threatened and Endangered Fish of Alabama, http://www.forestry.state.al.us/publication/TF_publications/tfspring99/endangered_fish_of_al.htm
[6] U.S. Fish and Wildlife Service. 1983. Snail Darter Recovery Plan. U.S. Fish and Wildlife Service, Atlanta, Georgia. 40+pp.
[7] The University of Tennessee Center for Industrial Services. 1997. Go with the flow: Tennessee’s New Storm Water Multi-Sector Permits. The Tennessee Department of Environment and Conservation and The University of Tennessee Center for Industrial Services, Nashville, TN.
[8] Barclay, L. 2005. Personal communication with Lee Barclay, Supervisor, Tennessee Field Office, U.S. Fish and Wildlife Service, October 6, 2005.
[9] U.S. Fish and Wildlife Service. 1984. Final Rule Reclassifying the Snail Darter (Percina Tanasl) From an Endangered Species to a Threatened Species. 49 Fed. Reg. 27510.
Tennessee coneflower (Echinacea tennesseensis)
| Status: Delisted | Critical habitat: none | Listed: 6/6/1979 | Recovery plan: 11/14/1989 |
Range: TN
SUMMARY
The Tennessee coneflower was listed as endangered in 1979 due to loss of habitat for residential and recreational development, succession of cedar glade communities and grazing. In 1979 there were three known populations, and in 1989 there were five populations. In 2011 the species was removed from the endangered list, with six populations and an estimated 107,349 total flowering stems.
RECOVERY TREND
The Tennessee coneflower (Echinacea tennesseensis) is a large, showy, purple perennial restricted to cedar glades in a 154-square-mile section of central Tennessee near Nashville [1, 16]. Cedar glades are forest openings created when limestone approaches the earth's surface, leaving a thin layer of soil incapable of supporting trees or large shrubs. They are hotter and drier than the surrounding forest during the summer, and wetter during the winter and spring. Their unique conditions have promoted the evolution of 19 cedar glade endemics.
The Tennessee coneflower is naturally rare, but habitat destruction has further reduced its population size [1].
It was placed on the federal endangered species list in 1978. Due to the establishment and discovery of new populations, the expansion of existing populations, development of successful propagation techniques, and increased protection for all populations, the species has been under consideration for downlisting to threatened status since 1997, and was delisted in 2011 [13, 16].
As of 2011, there were six populations and 35 colonies made up of an estimated 107,349 total flowering stems [16]. Some of the natural populations have been augmented with introduced subpopulations. There is one whole introduced population and several cultivated sites that are not considered "populations" for conservation purposes.
Vine Population. This is the largest population and contains the largest unprotected subpopulation [2]. The public portion of the population occurs within the 35-acre Cedar Glade Natural Area of the Cedars of Lebanon State Forest [9]. The state natural area was designated in 2000 and is jointly managed by the Tennessee Division of Forestry and the Tennessee Department of Environment and Conservation Division of Natural Heritage. Vine's largest subpopulation is Gattinger's Glade (also known as Harding Glade) within the Gattinger's Cedar Glade and Barrens Natural Area [x]. This 57-acre conservation easement was designated as a state natural area in 2003 as part of a mitigation plan for the development of the Nashville SuperSpeedway [3]. It was fenced with funding from the U.S. Fish and Wildlife Service and is jointly managed by the Nashville SuperSpeedway and the Department of Environment and Conservation Division of Natural Heritage.
Couchville Cedar Glade State Natural Area. This 122-acre site supports one of the largest populations [4]. It was designated as a natural area in 1995, expanded to protect more coneflower sites in 2001 and is jointly managed by the Tennessee Department of Environment and Conservation Division of Natural Heritage and the Long Hunter State Park.
Mount View Road Cedar Glade. This site was purchased by The Nature Conservancy in 1989 and transferred to the Tennessee Department of Environment and Conservation in 2005 [7, 8].
Vesta Cedar Glade Natural Area. This 150-acres site was designated as a natural area in 1986 [10]. It is jointly managed by the Tennessee Division of Forestry and the Tennessee Department of Environment and Conservation Division of Natural Heritage.
Allvan Glade. It is unclear how many subpopulations are in this population and which land parcels they occur on. One natural subpopulation exists on U.S. Army Corps of Engineers land at J. Percy Priest Reservoir [2]. Another subpopulation was destroyed in 2005. The 185-acre Elsie Quarterman Cedar Glade Natural Area is on Army Corps land and supports a coneflower subpopulation which was introduced from an unprotected parcel of private land in 1989 [6]. It was designated as a natural area in 1998 and is co-managed by the Tennessee Wildlife Resource Agency (as a Wildlife Management Area), the Army Corps, and the Tennessee Department of Environment and Conservation. The 230-acre Fate Sanders Barrens Natural Area was established in 1999 on Army Corps land and supports a subpopulation that was introduced from unprotected private lands [15].
Stone's River Cedar Glade and Barren Natural Area. This 185-acre site within the Stone's River National Battlefield was designated as a natural area in 2003 [5]. It supports two subpopulations totaling more than 2,500 plants [5]. There are apparently two additional subpopulations on the national battlefield [1]. Two of the subpopulations were planted in the early 1970s and two are of unknown origin. The natural area is jointly managed by the Stone’s River National Battlefield and the Tennessee Department of Environment and Conservation.
Cultivated sites include the Warner Park Nature Center [12] and the 160-acre Cheekwood Botanic Garden, Owl's Hill Nature Center [11]. Coneflowers were planted on the latter in 1960s and are still present. Tennessee coneflower seeds are also sold to home gardeners by licensed horticulturists [12] and are being grown on an experimental rooftop garden designed to replicate a cedar glade [14].
CITATIONS
[1] Walck, J.L., T.E. Hemmerly, and S.N. Hidayati. 2002. The Endangered Tennessee Purple Coneflower, Echinacea tennesseensis (Asteraceae): Its Ecology and Conservation. Native Plants Journal 3: 54-64
[2] Lincicome, D. 2006. Personal communication with David Lincicome, Tennessee Department of Environment and Conservation, Division of Natural Heritage, Nashville, TN, January 13, 2006.
[3] TDEC. Gattinger's Cedar Glade and Barrens Natural Area, Class II Natural-Scientific State Natural Area. Tennessee Department of Environment and Conservation website: www.tennessee.gov/environment//nh/natareas/gattinger/gattinger2.pdf
[4] TDEC. Couchville Cedar Glade State Natural Area, Class II Natural-Scientific State Natural Area. Tennessee Department of Environment and Conservation website: http://www.tennessee.gov/environment//nh/natareas/couchville/couchville2.pdf
[5] TDEC. Stone's River Cedar Glade and Barren Natural Area, Class II Natural-Scientific State Natural Area. Tennessee Department of Environment and Conservation website: www.tennessee.gov/environment//nh/natareas/stonesriver/stonesriver2.pdf
[6] TDEC. Elsie Quarterman Cedar Glade Natural Area, Class II Natural-Scientific State Natural Area. Tennessee Department of Environment and Conservation website: www.state.tn.us/environment/nh/natareas/elsie/
[7] TNC. Mount View Road Cedar Glade. The Nature Conservancy website available at: http://nature.org/wherewework/northamerica/states/tennessee/preserves/art10125.html
[8] TNC. 2005. Four Preserves Being Transferred to State. Field Notes 2(1):2, The Nature Conservancy-Tennessee Chapter. Available at http://nature.org/wherewework/northamerica/states/tennessee/files/field_notes.pdf
[9] TDEC. Vine Cedar Glade Natural Area, Class II Natural-Scientific State Natural Area. Tennessee Department of Environment and Conservation website: www.state.tn.us/environment/nh/natareas/vine/
[10] TDEC. Vesta Cedar Glade Natural Area, Class II Natural-Scientific State Natural Area. Tennessee Department of Environment and Conservation website: www.tennessee.gov/environment/nh/natareas/vesta/
[11] Owl's Hill Nature Center. Checkwood Botanical Garden, www.cheekwood.org/nature/hike/wildflowers/cone.html
[12] U.S. Fish and Wildlife Service. 1991. Endangered and Threatened Species of the Southeastern United States (The Red Book), Tennessee purple coneflower (Echinacea tennesseensis). U.S. Fish and Wildlife Service, Atlanta, GA.
[13] McKeown, K.A. 1999. A review of the taxonomy of the genus Echinacea. p. 482–489. In: J. Janick (ed.), Perspectives on new crops and new uses. ASHS Press, Alexandria, VA.
[14] Greenroofs.com. Greenroof Projects Database: Neuhoff Packing Plant Redevelopment. www.greenroofs.com/projects/pview.php?id=15
[15] TDE. 2006. Fate Sanders Barrens Natural Area, Class II Natural-Scientific State Natural Area. Tennessee Department of Environment and Conservation website: www.state.tn.us/environment/nh/natareas/fatesanders/
[16] U.S. Fish and Wildlife Service. 2011. Removal of Echinacea tennesseensis (Tennessee Purple Coneflower) From the Federal List of Endangered and Threatened Plants. August 3, 2011. 76 FR 46632.
Virginia big-eared bat (Corynorhinus townsendii virginianus)
| Status: Endangered | Critical habitat: 11/30/1979 | Listed: 11/30/1979 | Recovery plan: 5/8/1984 |
Range: KY(s), NC(s), VA(b), WV(b) ---
SUMMARY
The Virginia big-eared bat is threatened by destruction and disturbance of its maternity and hibernation caves. White-nose syndrome also poses a major threat to this and many other hibernating bat species. At the time of listing in 1979, this big-eared bat’s population was estimated at 3,500 bats. By 2000, it had grown to 18,442. Most of its essential caves have been protected by private and government agencies.
RECOVERY TREND
The Virginia big-eared bat (Corynorhinus townsendii virginianus) had a population of about 3,500 bats when it was listed as an endangered species in 1979 [9]. It increased to about 10,000 during the 1980s [2], 15,000 during the 1990s [3, 4], and was estimated at 18,442 bats after the last count in 2000 [4].
VIRGINIA
Virginia has two important big-eared bat caves, both in Tazewell County [1]. Tazewell County #1 is a maternity cave accessed by a 10-foot deep hole in the earth. The known population has increased from 100 in 1978 and 80 in 1985 to an average of about 400 between 1991 and 2002. It was not surveyed in 2003-2005. It is unclear whether the increase is due to better survey techniques or population growth.
Tazewell Count #2 is both a maternity and hibernaculum cave. The maternity population grew from the 200s in 1991 and 1992 to an average of about 550 from 1993 to 1999. Equipment failure precluded a 2002 count, but the surveyors believed the population size to be similar to previous years. The hibernaculum was estimated at 2,000 bats between 1985 and 1990 based on subjective reports by cavers. Systematic surveys began in 1993. Prior to construction of a protective gate, the population was 476 in 1993 and 525 in 1995. The post-gate population was 1,600 in 1996 and 1,160 in 1999, with the latter year considered low due to unusual warmth. Surveys were discontinued in 2001 due to safety concerns over the unstable 100+ foot drop entrance.
The overall Virginia trend suggests a increase in the observed maternity population to about 950 females in the 1990s, and an increase in the hibernacula population to about 1,600 observed bats. Based these observed numbers, the state population has been estimated at about 2,200 bats [2, 3, 4].
NORTH CAROLINA
The population grew from 160 bats in 1992 [3] to 260 in 2000 [4].
KENTUCKY
Kentucky supports one major hibernaculum (Stillhouse Cave), which is surveyed every odd year [8]. It remained stable with about 1,000 bats from 1964 to 1974, then increased steadily 6,335 in 2001 before declining to 4,370 in 2005. The statewide population increased from 3,850 in 1992 [3] to 5,105 in 2000 [4].
WEST VIRGINIA
West Virginia has 10 occupied big-eared bat caves [6]. The eight caves systematically surveyed between 1983 and 2005 grew relatively steadily from 3,327 bats to 4,889. All 10 caves were systematically surveyed from 1992 to 2005, growing from 5,699 bats to 6,238 in 2004 before declining to 5,990 in 2005.
- The Arbogast/Cave Hollow population increased from 650 bats (1983) to 1,137 (1988) after a year-round closure was instituted and fence erected [5]. Vandals broke into the cave and built a fire near the maternity roost site between June 1988 and June 1989, reducing the population to 286 bats in 1989. The entrance was subsequently gated and the population slowly but steadily climbed to 648 in 2005 [6].
- The Lambert Cave population declined between 1999 and 2000 when the large tree next to its entrance died, allowing sunlight to increase herbaceous vegetation that blocked the entrance [7]. The West Virginia Department of Natural Resources has controlled the vegetation and planted a new tree at the site, causing the population to bounce back.
- The Cliff maternity site was discovered in 1992 and was the first or second largest through 2005 [6].
WHITE-NOSE SYNDROME
Scientists are concerned about white-nose syndrome infecting the Virginia big-eared bat [11]. There has been no evidence of white-nose syndrome in Virginia big-eared bats yet, but the fungus has been found in the caves where the bats hibernate. Given the lethality of white-nose syndrome and this species’ already low population levels, in November 2009 the National Zoo attempted to establish a captive Virginia big-eared bat colony as a precaution against extinction [12]. Out of 40 uninfected bats that captured in autumn, eight survived the hibernation season [13]. The Zoo's bat team encountered problems feeding the bats, which were lethargic due to hibernation, and prefer to eat while flying. The surviving bats were eventually habituated to eating mealworms from feeding pans, but other food types were refused. Other problems with dermatitis and extremity function led to additional mortality.
CITATIONS
[1] Reynolds, R. 2005. Corynorhinus townsendii virginianus Survey Counts for Virginia. Unpublished report, Virginia Department of Game and Inland Fisheries.
[2] NatureServe. 2005. NatureServe Explorer: An online encyclopedia of life [web application]. Version 4.5. NatureServe, Arlington, Virginia.
[3] U.S. Fish and Wildlife Service. 1992. Endangered and Threatened Species of the Southeastern United States. U.S. Fish and Wildlife Service, Atlanta, GA. (www.fws.gov/endangered/i/a/saa7r-.html)
[4] Currie, R. 2000. Federally listed threatened and endangered species of concern to mining. Paper presented at Bat Conservation and Mining: A Technical and Interactive Forum, November 14-16, St. Louis, MO.
[5] Stihler, C. 2003. Shedding Light On West Virginia's Cave-Dwelling Bats. West Virginia Wildlife Magazine, Summer 2003.
[6] Stihler, C. 2005. Virginia big-eared bat summer colony censuses. Draft report by Craig Stihler, West Virginia Department of Natural Resources, November 28, 2005.
[7,] Stihler, C. 2005. Personal communication with Craig Stihler, West Virgina Department of Natural Resources, November 28, 2005.
[8] Hemberger, T. 2005. Personal communication with Traci Hemberger, Endangered Species Biologist, Kentucky Department of Fish and Wildlife Resources, December 2005.
[9] U.S. Fish and Wildlife Service. 1979. Listing of Virginia and Ozark Big-eared Bats as Endangered Species and Critical Habitat Determination, November 30, 1979 (44 FR 69206).
[10] U.S. Fish and Wildlife Service. 2008. Virginia Big-Eared Bat (Corynorhinus townsendii virginianus) 5-Year Review: Summary and Evaluation. Elikins, WV. 21 pp.
[11] Smithsonian Conservation Biology Institute. 2011. White-Nose Syndrome. Available online at http://nationalzoo.si.edu/scbi/SpeciesSurvival/VirgianiaBigEaredBats/default.cfm. Accessed October 7, 2011.
[12] Mother Nature Network. 2010. White-nose syndrome and the Virginia big-eared bat. Available online at http://www.mnn.com/local-reports/washington-dc/local-blog/white-nose-syndrome-and-the-virginia-big-eared-bat. Accessed October 7, 2011.
[13] Smithsonian Conservation Biology Institute. 2011. Virginia Big-eraed Bats at the National Zoo. Available online at http://nationalzoo.si.edu/scbi/SpeciesSurvival/VirgianiaBigEaredBats/zooproject.cfm . Accessed October 17, 2011.
Virginia round-leaf birch (Betula uber)
| Status: Threatened | Critical habitat: none | Listed: 4/26/1978 | Recovery plan: 9/24/1990 |
Range: VA(b) ---
SUMMARY
The Virginia round-leaf birch occurs only in Virginia's Cressy Creek watershed, where it was nearly driven to extinction by habitat degradation from logging and agriculture. Previously thought extinct, 41 trees were rediscovered in 1975, but declined to 39 then 26 over next two years. It was listed as an endangered species in 1978. By 2003, breeding, reintroduction and protection produced 961 wild trees in 20 populations.
RECOVERY TREND
Virginia round leaf birch (Betula uber), a moderate-sized tree with aromatic bark and a compact crown, was discovered in a single creek drainage in 1918 [1]. It was later thought extinct until the rediscovery of 41 trees along the banks of Cressy Creek in 1975 [1].
All 41 trees occurred within a 100-meter-wide band of highly disturbed second-growth forest along a one-kilometer stretch of the Cressy Creek floodplain [1]. Both public and private land was included in this strip and the population was entirely surrounded by agricultural land [1]. Extensive searches of the surrounding area did not uncover additional populations and by 1977, the one known population had declined to 26 trees, prompting the creation of the “Betula Uber Protection, Management and Research Coordinating Committee” [2]. Through their efforts, in 1978 the Virginia round leaf birch became the first tree species to gain protection under the Endangered Species Act [2].
In 1981, two areas were cleared of vegetation near potential seed sources in an effort to enhance natural regeneration [1]. Eighty-one round-leaf birch seedlings were found in one cleared area; however, all of the seedlings that remained at the end of the second growing season were gone (probably a result of vandalism) by 1986 [1].
Seeds were also gathered, germinated under greenhouse conditions, and held in cultivation for two to three growing seasons [1]. Starting in 1984 these seedlings were transplanted to 20 clearings that had been created in wooded areas of the Cressy Creek Watershed [1]. Five populations per year were established over a four-year period [1]. Each newly established population consisted of 96 individuals [1]. Measures such as fencing trees from browsers and removing competing vegetation were taken to promote the establishment of these populations [1]. The U.S. National Arboretum also produced 50 plants that were distributed to arboreta, botanical gardens and nurseries [1].
Although the single wild-seeded population of Virginia round leaf birch has continued to decline [2], as of 1994, 19 of the 20 introduced populations were thought to be self sufficient and totaled 1,400 trees, most of which occur on the Jefferson National Forest. This led to the 1994 rule to downlist the round leaf birch to threatened [1].
As of 2003, eight of the original 41 trees remained, along with an additional 953 cultivated trees for a total of 961 [3].
CITATIONS
[1] U.S. Fish and Wildlife Service. 1994. Reclassification of the Virginia Round-Leaf Birch (Betula Uber) From Endangered to Threatened. Federal Register, 59 FR 59173.
[2] U.S. Fish and Wildlife Service. 2005. Virginia round leaf birch (Betula Uber). Northeast Region U.S. Fish and Wildlife Service. Hadley, MA. Accessed at http://www.fws.gov/northeast/pdf/vabirch.pdf on 11/23/05.
[3] U.S. Fish and Wildlife Service. 2006. Virginia Round-Leaf Birch Betula uber (Ashe) Fernald 5-Year Review: Summary and Evaluation. Gloucester, VA. 26 pp.
Whooping crane (Grus americana)
| Status: Endangered | Critical habitat: 5/15/1978 | Listed: 3/11/1967 | Recovery plan: 3/30/2007 |
Range: CO(m), FL(b), GA(m), IL(m), IN(m), KS(m), KY(m), MT(m), NE(m), ND(m), OK(m), SD(m), TN(m), TX(s), WI(b), WY(m) --- AL(x), AR(x), DE(x), DC(x), IA(x), LA(x), MD(x), MN(x), MS(x), MO(x), NJ(x), NC(x), OH(x), SC(x), UT(x), VA(x), WV(x)
SUMMARY
The whooping crane declined precipitously in the late 1800s and early 1900s due to hunting and habitat loss. It remains threatened by habitat degradation, collisions with power lines, and oil and gas development. When listed as endangerd in 1967, the whooping crane consisted of 43 wild and 7 captive birds. By 2011, it had grown to 437 wild and 162 captive birds.
RECOVERY TREND
The whooping crane (Grus americana) formerly occurred from the Arctic coast to central Mexico, and from Utah to New Jersey, South Carolina, Georgia and Florida [1]. In the 19th and 20th century, it's primary nesting area extended from central Illinois, northwestern Iowa, northwestern Minnesota, and northeastern North Dakota northwesterly through southwestern Manitoba, southern Saskatchewan and into east central Alberta. Wintering grounds and migration routes included much of the United States east of the Rocky Mountains. As of 2012, whooping cranes nest in the wild at only three locations:
1) Wood Buffalo National Park and adjacent areas in Canada (this population winters in Aransas National Wildlife Refuge, Texas),
2) Central Florida (this is an introduced, non-migratory population), and
3) Wisconsin (this population winters in Florida) [1].
An effort to reintroduce whooping cranes into the Rocky Mountain area by cross-fostering whooping cranes to sandhill crane foster parents was abandoned when the last whooping crane introduced into this population died in 2002 [1]. Captive whooping crane populations are maintained at the Calgary Zoo, International Crane Foundation, Patuxent Wildlife Research Center, San Antonio Zoo, New Orleans Zoo, Lowry Park Zoo, and the Audubon Center for Research on Endangered Species.
Whooping crane populations in 1870 were variously estimated at 1,300 to 1,400 and 500 to 700 birds, but then declined precipitously due to hunting and habitat destruction [1]. Conservation efforts were able to maintain an extremely endangered but relatively stable population of 21 to44 birds between 1938 and 1966 [2]. When placed on the endangered species list in 1967, just 48 wild and six captive birds remained. In 1978, critical habitat was designated in parts of Idaho, Kansas, Nebraska, Oklahoma and Texas, primarily on federal and state wildlife management lands [3]. Due to intensive habitat management, nest area protection, captive breeding and reintroductions, the population rose steadily to 513 (368 wild and 145 captive) birds in 2006. [2, 4]. Estimates as of May 2007 indicated a population decline of 31 birds [5], due in part to a storm that killed 17 of 18 birds being held at the Chassahowitzka National Wildlife Refuge in Florida. The total population was 372 in 2000 and jumped to 599 in 2011 [8].
The 2003 draft international recovery plan sets forth two alternate criteria for downlisting the whooping crane to threatened status: 1) The Aransas-Wood Buffalo population must have at least 160 total birds with at least 40 productive pairs, and two additional separate self-sustaining populations must have at least 25 productive pairs and 100 total birds each. All three populations must maintain their status for a decade; or the Aransas-Wood Buffalo population must have 250 reproducing pairs and a total of 1,000 birds [1]. In either scenario, at least 21 productive pairs and 153 total birds must be maintained in captivity. Downlisting is estimated to occur in 2035. Delisting criteria have not yet been established.
Current threats to the species include low genetic diversity, loss and degradation of migration stopover habitat, construction of power lines, the proposed Keystone XL pipeline, degradation of coastal habitat, and in Texas, the threat of chemical spills [1].
CITATIONS
[1] Canadian Wildlife Service and U.S. Fish and Wildlife Service. 2007. International Recovery Plan for the Whooping Crane (Grus americana), Third Revision Albuquerque, New Mexico. 196 pp. http://ecos.fws.gov/docs/recovery_plans/2007/070604_v4.pdf
[2] Didrickson, B. 2011. Historic Whooping Crane Numbers: 1939-2011. International Crane Foundation. www.savingcranes.org/images/stories/site_images/conservation/whooping_crane/pdfs/historic_wc_numbers.pdf
[3] U.S. Fish and Wildlife Service. 1978. Determination of critical habitat for the whooping crane. 43 FR 20938.
[4] Stehn, T. 2007. Whooping crane numbers - November 22, 2006. Report provided by Tom Stehn, U.S. Fish and Wildlife Service, on May 16, 2007.
[5] Stehn, T. 2007. Whooping crane numbers - May 14, 2007. Report provided by Tom Stehn, U.S. Fish and Wildlife Service, on May 16, 2007.
[6] Dinnage, R.J. 2007. Federal whooping crane relocation program suffers setback. Land Letter, February 2007.
[7] U.S. Geological Survey. 2010. The Whooping Crane: Return from the Brink of Extinction. Http://whoopers.usgs.gov/publications/CraneInfoSheet_4pp.pdf. Accessed October 5, 2011.
Wood stork (U.S. breeding DPS) (Mycteria americana (U.S. breeding DPS))
| Status: Endangered | Critical habitat: none | Listed: 2/28/1984 | Recovery plan: 5/18/1999 |
Range: AL(s), FL(b), GA(b), MS(s), NC(s), SC(b) ---
SUMMARY
A loss of suitable wetland feeding habitat reduced wood stork populations from an estimated 15,000-20,000 pairs in the late 1930s to around 5,000 pairs in the late 1970s. The number of wood stork nesting colonies increased from 29 at the time of listing in 1984 to 71 in 2002 and numbers of nests increased from an estimated 6,040 in 1984 to approximately 12,000 in 2009.
RECOVERY TREND
The wood stork (Mycteria americana) is the only species of stork that regularly occurs in the United States [1]. It may once have bred in all the southeastern coastal states from Texas to South Carolina, but today, the wood stork breeds only in Florida, Georgia and coastal South Carolina [1]. Post-breeding birds can sometimes be seen as far north as North Carolina and as far west as Mississippi and Alabama [1]. Precipitous declines in the wood stork’s range and population occurred during the mid-1900s [2]. The total population in the southeastern U.S. declined from an estimated 15,000 to 20,000 pairs in the 1930s to between 4,500 and 5,700 pairs in most years between 1977 and 1980 [1]. This decline was accompanied by a major shift in breeding abundance from southern Florida (where large colonies numbering between 5,000 and10,000 nesting pairs were found [1]) to a much more dispersed distribution northward though peninsular Florida and into coastal Georgia and South Carolina [3] where colonies formed at artificial water impoundments [4]. The decline in wood stork populations was primarily due to loss of suitable feeding habitat [1]. In south Florida in particular, manipulation of water levels through levees, canals and floodgates changed natural water regimes and affected the stork’s habitat [1].
Wood stork populations are monitored using aerial synoptic surveys to count nests [5]. Although population estimates based on this technique can be biased by changes in colony location and may underestimate population size, it is considered the most effective method for monitoring long-term population trends [5]. Aerial surveys were conducted over a 10-year period starting in 1975 and again over two five-year periods starting in 1991 and 2001 [5]. The number of nesting colonies increased from 29 at the time of listing in 1984 to 71 in 2002 and numbers of nests increased from an estimated 6,245 in 1984 to 11,279 in 2006 [8]. The nesting pairs population then fell back to fewer than 6,000 in 2007-08 due to drought in Florida before rebounding to approximately 12,000 in 2009 [7]. Increases seen starting in the late 1990s in southern Florida may have been in part due to favorable rainfall and drying patterns [6]. Future monitoring will continue to track population trends and will also help to monitor effectiveness of the “Comprehensive Everglades Restoration Plan,” a recent long-term plan intended to restore more natural water regimes to the Everglades [6].
Reclassification from “endangered” to “threatened” can be considered when there are 6,000 nesting pairs with annual regional productivity of greater than 1.5 chicks per nest per year (averaged over three years) [1]. In 2002, a scientific protocol was drafted for monitoring stork nest productivity and data collection began in 2003 to assess progress toward this goal [5]. The wood stork (U.S. breeding distinct population segment) was recommended for downlisting in the 2007 five-year Review [8] and received a positive 90-day finding to downlist in 2010 [7].
CITATIONS
[1] U.S. Fish and Wildlife Service. 1997. Revised Recovery Plan for the U.S. Breeding population of the Wood Stork. Atlanta, GA. 41p.
[2] Rodgers, J.A. Jr., S.T. Schwikert, and L. White. 2004. Productivity of Wood Storks in North and Central Florida. U.S. Fish and Wildlife Service Wood Stork Report Newsletter 3(1), April 2004.
[3] Meyer, K.D. and P.C. Frederick. 2004. Final Report: Survey of Florida’s Wood Stork (Mycteria Americana) Nesting Colonies, 2004. U.S. Fish and Wildlife Service, Atlanta, GA.
[4] Brooks, B. 2002. Background on Wood Stork (Mycteria Americana). Power Point Presentation.
[5] U.S. Fish and Wildlife Service. 2003. Wood Stork Report #2, March 2003.
[6] Ogden, J.C. 2004. Status of Wading Bird Recovery in Florida -2003. U.S. Fish and Wildlife Service Wood Stork Report Newsletter 3(1), April 2004.
[7] U.S. Fish and Wildlife Service. Sept. 21, 2010. 90-Day Finding on a Petition To Reclassify the U.S. Breeding Population of Wood Storks From Endangered to Threatened. 75 Fed. Reg. 57426.
[8] U.S. Fish and Wildlife Service. 2007. Wood stork (Mycteria americana) 5-Year Review: Summary and Evaluation. Jacksonville, FL. 34 pp.
Yellowfin madtom (Noturus flavipinnis)
| Status: Threatened | Critical habitat: 9/9/1977 | Listed: 9/9/1977 | Recovery plan: 6/23/1983 |
Range: TN(b), VA(b) --- GA(x)
SUMMARY
The yellowfin madtom was feared to be extinct as of 1969, but three populations were discovered in the early 1970s, each separated by an impassible dam. Then, as now, it is threatened by chemical spills, coal mining, dredging and agricultural runoff. When listed as endangered in 1977, four populations existed, two of which have since increased in size and one (maybe two) of which has increased in extent. Two additional populations were created through a reintroduction program.
RECOVERY TREND
The yellowfin madtom (Noturus flavipinnis) prefers small-to-medium size streams with a moderate current, warm water, good water quality, and little siltation [1].
Historically it was widely distributed in lower gradient streams throughout the Tennessee River drainage from Chickamauga River upstream [1]. It is known to have inhabitated only six streams -- South Chickamauga Creek (Georgia), Hines Creek, a Clinch River tributary (Tennessee), North Fork Holston River (Virginia), Copper Creek (Virginia), Powell River (Tennessee), and Citico Creek (Tennessee) -- but there is considerable evidence that it also occurred in Abrams Creek (Tennessee) [1].
The madtom declined dramataically due to dams, water pollution and introduction of exotic fish. By 1969, it was feared extinct [4], but three populations were discovered in the early 1970s: Powell River, Copper Creek, and Citico Creek [1, 5]. Each of these small populations is separated by an impassible dam.
It was listed as an endangered species in 1977 with critical habitat designated in the Powell River (main channel from the Virginia-Tennessee state line upstream through Lee County) and Copper River (Copper Creek, main channel from its junction with Clinch River upstream through Scott County and upstream in Russell County to Dickensonville). Three populations were known at the time of listing and a fourth which likely existed at that time was discovered in 2004. Two of these populations have increased and size, and one (possibly two) have expanded their range. Two additional population were created by reintroduction.
In 2007, the U.S. Fish and Wildlife Service issued a decision to reintroduce this and 20 other threatened and endangered species into a contiguous river segment from the base of Douglas Dam (river mile 32.3) down the French Broad River (Knox and Sevier counties, Tennessee) to its confluence with the Holston River and then up the Holston River (Knox, Grainger, and Jefferson counties, Tennessee) to the base of Cherokee Dam (river mile 52.3) (72 FR 52433). The reintroduction would be done as an experimental non-essential designation and would include the lower five river miles of all tributaries that enter these river reaches. The 21 species to be reintroduced include the Appalachian monkeyface, birdwing pearlymussel, cracking pearlymussel, Cumberland bean, Cumberlandian combshell, Cumberland monkeyface, dromedary pearlymussel, fanshell, fine-rayed pigtoe, orange-foot pimpleback, oyster mussel, ring pink, rough pigtoe, Shiny pigtoe, white wartyback, Anthony's riversnail, duskytail darter, pygmy madtom, slender chub, spotfin chub and yellowfin madtom.
POWELL RIVER, Tenn.. In 2001, the yellowfin madtom was found at three new localities: several miles downstream of Buchanan Ford at the first bridge crossing, several miles above Buchanan Ford at the mouth of Mulberry Creek, and in the Virginia section of the Powell at Fletcher Ford [3]. This was the first historical or current report of the species in the Virginia section of the river. The river was described as supporting a "pretty good population" in 2004 [12].
COPPER CREEK, Va., tributary to the Clinch River. Sixteen individuals were observed in 2001 [3]. Copper appears to be the smallest natural population and was described as "hanging on" in 2004 [12].
CITICO CREEK, Tenn.. Five hundred adults [6] and 125 annual nests were thought to exist in the 1980s. A record number of fish were observed in 2001 (93 individuals) within its three-mile range within the creek [3]. The species was considered to be doing "very well" there. Much of all of the species range occurs within the Cherokee National Forest.
CLINCH RIVER, Va.. A "pretty good population" was discovered spanning 15 miles of river centered on Cleveland, Va. in 2004 well upstream of the Copper Creek confluence [10, 12]. Habitat below and above the occupied reach appears to be unsuitable. This population likely existed at the time of listing, but was undetectable due to a small population size [10]. Its recent discovery has been attributed to better surveying techniques (e.g. nightime snorkling) and an increase in population size to detectable levels [10].
ABRAMS CREEK, Tenn.. Yellowfin madtoms from Citico Creek were reintroduced to Abrams Creek within Great Smoky Mountains National Park by Conservation Fisheries, Inc. in 1986 and all subsequent years through 2004 [7]. A naturally reproducing population has been established and dispersed beyond the stocking sites [3]. The fish/observation effort ratio was considered "good" in 2001 [3] and the population to be "doing very well" in 2005 [7]. Stocking was reduced to a level sufficient to augment genetic diversity and encourage dispersal in recent years and ceased in 2005 [10]. However, the species is still not as well established as the smoky madtom and duskytail darter which were simultaneously reintroduced [10].
TELLICO RIVER, Tenn. In 2002, the U.S. Fish and Wildlife Service issued a decision to reintroduce the yellowfin madtom as an "experimental non-essential" population to the Tellico River, between the backwaters of the Tellico Reservoir (approximately river mile 19) and river mile 33 (near the Tellico Ranger Station), Monroe County, Tenn. [2]. Fish were introduced in 2003 and by 2005 natural reproduction had not yet been documented, but the species was still present [7]. Many years passed between the first stockings and the first evidence of natural reproduction in Abrams Creek, so the lack of current evidence is not surprising.
Rangewide quantitative population data are not available, but as of 2011 the species is considered to be "doing well" [13].
CITATIONS
[1] U.S. Fish and Wildlife Service. 1983. Yellowfin Madtom Recovery Plan. U.S. Fish and Wildlife Service, Atlanta, GA. 33 pp.
[2] U.S. Fish and Wildlife Service. 2002. Establishment of Nonessential Experimental Population Status and Reintroduction of Four Fishes in the Tellico River. U.S. Fish and Wildlife Service, August 12, 2002 (67 FR 52420).
[3] Shute, P.W. and D.A. Etnier. 2001. Regional Reports: 2002 Report of Region 3 - North-Central. Southeastern Fishes Council, http://www.flmnh.ufl.edu/fish/organizations/sfc/regionalreports/R3NC2002.htm
[4] Taylor, W.R. 1969. A revision of the catfish genus Noturus Rafinesque with an analysis of higher groups in the Ictaluridae. Bull. U.S. Natl. Mus. No. 282. 315 pp.
[5] Taylor, W.R., R.E. Jenkins, and E.A. Lachner. 1971. Rediscovery and description of the ictalurid catfish, Noturus flavipinnis. Proc. Biol. Soc. Wash. 83:469-476.
[6] Shute, P.W. 1984. Ecology of the rare yellowfin madtom, Noturus flavipinnis Taylor, in Citico Creek, Tennessee. M.S. Thesis. Univ. Tenn., Knoxville. 101 pp.
[7] Shute, J.R. 2005. Fall 2005 Update. Conservation Fisheries, Inc. Newsletter #29, September 2005, available at www.conservationfisheries.org/Newsletters/newsletter_29_sept_2005.htm
[8] U.S. Fish and Wildlife Service. 1988. Determination of Nonessential Experimental Population Status for an introduced Population of the Yeliowfin Madtom in Virginia and Tennessee. U.S. Fish and Wildlife Service, August 4, 1988 (53 FR 29335).
[9] Shute, J.R. 2005. Personal communication with J.R. Shute, Conservation Fisheries, Inc., November 11, 2005.
[10] Rakes, P. 2005. Personal communication with Patrick Rakes, Conservation Fisheries, Inc., November 11, 2005.
[11] Lennon, R.E. and P.S. Parker. 1959.The Reclamation of Indian and Abrams Creeks, Great Smoky Mountains National Park. Special Scientific Report - Fisheries No. 306. U. S. Department of the Interior, Fish and Wildlife Service, Washington, DC.
[12] Shute, J.R. 2004. Fall 2004 Update. Conservation Fisheries, Inc. Newsletter #25, December 2004.
[13] Conservation Fisheries, Inc. 2011. Yellowfin Madtom Species Profile. Available at: http://conservationfisheries.org/index.php/species/current-species/noturus-flavipinnis-yellowfin-madtom/.
